How Your Sleep, Lifestyle Shape Your Health: Insights You Need to Know
Ma Li
Dec 26, 2024
Did you know that your sleep patterns and daily lifestyle choices hold the key to your overall health? From boosting energy levels to preventing chronic illnesses, these two factors work hand in hand to shape your physical and mental well-being. Yet, many of us overlook their profound impact, caught up in the hustle and bustle of life.
In this blog, we'll compile a comprehensive data analysis to explore how your sleep and lifestyle habits intertwine to influence your health and share practical insights to help you thrive. Ready to unlock the secrets to a healthier you? Let's dive in!
Background info
The "Sleep Health and Lifestyle Dataset" dataset we use is from Kaggle. The following data analysis is powered by Powerdrill.
Distribution of BMI Categories Across Different Genders
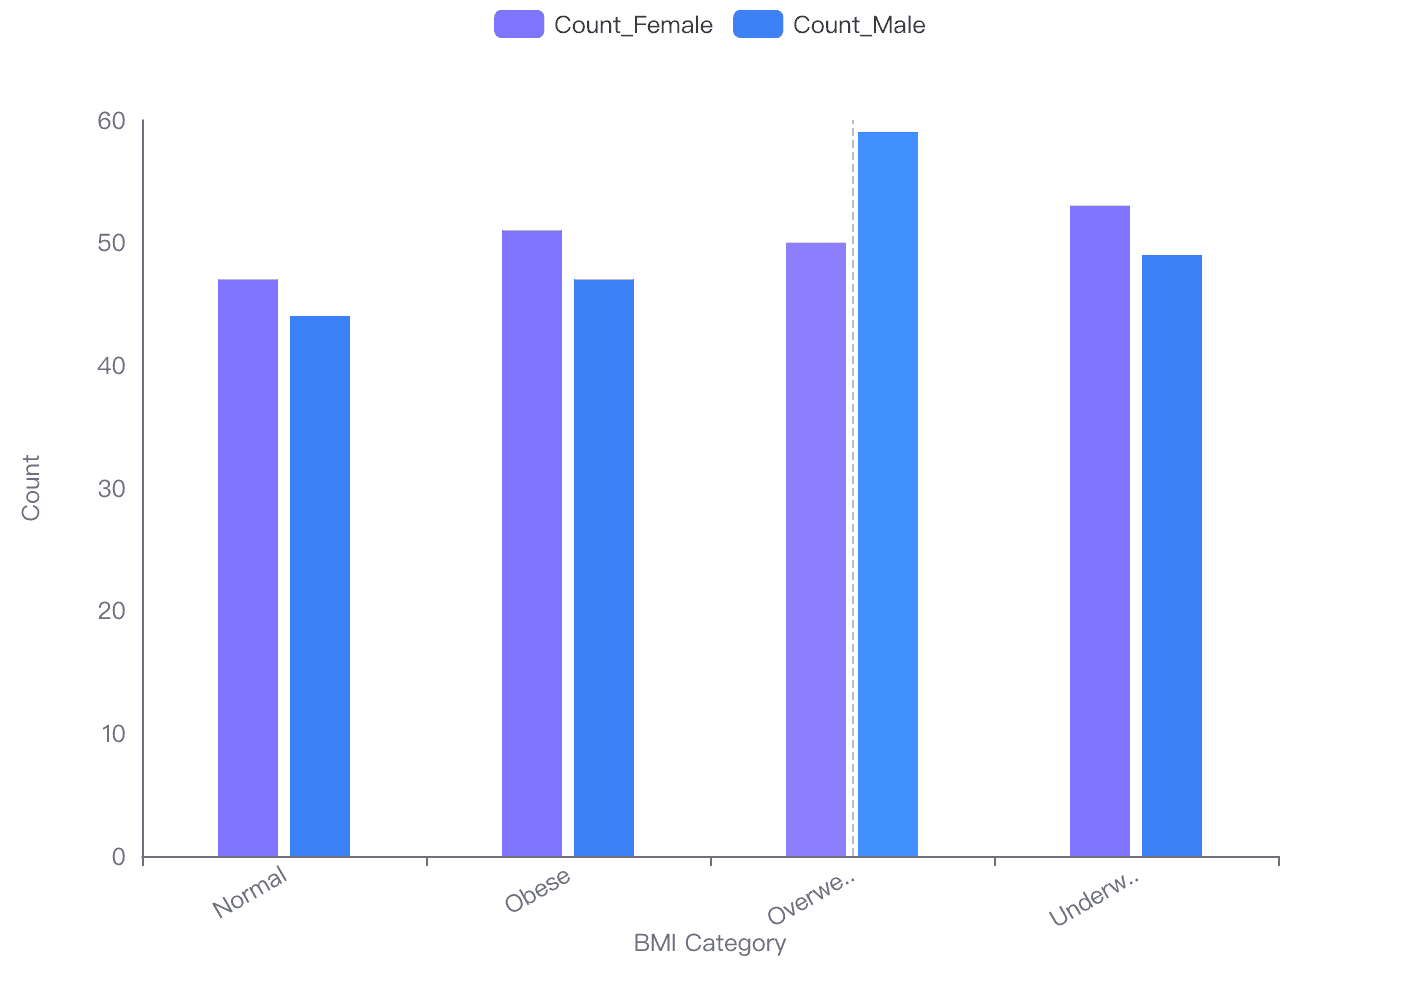
Data Analysis
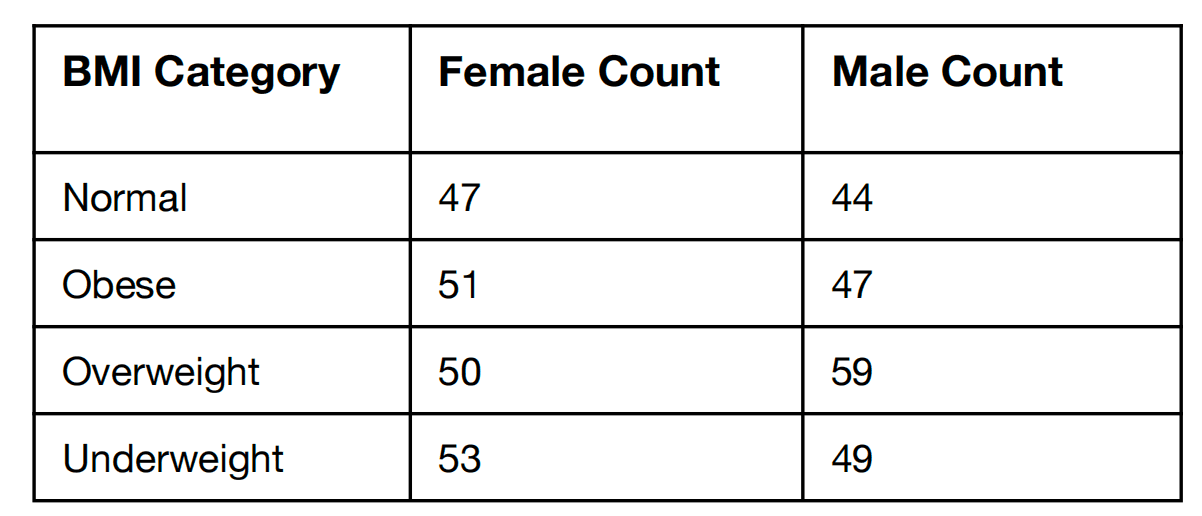
Key Point 1: Females tend to have higher counts in the "Obese" and "Underweight" categories.
Key Point 2: Males have a notably higher count in the "Overweight" category, indicating a potential area for targeted health interventions.
Blood Pressure Increases with Age
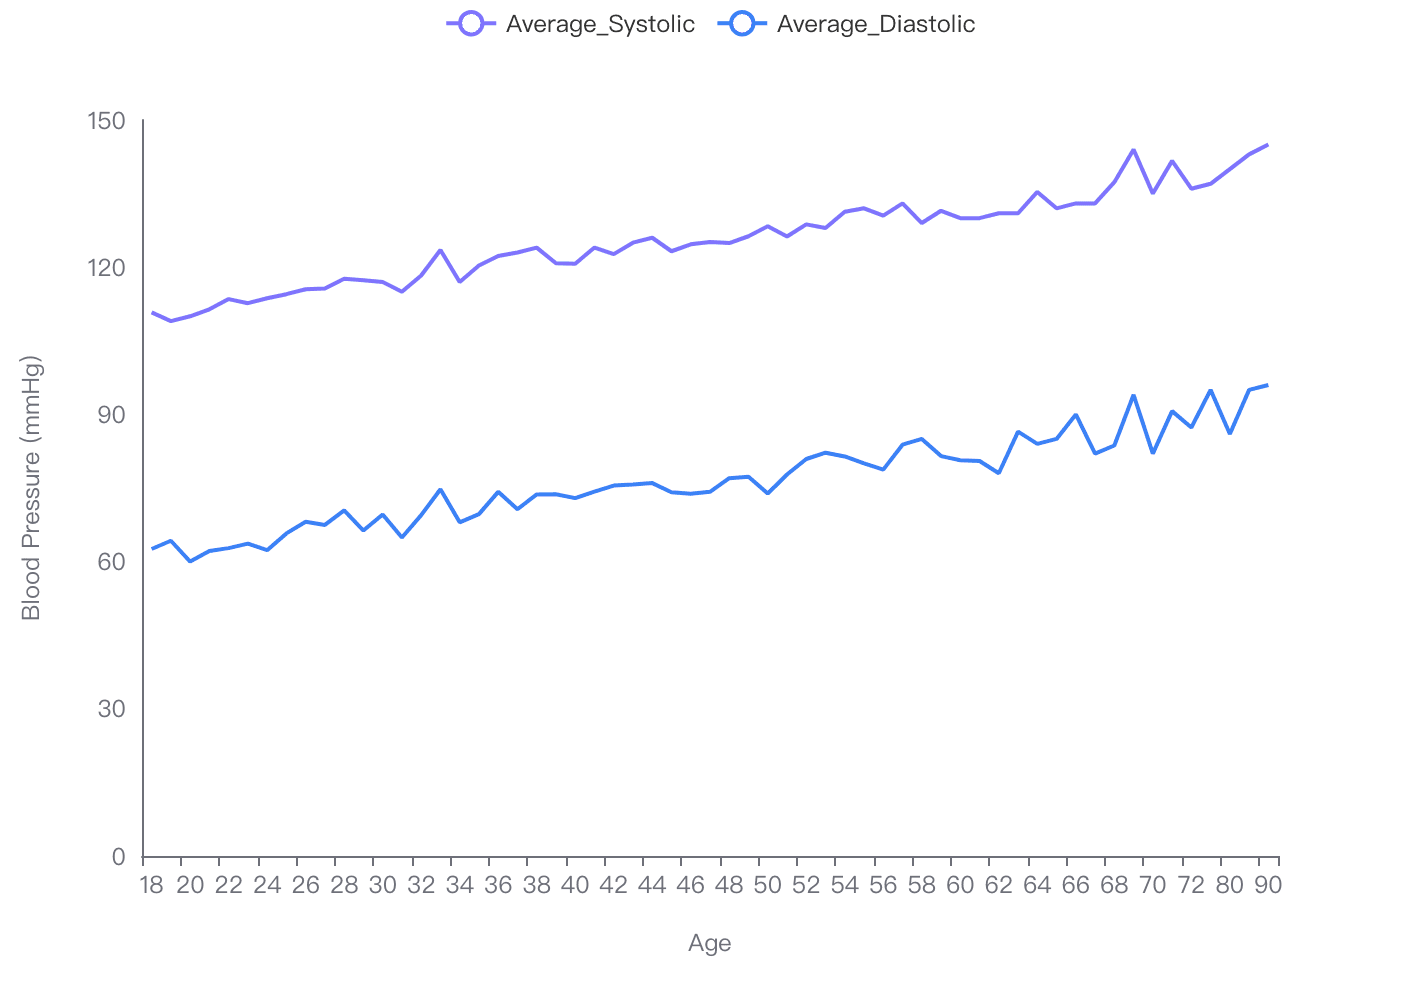
Age Range: The data covers ages from 18 to 90.
Visualization Insights
Increasing Trend: Both systolic and diastolic pressures show an upward trend with age.
Systolic Pressure: Increases more sharply, especially noticeable after age 50.
Diastolic Pressure: Also rises with age but at a slower rate compared to systolic pressure.
Conclusion and Insights
Age-Related Increase: Blood pressure readings, both systolic and diastolic, tend to increase with age.
Health Implications: Monitoring blood pressure is crucial, especially for older age groups, to manage potential health risks.
Sleep Quality Varies with Occupation
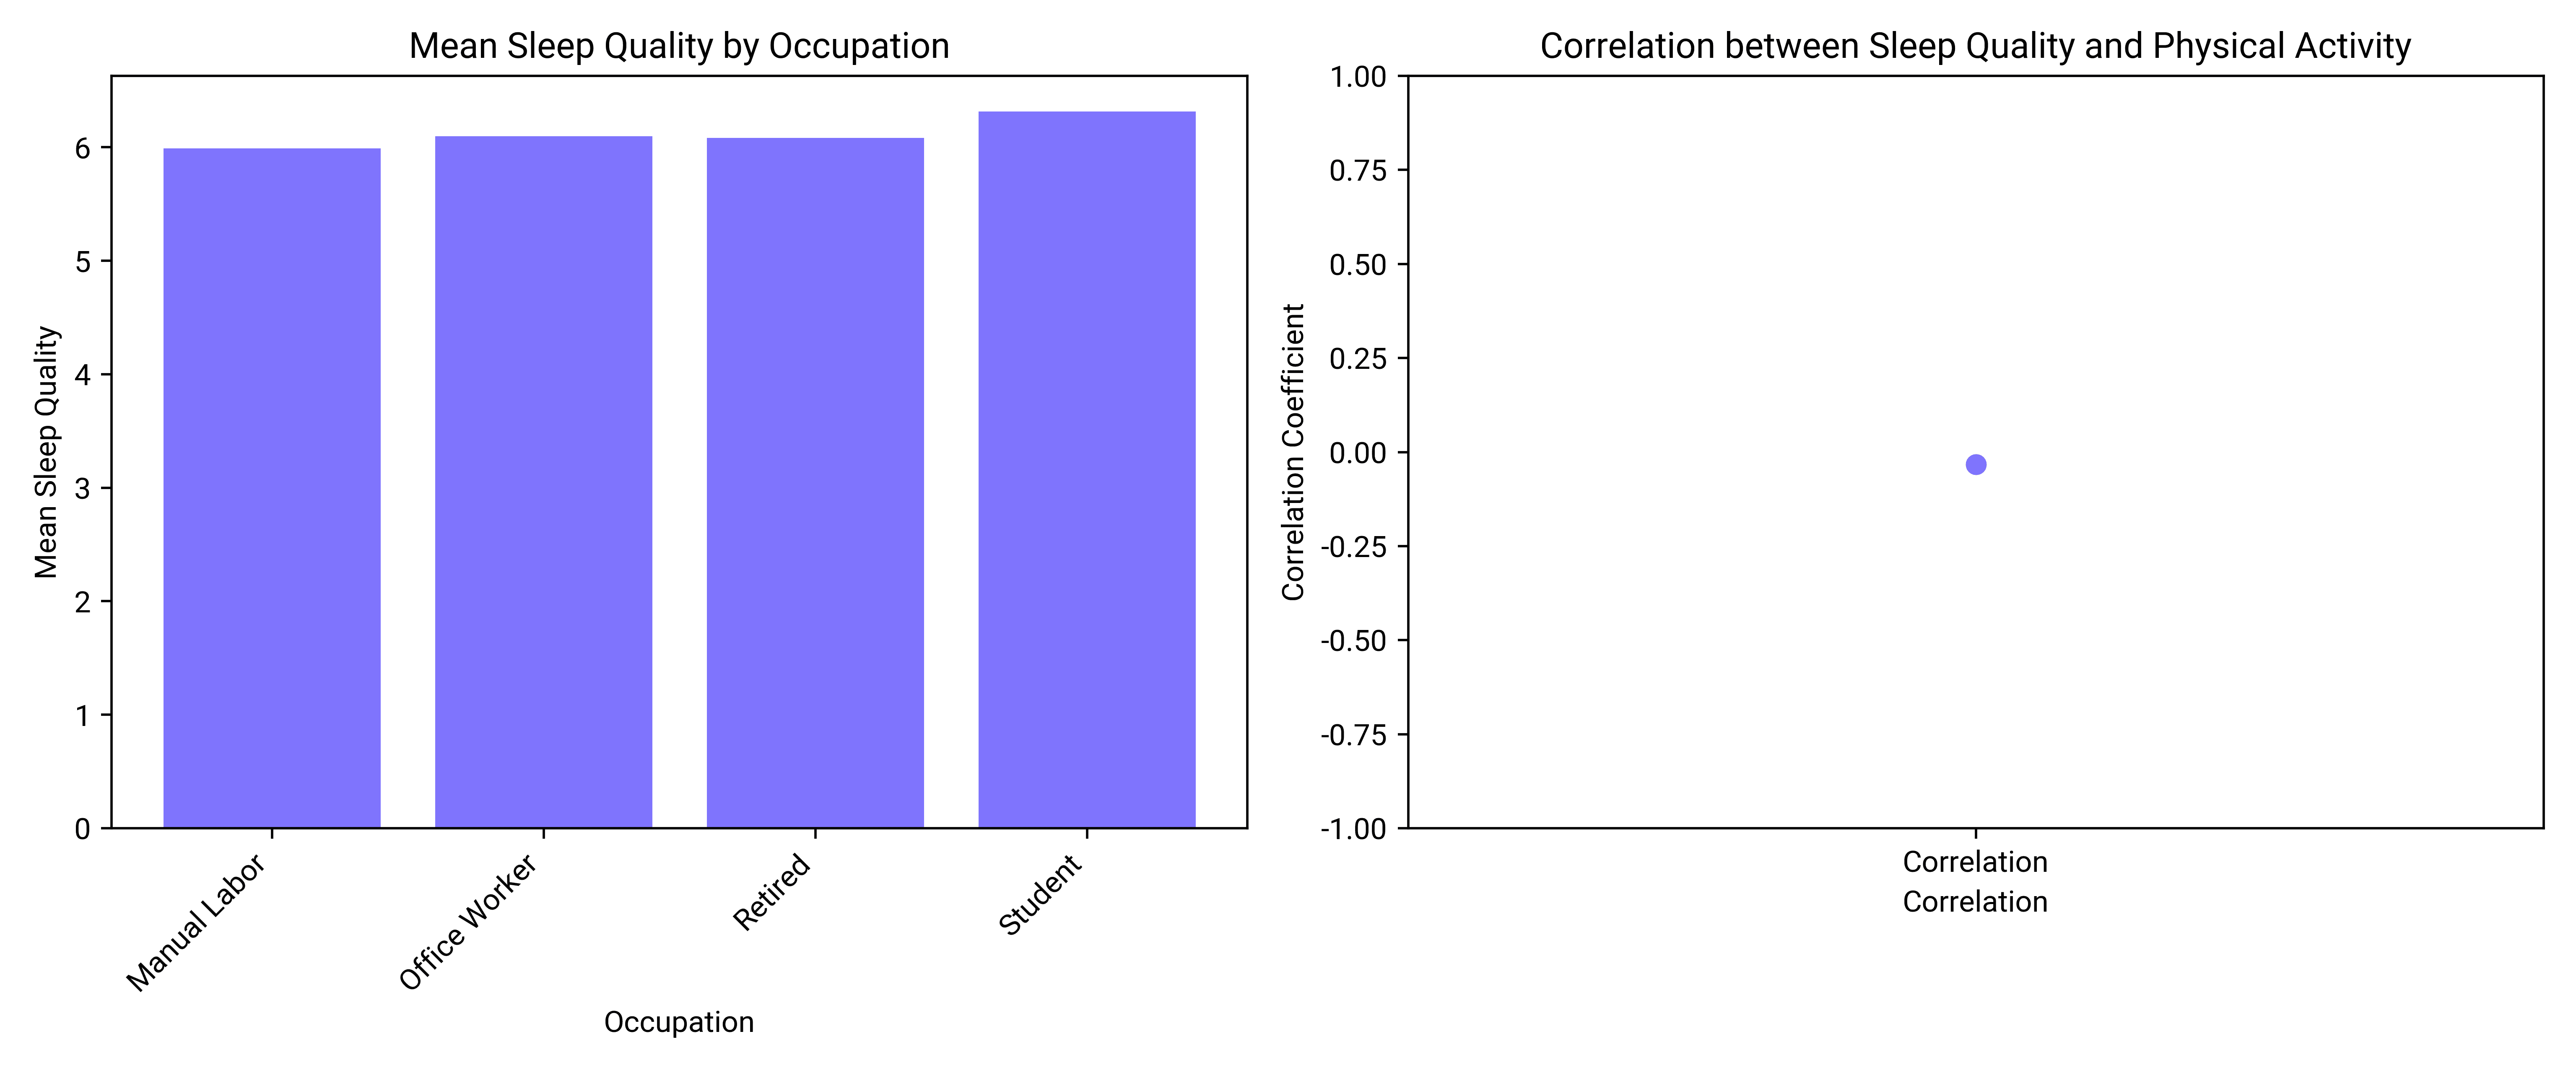
Bar Chart: Shows the mean sleep quality for each occupation, with students having the highest mean.
Scatter Plot: Illustrates the weak correlation between sleep quality and physical activity, with data points showing little to no trend.
Conclusion and Insights
Variation in Sleep Quality: There is a slight variation in sleep quality across different occupations, with students reporting the highest average sleep quality.
Correlation with Physical Activity: The correlation between sleep quality and physical activity is negligible, suggesting that physical activity levels do not significantly impact sleep quality in this dataset.
Sleep Duration Increases with Age, but not Sleep Quality
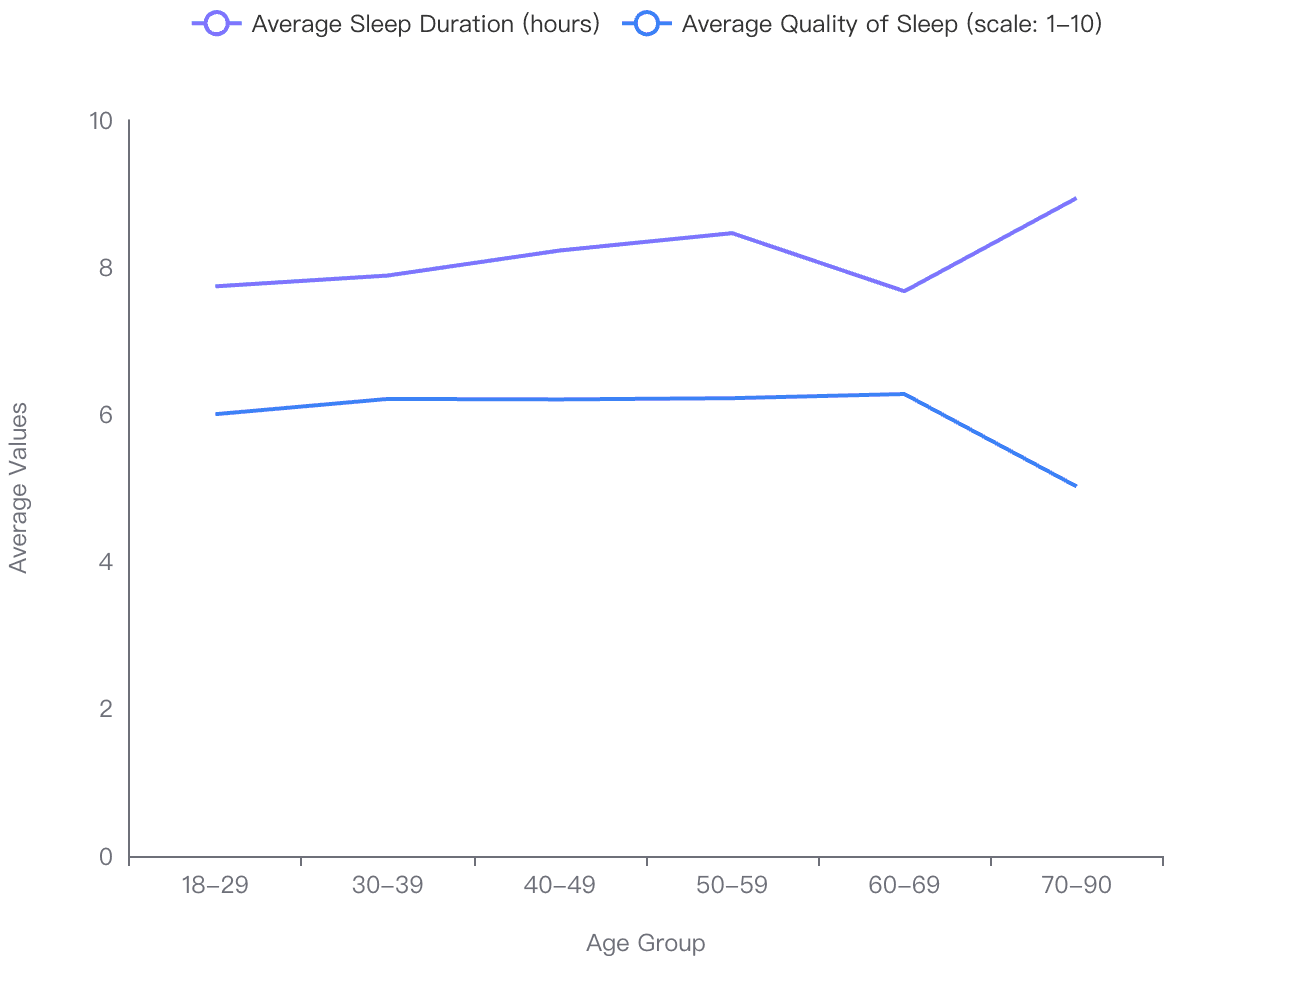
Trend in Sleep Duration: Generally increases with age, peaking in the 70-90 age group.
Trend in Quality of Sleep: Remains relatively stable across age groups, with a slight dip in the 70-90 age group.
Conclusion and Insights
Sleep Duration vs. Age: Older age groups tend to have longer sleep durations.
Quality of Sleep vs. Age: Quality of sleep does not significantly improve with longer sleep duration and slightly decreases from age 60.
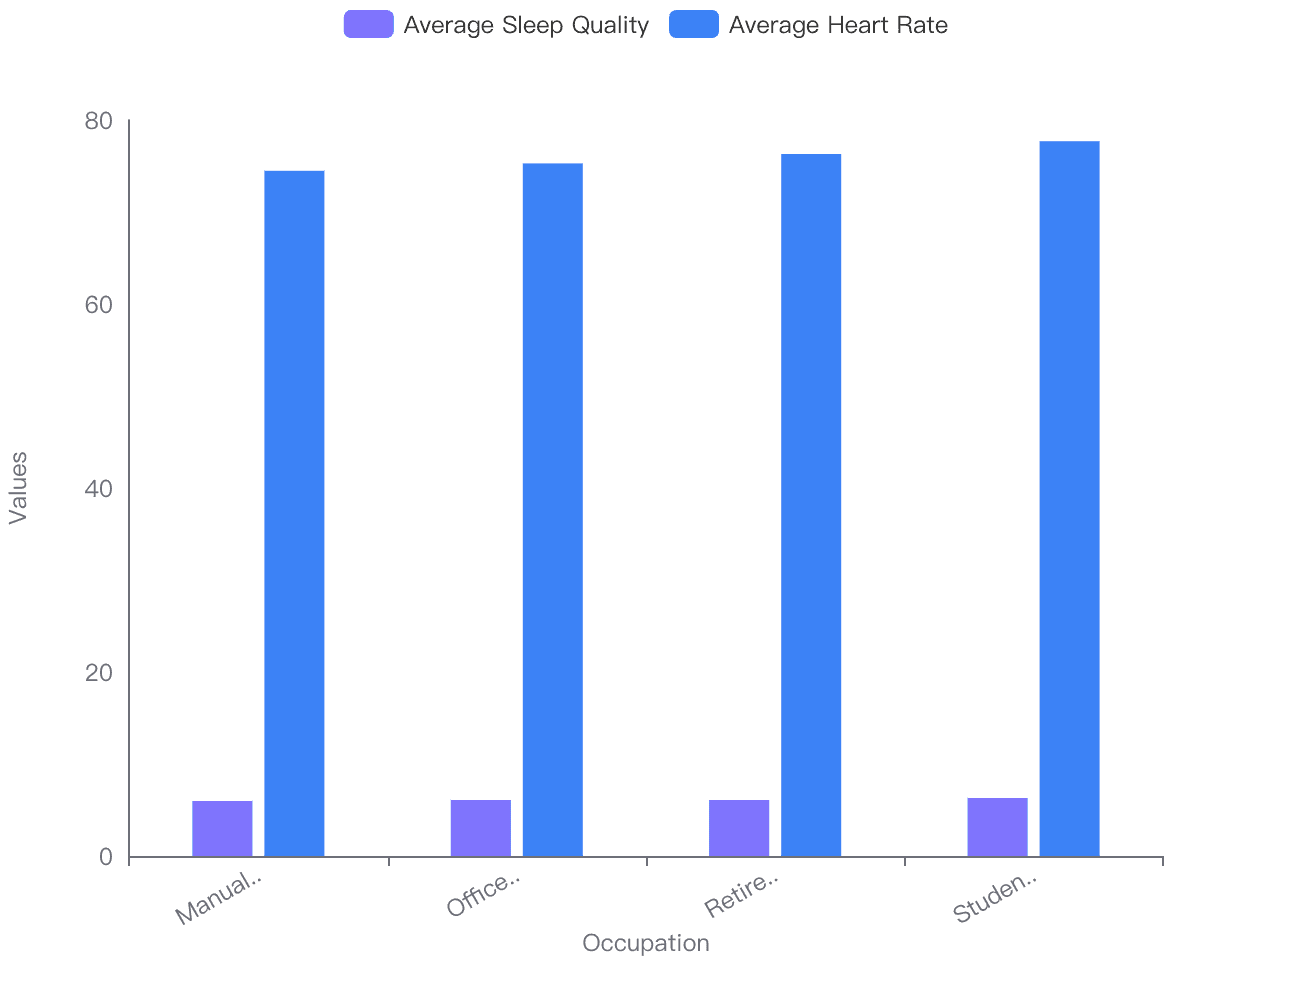
Sleep Quality vs Heart Rate
Patterns:
There is a slight increase in sleep quality from manual laborers to students.
Heart rate tends to increase with higher sleep quality, particularly noticeable in students.
Implications for Occupational Health:
Manual Labor: Lower sleep quality and heart rate may indicate higher physical stress or inadequate rest.
Students: Higher sleep quality and heart rate could suggest better rest but also higher stress levels.
Office Workers and Retired: Moderate values suggest balanced cardiovascular health but may require monitoring for stress-related impacts.


