
Introduction
What if the key to YouTube growth isn’t just luck or creativity—but data?
Using Powerdrill Bloom, I analyzed a Kaggle YouTube dataset to uncover exactly which content categories, posting habits, and regions drive real success on the platform.
The results were surprising. From discovering that Latin American Music channels achieve nearly 37% higher engagement than the global average, to spotting massive white-space opportunities in Korean gaming and Christian music, this analysis exposes where creators can still grow fast in an increasingly competitive landscape.
Beyond raw numbers, Powerdrill Bloom’s AI-driven insights reveal how engagement efficiency, posting frequency, and regional concentration truly shape YouTube success—and how data-backed strategies can help creators rise above the noise.
If you’ve ever wondered which niches are worth investing in, or how to grow smarter with data, this deep dive will show you the answers hidden in YouTube’s algorithmic pulse.
To view the orginal analysis results or sample PPT, you can visit: https://bloom.powerdrill.ai/share/hdnfWohi
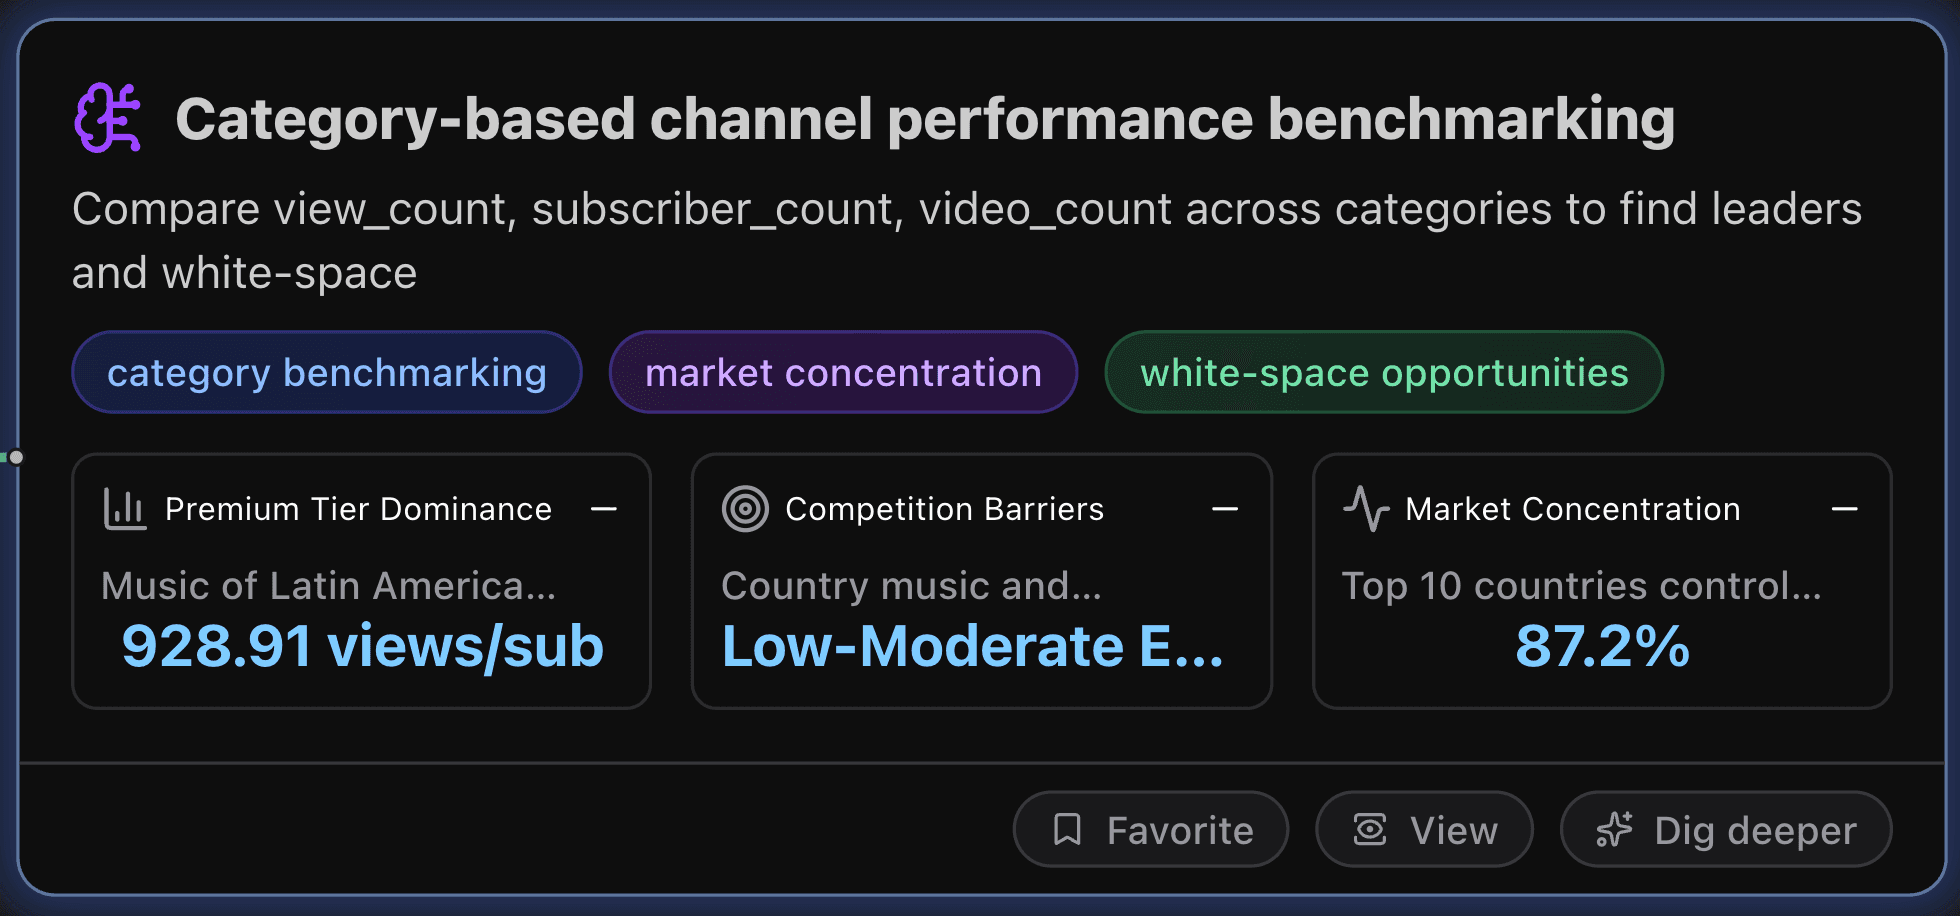
Category-based channel performance benchmarking
This section compares view_count, subscriber_count, video_count across categories to find leaders and white-space.
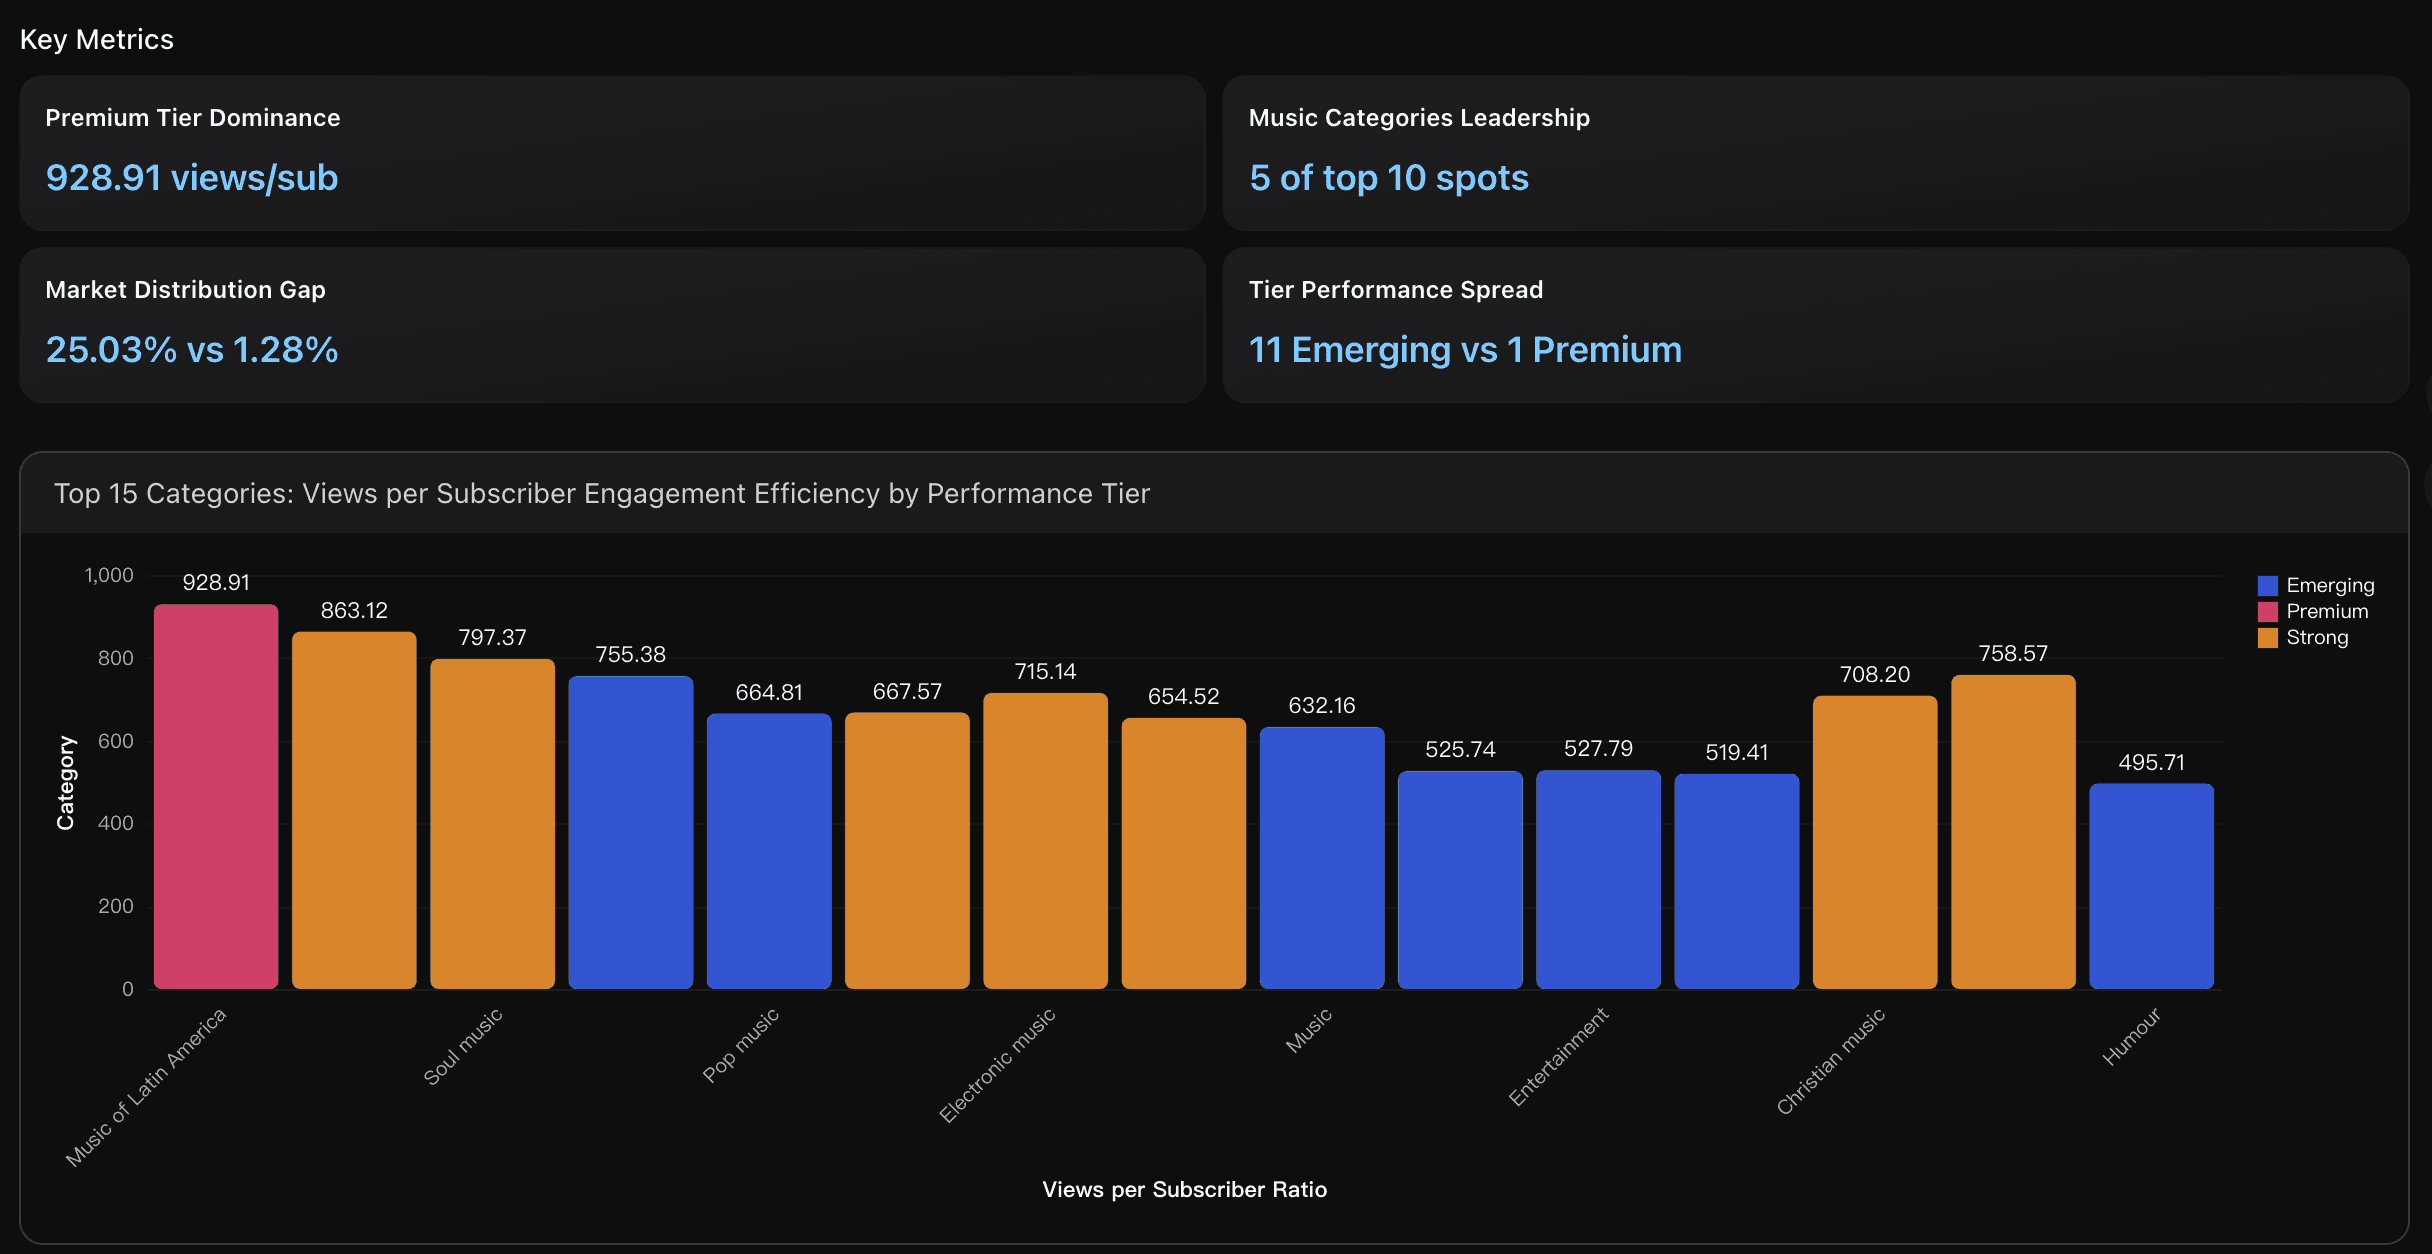
Key Metrics
Premium Tier Dominance
Music of Latin America achieves the highest engagement efficiency (928.91 views per subscriber) among top 15 categories, outperforming the industry average by 36.41%. This premium tier category demonstrates exceptional audience loyalty and content appeal, setting the benchmark for subscriber engagement optimization. Only one category achieves Premium tier status, indicating significant concentration of high-performance capabilities.
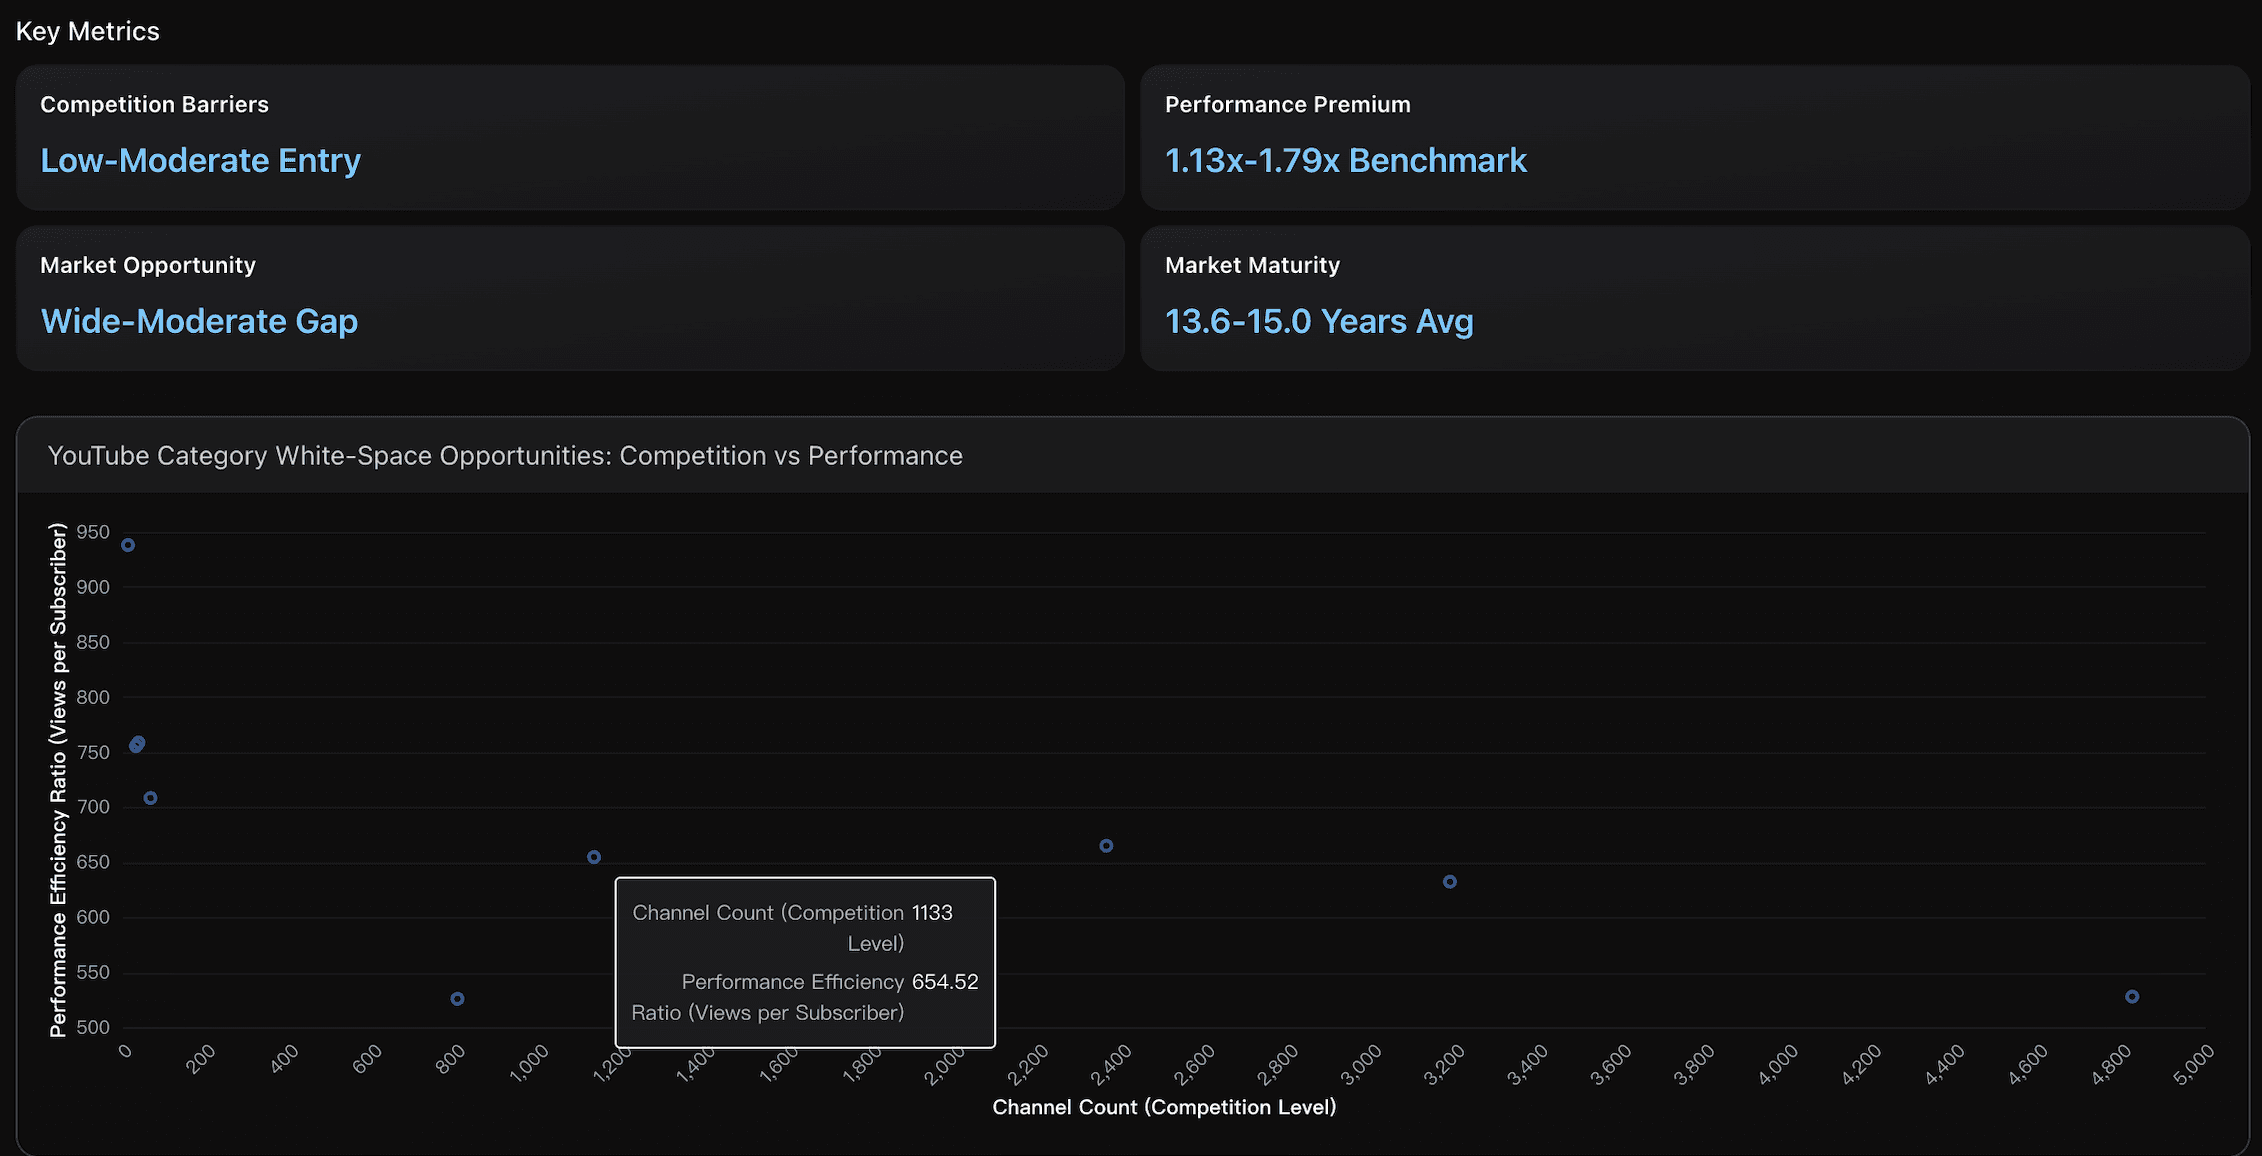
Competition Barriers
Country music and Christian music categories demonstrate low entry barriers with HHI scores of 688 and 440 respectively, significantly below the 1500 threshold indicating competitive markets. Professional wrestling shows high barriers (HHI 7196) with top 4 channels controlling 90.9% market share, while baseball has moderate barriers (HHI 2929). The fragmented nature of country and Christian music markets creates accessible entry points for new content creators.
Market Concentration
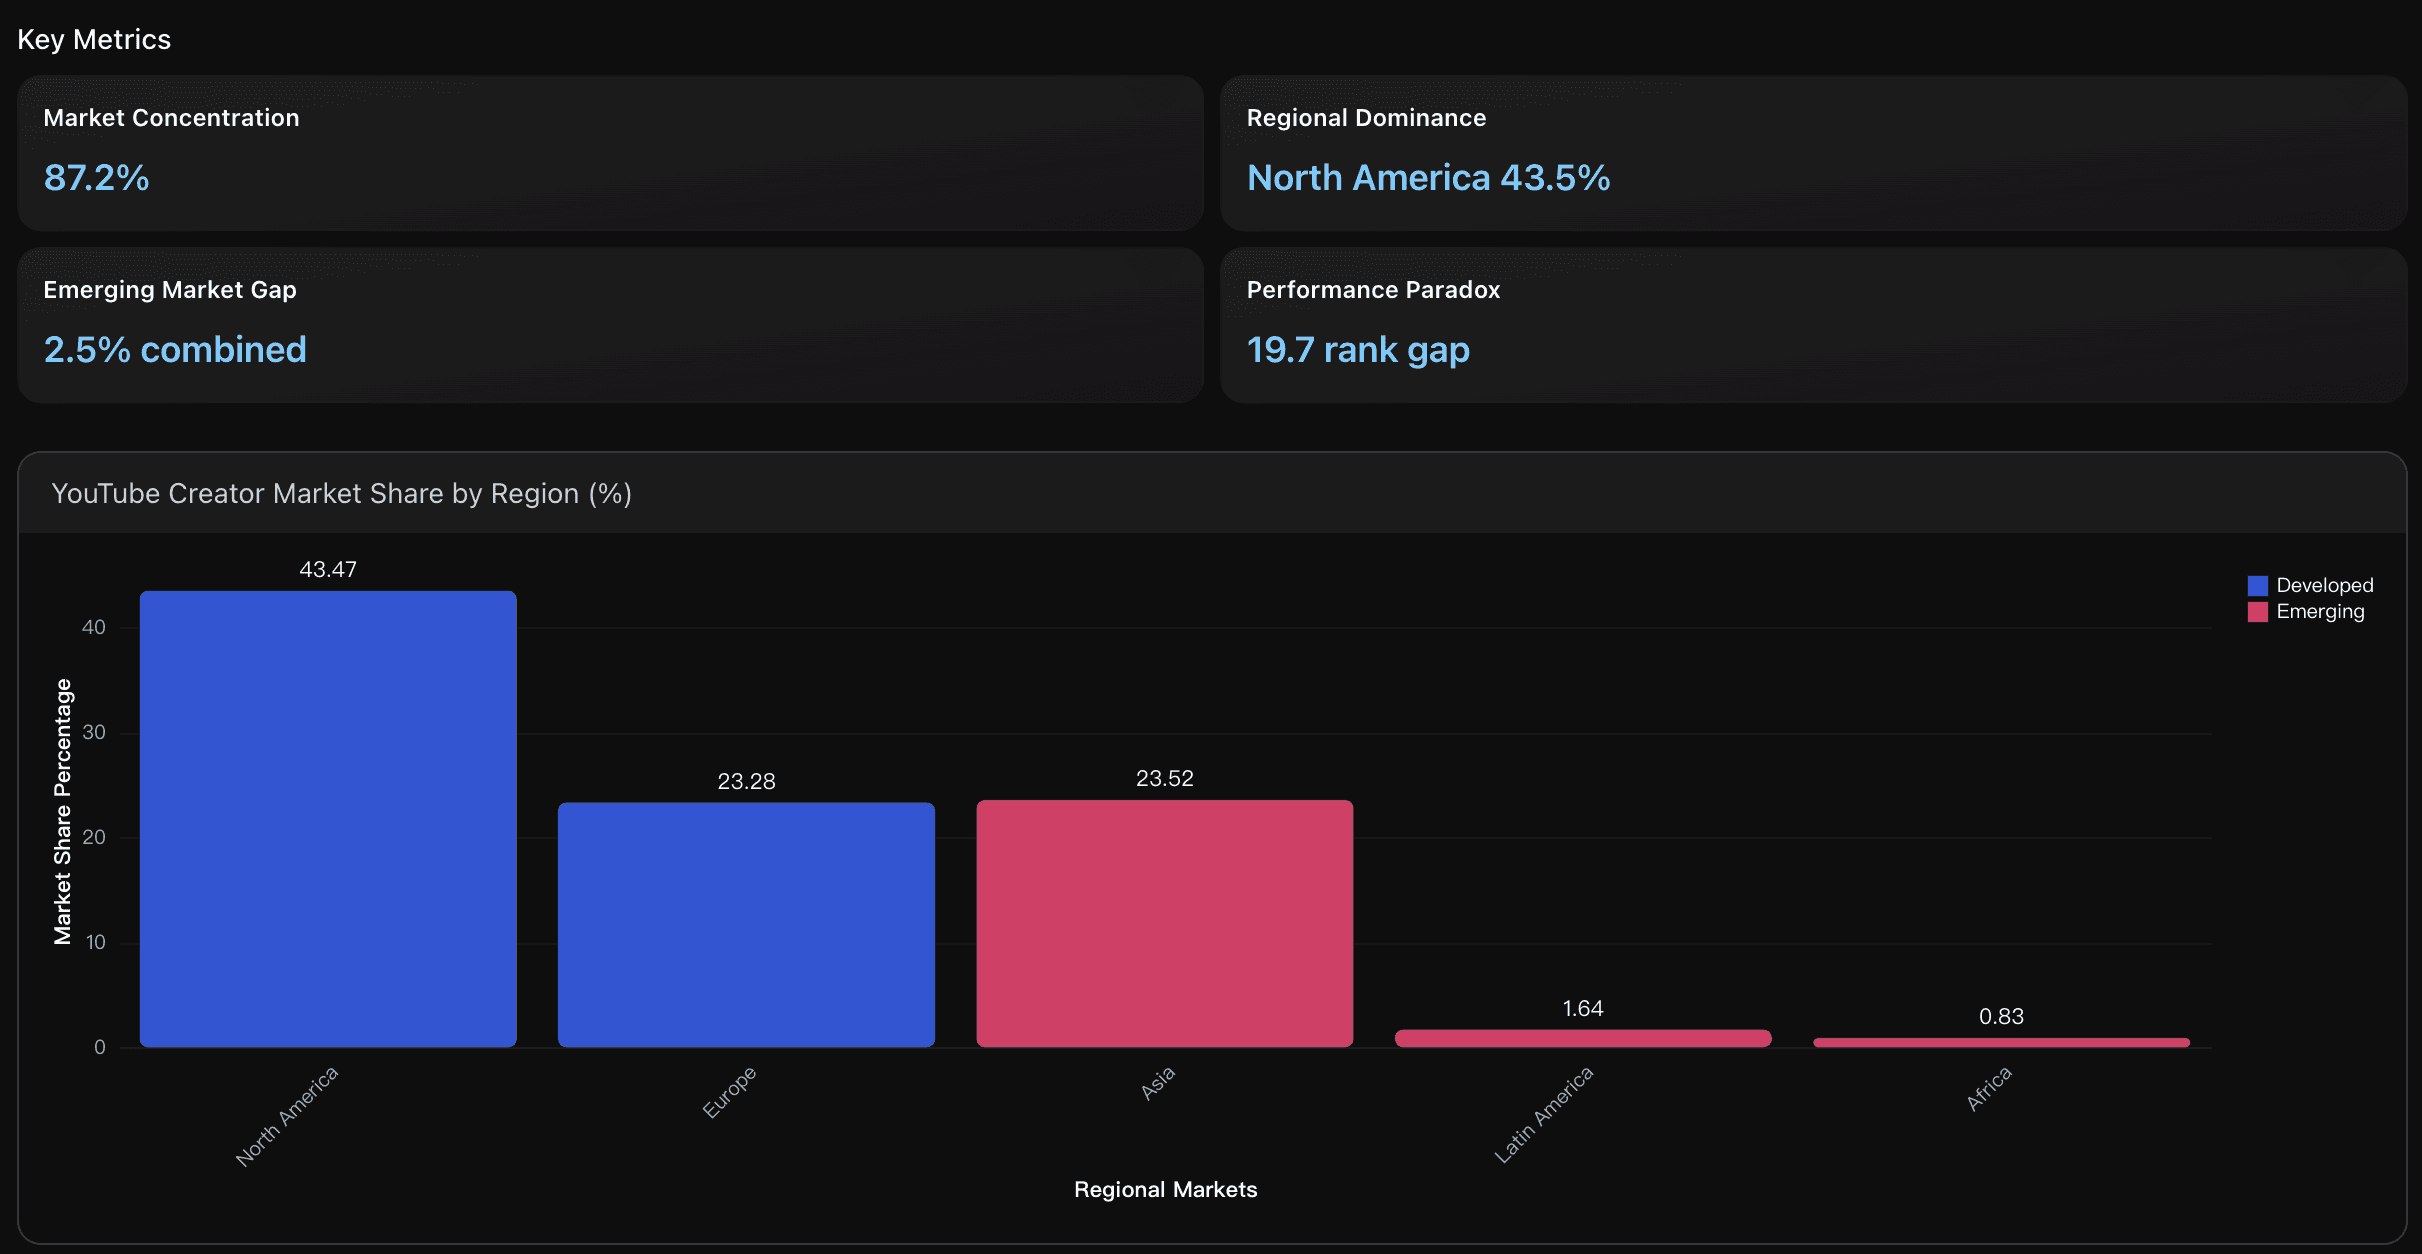
Top 10 countries control 87.2% of global YouTube creator market share, with extreme concentration shown by HHI index of 17,893,606. United States alone commands 35.1% share, followed by India (16.5%) and United Kingdom (11.9%), indicating highly monopolized geographic distribution that limits opportunities for creators in smaller markets.
Actionable Insights
Focus your channel development strategy on high-engagement music categories, particularly Latin Music, R&B, and Soul Music, which demonstrate 928.91 views per subscriber efficiency compared to the 680.96 industry average. If already in Entertainment or Film categories, adopt music content integration strategies to boost your current 527.79 views/subscriber toward the 863.12 Strong tier benchmark. Consider strategic partnerships with music-oriented creators or incorporate music elements into existing content formats, as music categories consistently achieve 36.41% higher engagement rates than broad entertainment categories.
Focus market entry strategy on Country Music and Christian Music categories, which offer the optimal combination of low competition barriers (HHI scores below 688-440 respectively) and strong performance premiums ( 1.35x and 1.30x platform benchmarks). These categories demonstrate wide opportunity windows with performance gaps exceeding 5.6x between top and average performers, while maintaining accessible entry points through fragmented market structures. Leverage the proven audience demand evidenced by 2.6B-2.8B average view counts per category, and capitalize on contemporary market momentum particularly in Christian music's streaming breakthrough trend. Avoid oversaturated categories like Entertainment with 4,826 channels competing for similar audience attention.
Focus expansion efforts on underrepresented high-performance markets in emerging economies. Specifically target Latin America and Africa which collectively hold only 2.5% market share despite showing superior performance efficiency. Priority countries include Jordan (rank #1 with only 2 channels), Puerto Rico (rank #2 with 7 channels), and El Salvador (rank #5 with 2 channels). These markets demonstrate that creators can achieve exceptional view counts with minimal competition. Additionally, address over-saturation in developed markets like Australia ( 37.1 channels per million population) and Canada ( 30.1 channels per million ) where high creator density has led to below-median performance metrics, suggesting market maturity and increased competition for audience attention.
Analysis Overview
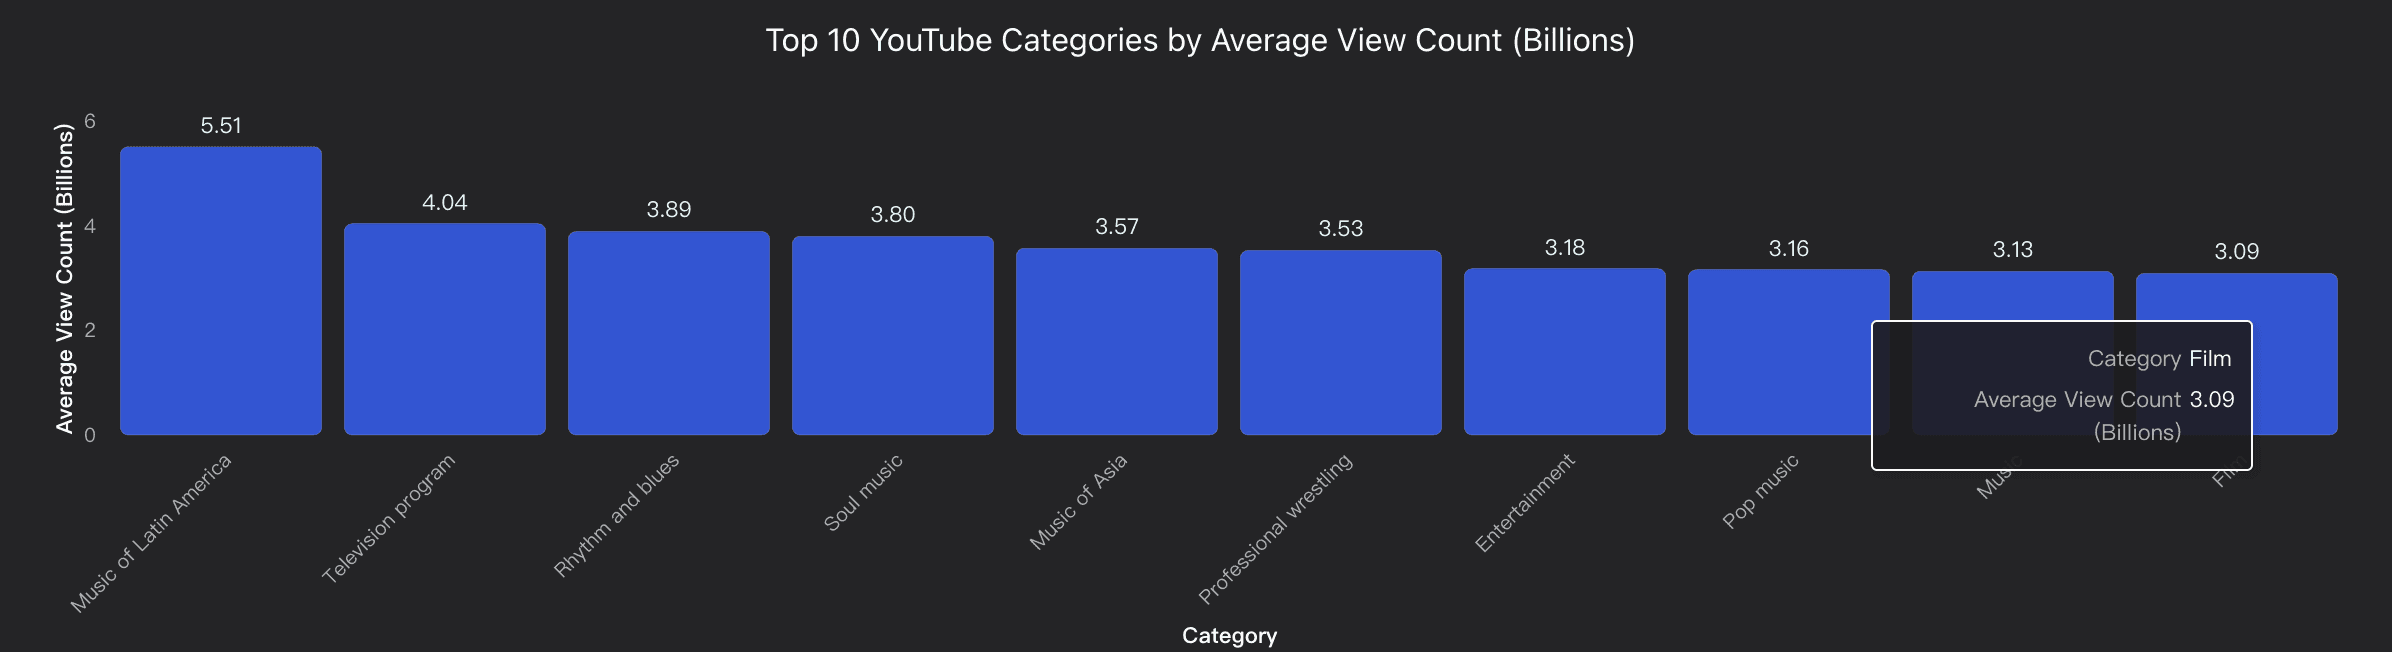
Category-based YouTube performance analysis reveals significant market stratification and white-space opportunities. Music of Latin America emerges as the top performer with 5.51 billion average views and exceptional 928.91 views per subscriber engagement efficiency (+36.41% vs category average). Rhythm & Blues demonstrates the highest content performance at 10.4 million views per video, while Soul music shows strong growth efficiency with 8,598 subscribers per video.
The analysis identifies three major white-space opportunities: Professional Wrestling ( 33 channels , 3.53B avg views), indicating massive undersupply relative to performance potential; Christian Music ( 68 channels , 2.81B avg views) and Country Music ( 39 channels , 2.64B avg views) showing similar patterns. Geographic analysis reveals market concentration with top 15 categories controlling 40.82% of total channels ( 19,280 of 47,228 ), yet significant regional gaps exist - particularly in Latin America where Colombia shows exceptional performance ( 14.7B avg views) with only 0.173 channels per million population.
Entertainment ( 4,826 channels ) and Music categories ( 3,188 channels ) dominate channel volume but show lower per-channel efficiency, suggesting market saturation in mainstream segments. Strategic opportunities exist in high-performance, low-competition niches where content creators can achieve 3-10x higher engagement rates compared to saturated categories. The data supports focusing on specialized music genres and regional content rather than competing in oversaturated mainstream entertainment markets.
Data Analysis
Category Performance Hierarchy
Analysis of top 15 YouTube categories by average view count, comparing Music of Latin America (5.51B), Television programs (4.04B), and Rhythm & Blues (3.89B) against broader entertainment categories, with focus on engagement efficiency ratios and content performance metrics.
White-space Market Opportunities
Identification of high-performing categories with low channel competition, particularly Professional Wrestling (33 channels, 3.53B avg views), Christian Music (68 channels, 2.81B avg views), and Country Music (39 channels, 2.64B avg views) showing significant market gaps.
Geographic Market Concentration
Geographic distribution analysis revealing market concentration patterns with top 15 categories controlling 40.82% of total channels, highlighting regional opportunities in Latin America, Asia, and underserved Soul/R&B markets across emerging economies.
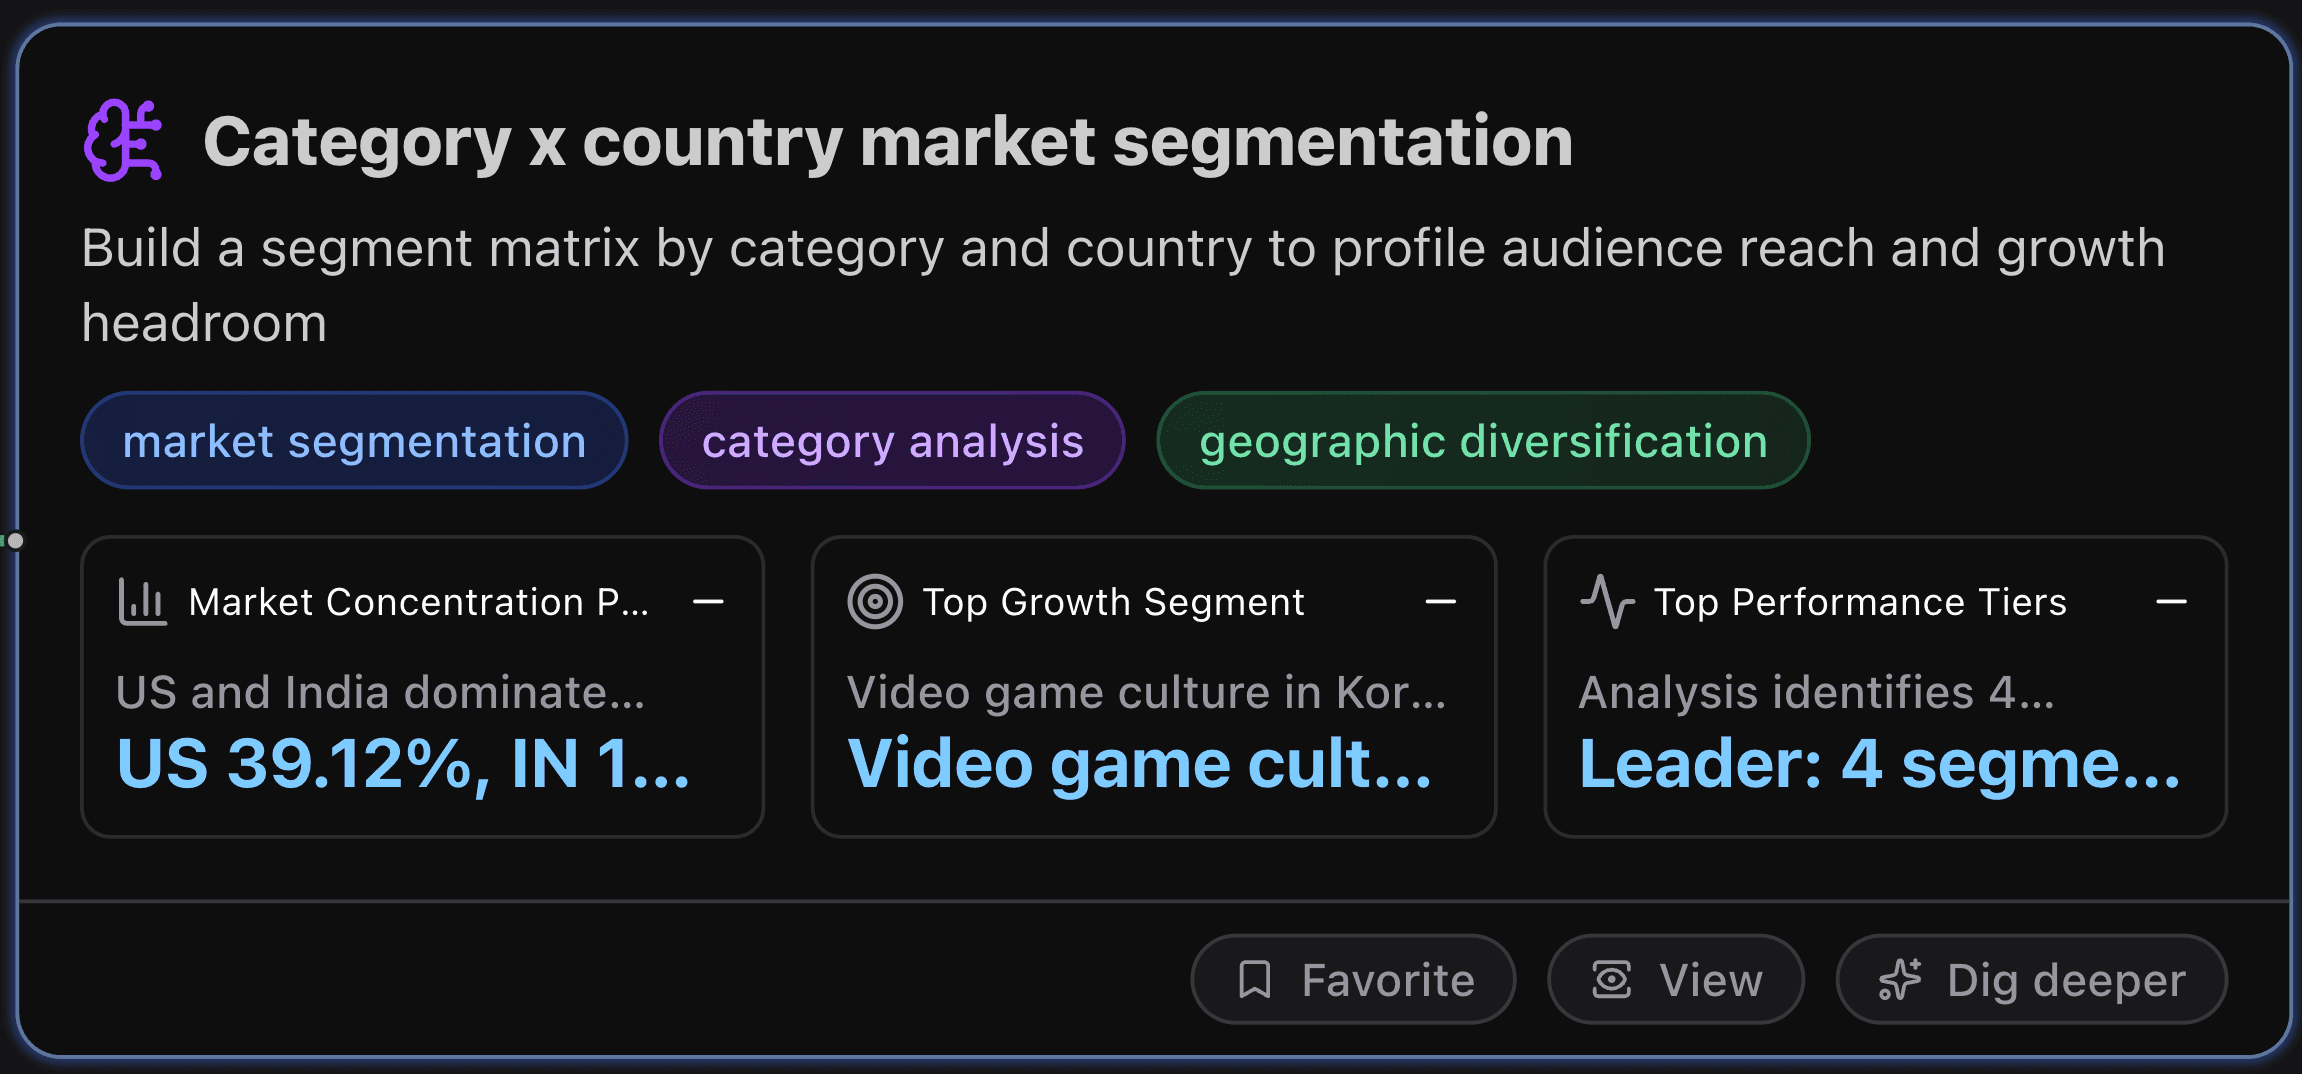
Category x country market segmentation
This section builds a segment matrix by category and country to profile audience reach and growth headroom.
Key Metrics
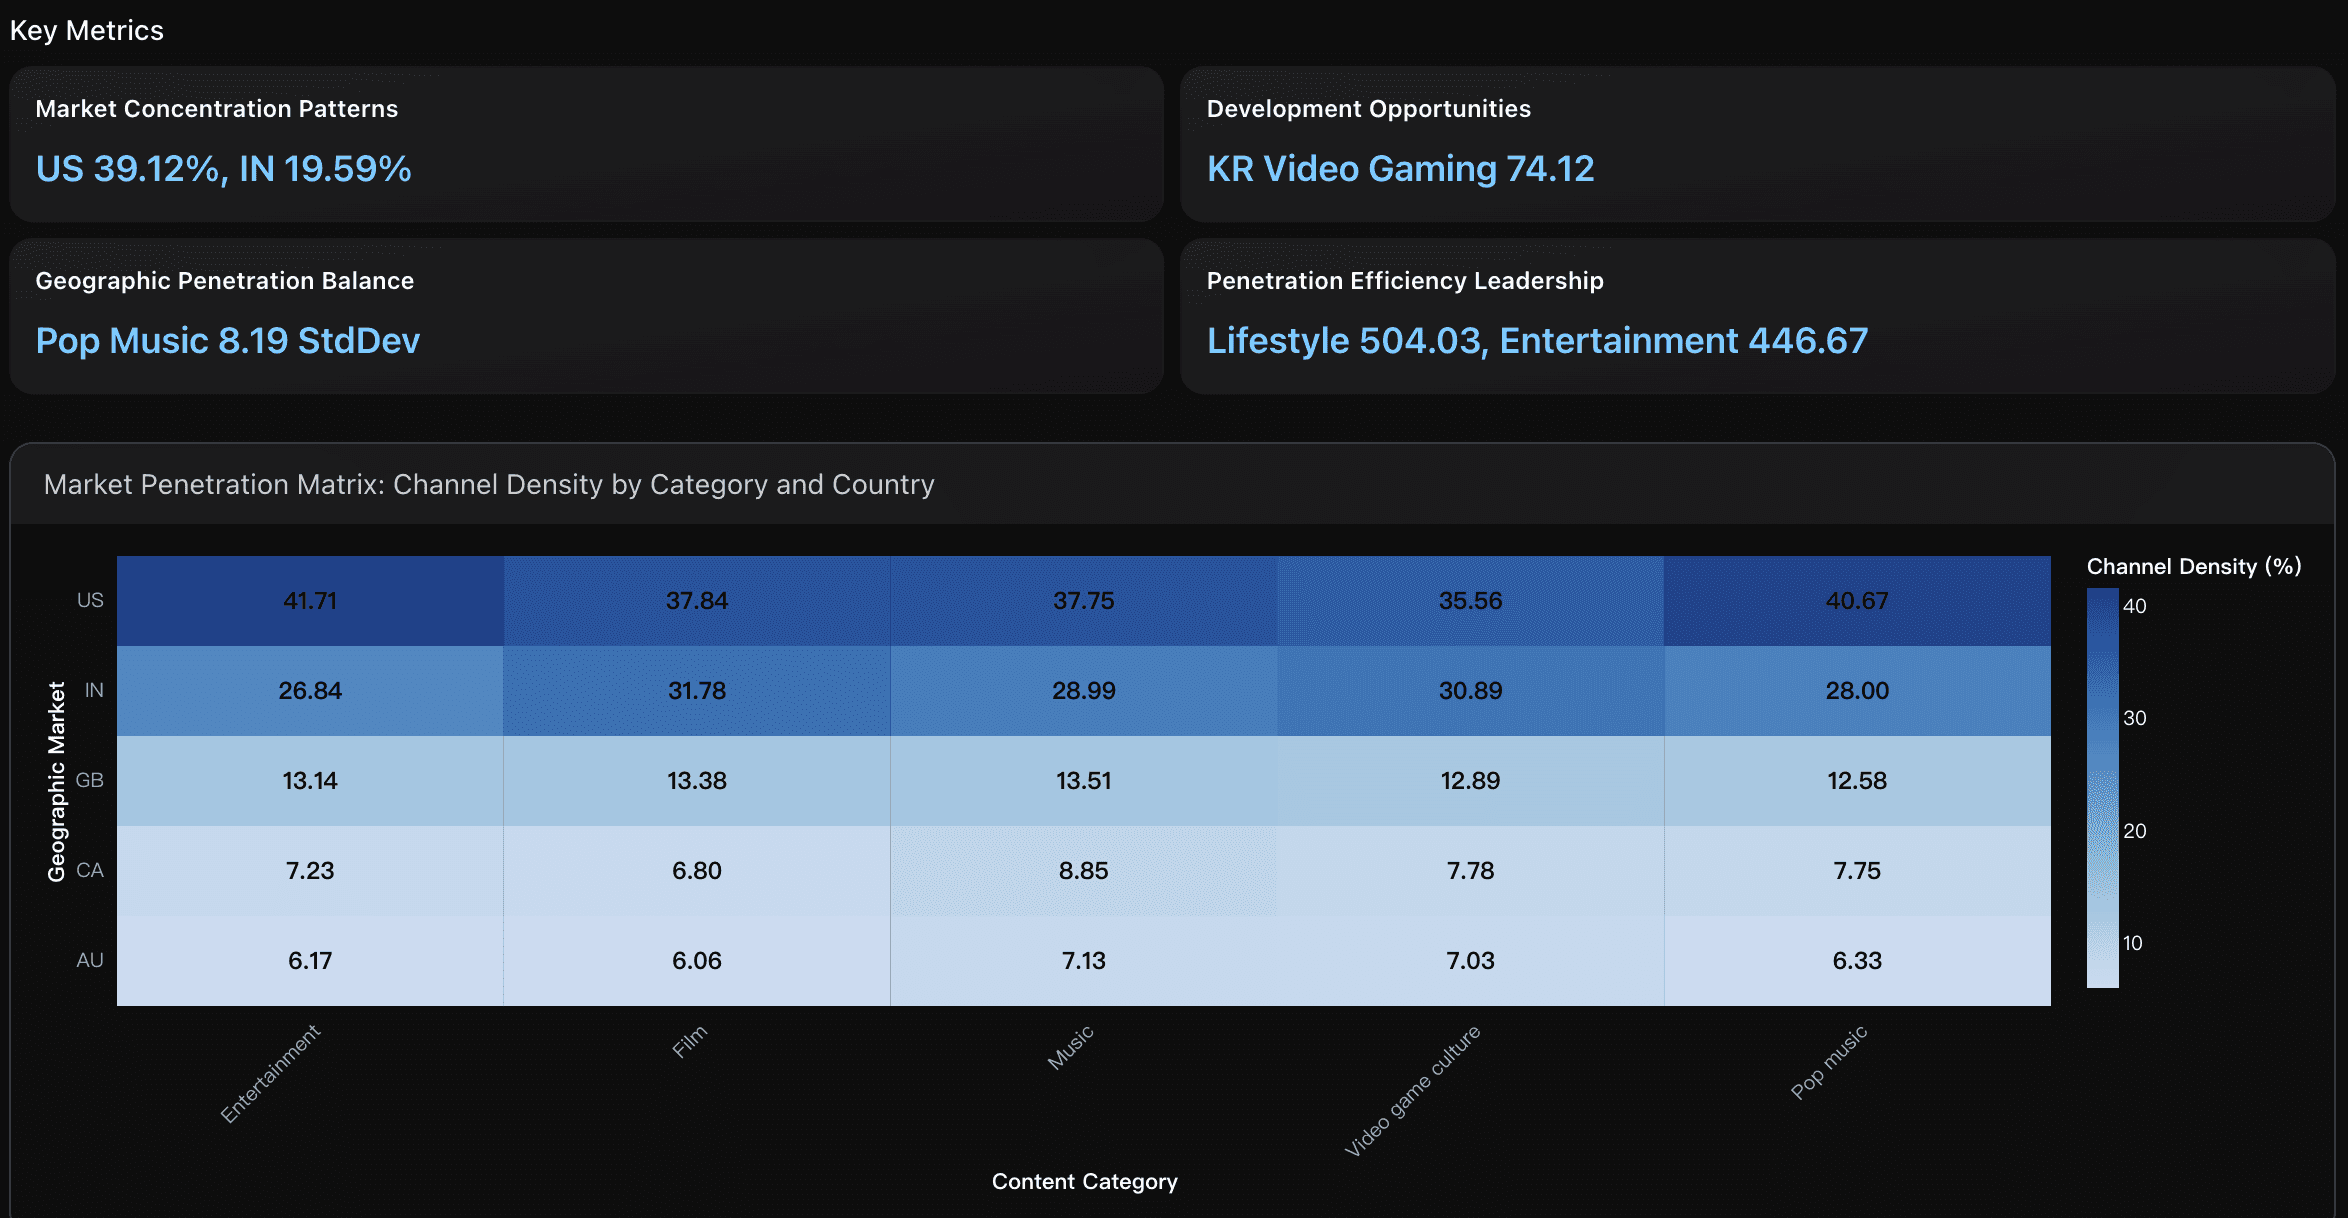
Market Concentration Patterns
US and India dominate channel penetration rates across all content categories, with US showing highest market density at 39.12% average penetration rate and India at 19.59%. Film category in India demonstrates exceptional market concentration with 31.78% channel density and 8.6M average subscribers per channel, indicating a mature, high-value market with significant creator monetization potential.
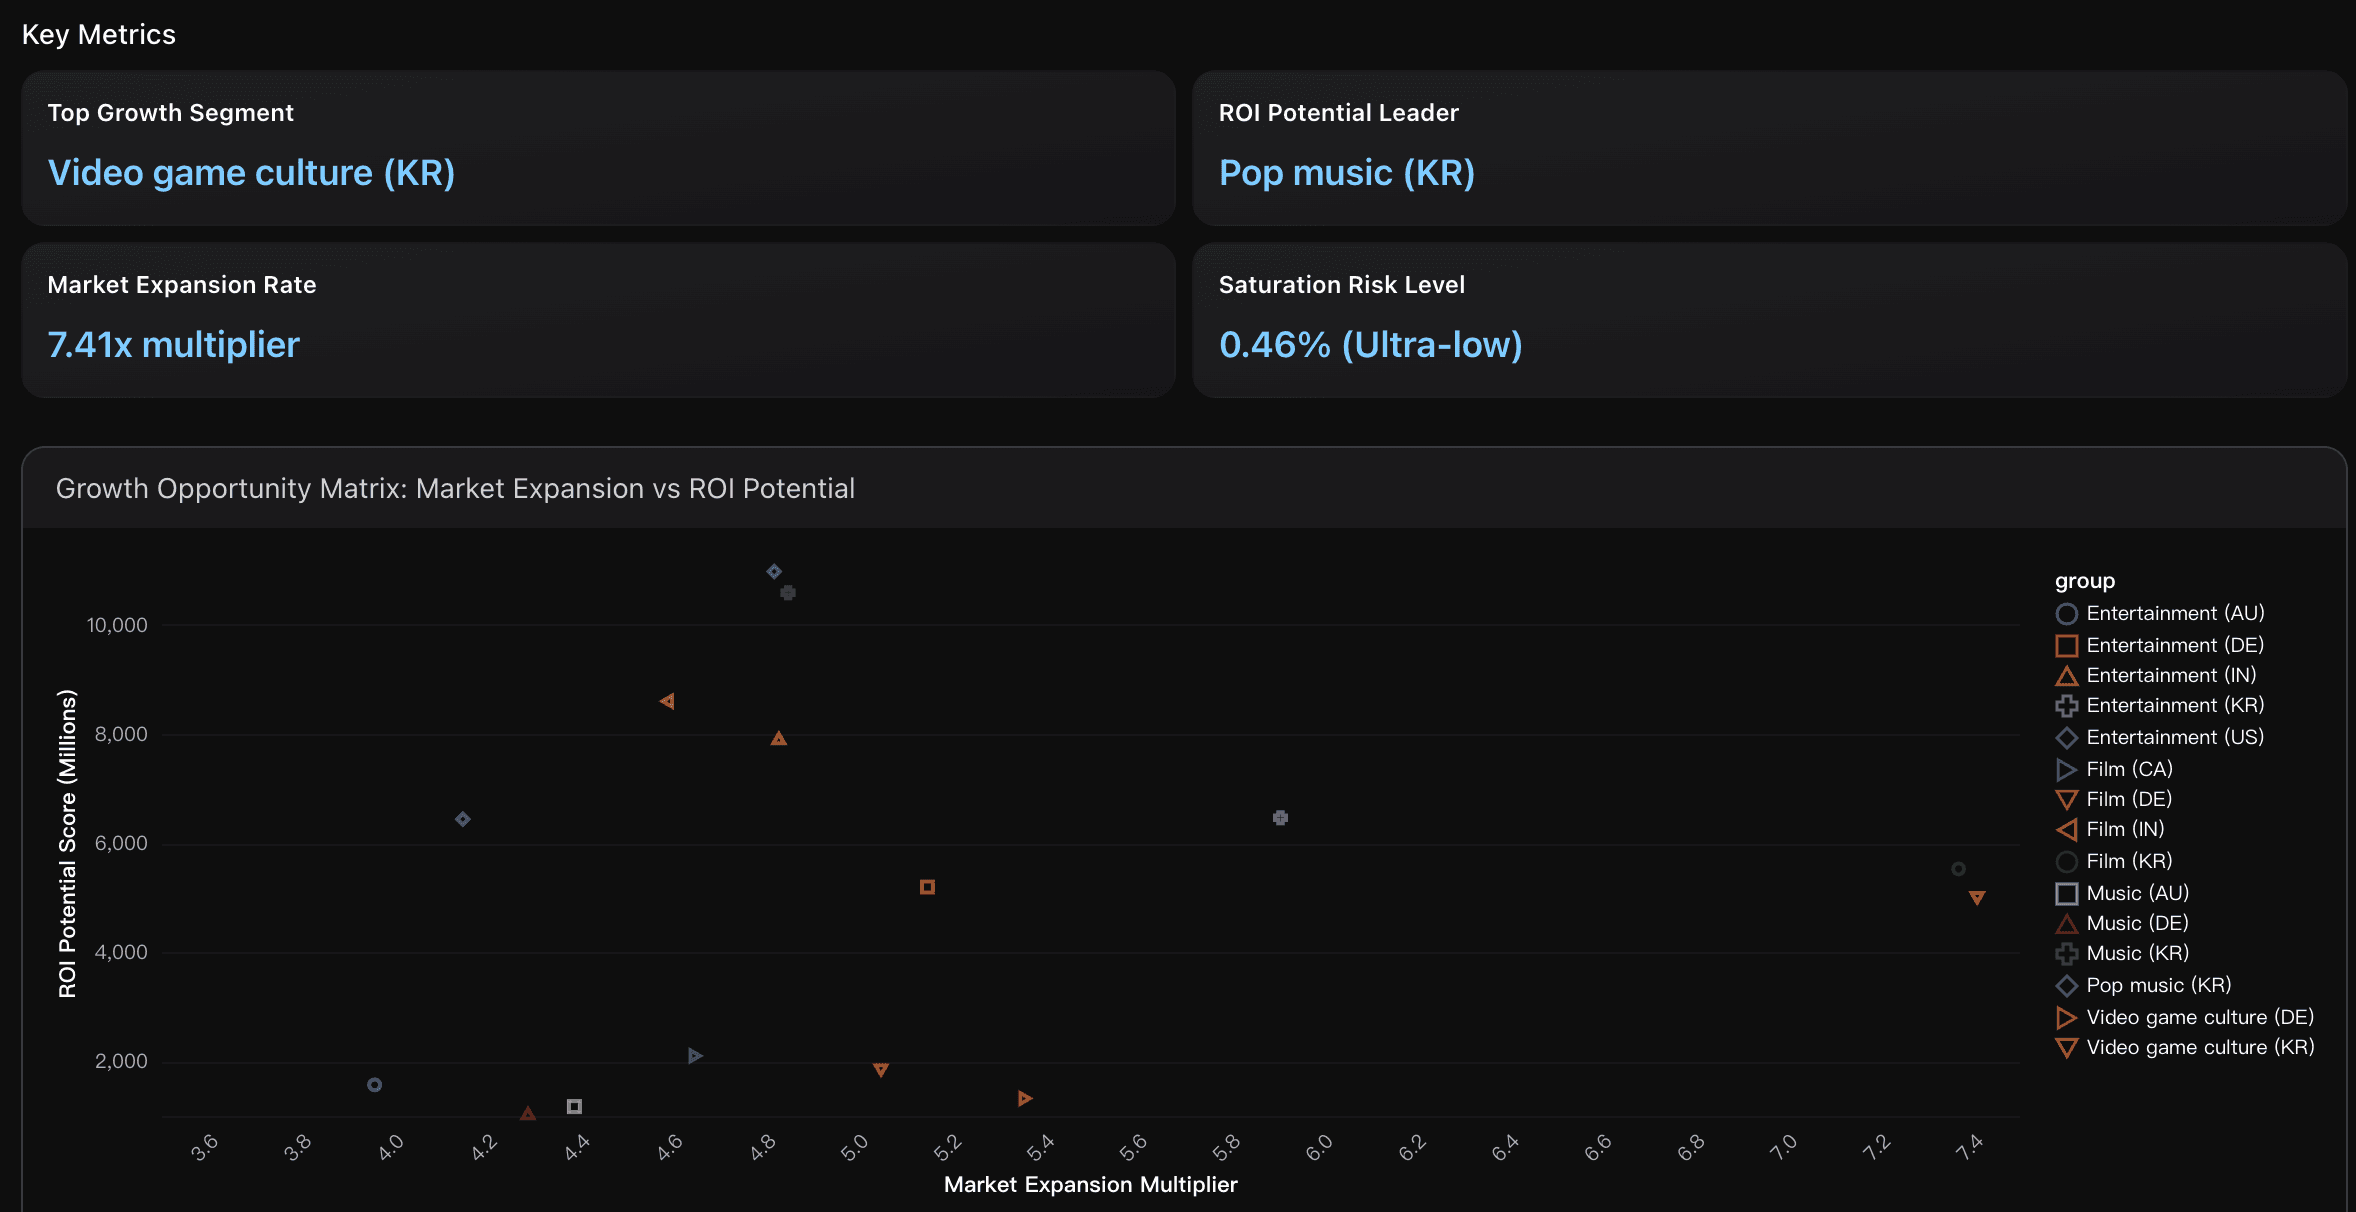
Top Growth Segment
Video game culture in Korea emerges as the premier growth opportunity with a 744.67 engagement rate and 99.54% channel growth headroom. This segment shows only 8 existing channels serving 40 million subscribers, indicating massive undersupply. Korean gaming market's global leadership position and the segment's 7.41 market expansion multiplier make it ideal for aggressive investment before competitors saturate this lucrative space.
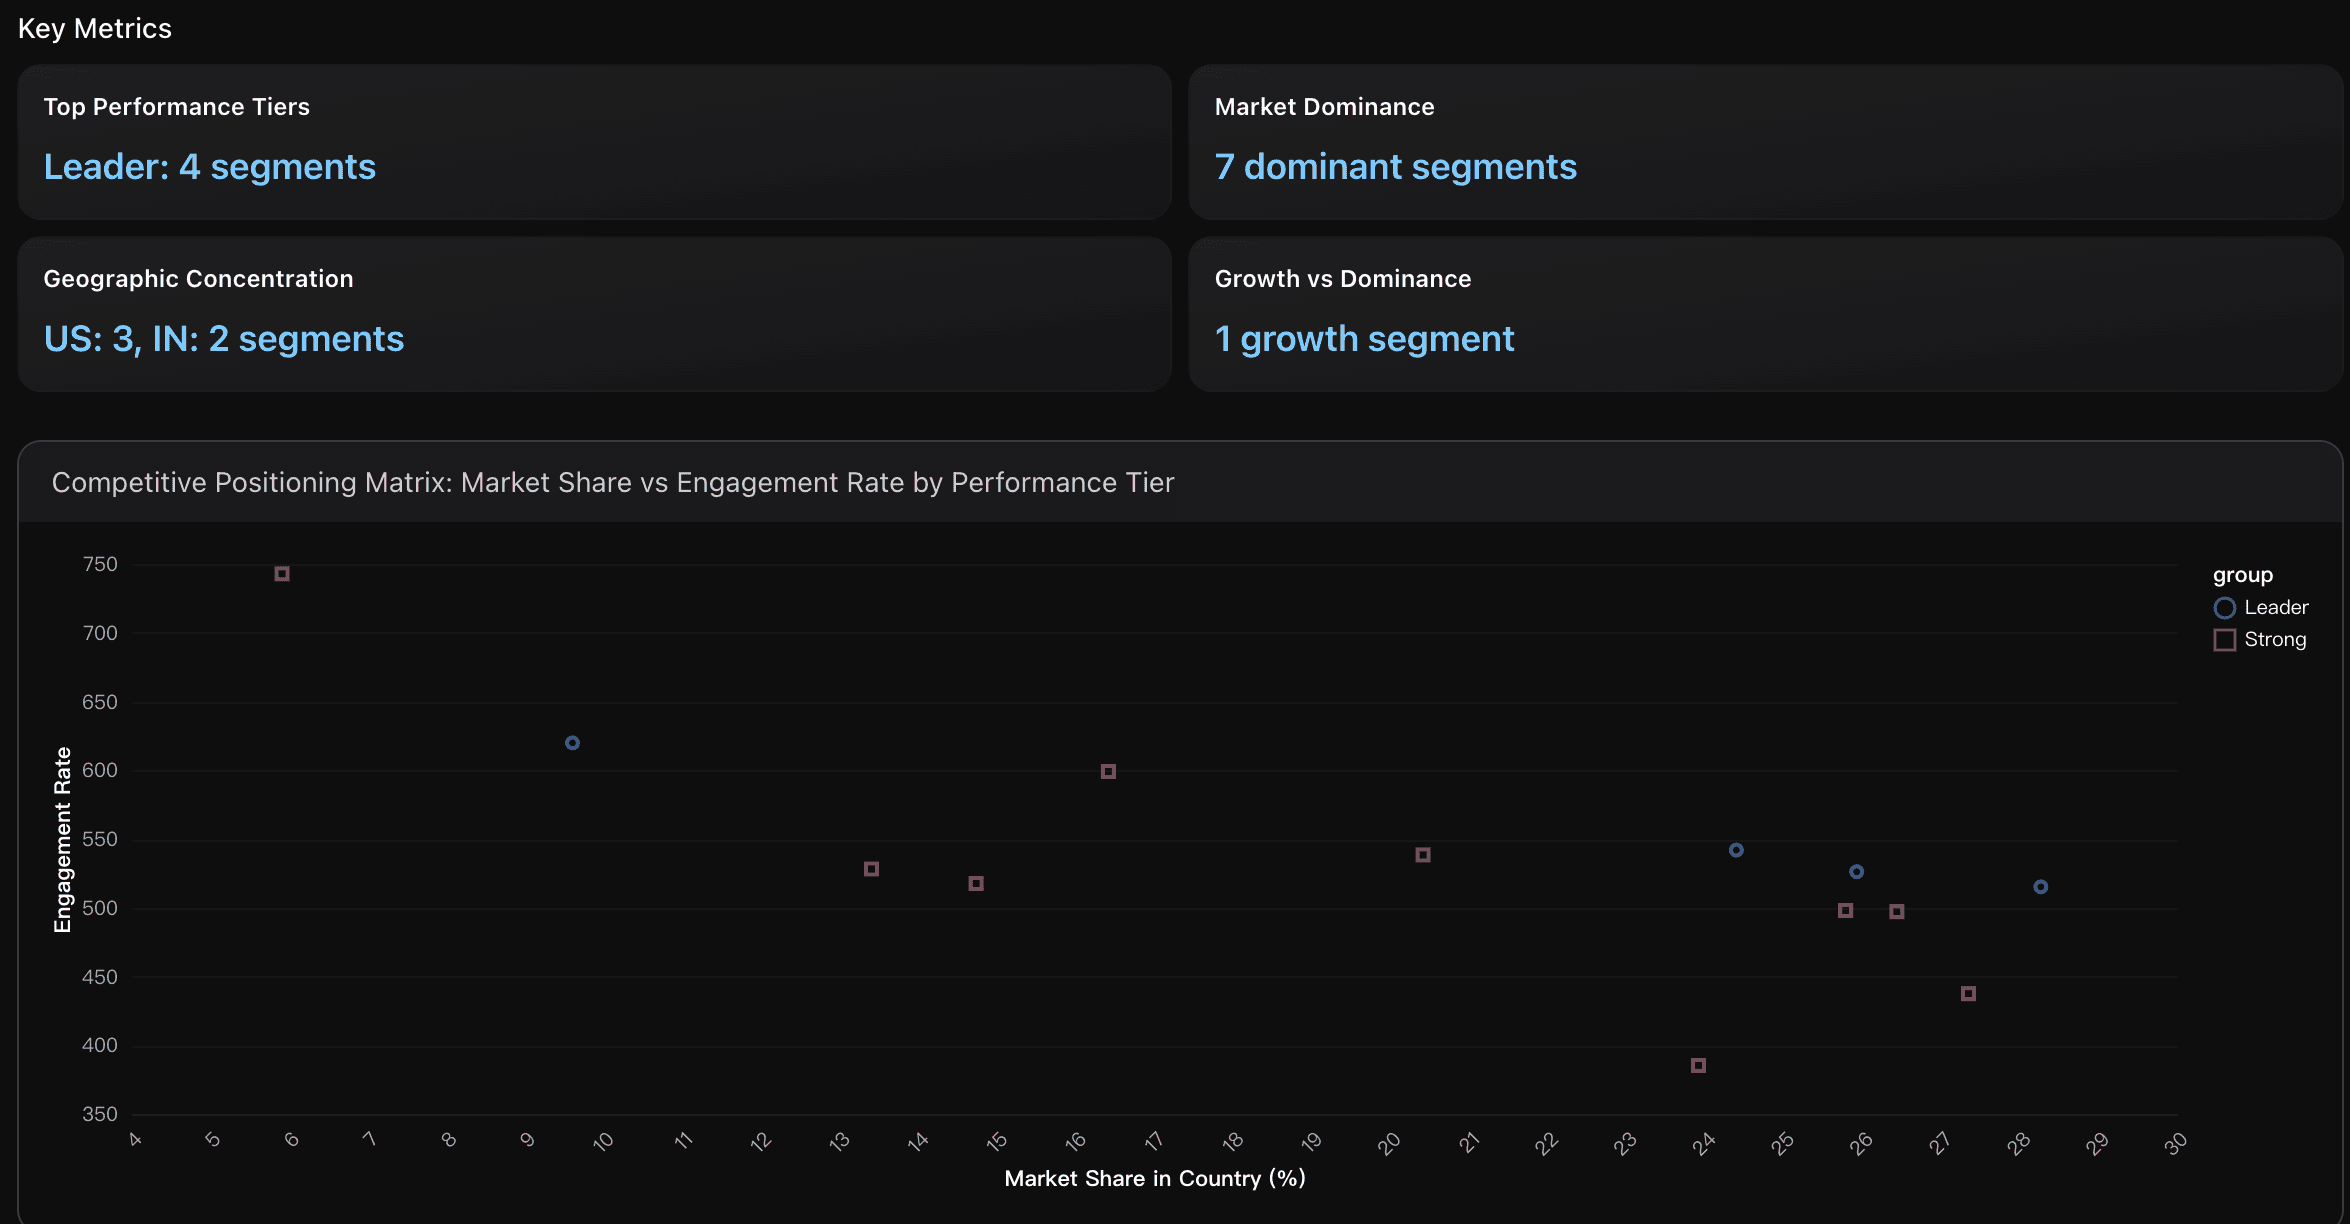
Top Performance Tiers
Analysis identifies 4 Leader-tier segments (Entertainment-US, Entertainment-IN, Film-IN, Music-US) and 9 Strong-tier segments across top 10 competitive positions. Leaders exhibit competitive advantage scores of 0.54-0.74, combining high engagement rates (515-619), strong subscriber bases (6.5M-7.9M avg per channel), and significant market shares (9.6%-28.3%). This tier distribution indicates concentrated excellence among select category-country combinations with optimal resource allocation potential.
Actionable Insights
Focus strategic expansion on South Korea's Video Game Culture segment with its exceptional 74.12 development potential score and ultralow 0.46% penetration rate, where each channel averages 5M subscribers compared to global benchmarks. Simultaneously, leverage Pop Music's balanced geographic penetration (lowest 8.19 standard deviation) for risk-minimized multinational expansion across all major markets. For immediate ROI optimization, prioritize Lifestyle and Entertainment categories with their superior 504.03 and 446.67 penetration efficiency scores, indicating highest audience capture per channel deployed and optimal resource utilization for platform investments.
Prioritize immediate investment in Korean Video game culture segment with its exceptional 744.67 engagement rate and 99.54% growth headroom . This represents a rare market window where only 8 channels serve 40 million subscribers , creating massive undersupply. Launch 3-5 gaming channels focusing on Korean gaming trends, esports content, and mobile gaming reviews. Simultaneously, establish a Korean Pop music channel to capture the 10.97 billion ROI potential driven by K-pop's global reach. The 7.41x market expansion multiplier indicates that early entrants can achieve exponential growth before competitors recognize this opportunity. Target localized content with global appeal, leveraging Korea's cultural export strength while the 0.46% saturation risk remains minimal.
Implement a tier-based resource allocation strategy focusing on the identified competitive positioning hierarchy. Prioritize Leader-tier segments (Entertainment-US with 24.4% market share, Entertainment-IN with 28.3% share, Film-IN with 25.9% share) for premium content investment and market consolidation to defend dominant positions. Allocate expansion resources to the singular growth opportunity Film-KR with exceptional 742.86 engagement rate but only 5.92% market share, representing untapped potential for rapid scaling. Establish geographic hubs in US markets (3 elite segments) and Indian markets (2 elite segments) to leverage cross-category synergies and operational efficiencies, while monitoring Strong-tier segments for promotion opportunities based on performance trajectory improvements.
Analysis Overview
The segment matrix analysis reveals significant market opportunities across category x country combinations. Entertainment dominates with 24.60% subscriber share, followed by Lifestyle at 22.40% and Film at 17.74%. The highest growth potential exists in South Korea's Video Game Culture segment with 744.67 engagement rate and only 0.005 channel density, indicating massive headroom. Similarly, Film in South Korea shows 742.86 engagement with minimal saturation. Music and Pop music categories demonstrate the strongest geographic diversification (2.16 and 2.03 entropy indices), making them ideal for global expansion strategies. The US market leads in Entertainment with 1,574 channels, while India dominates with 8.6 billion total subscribers across categories. Key competitive advantages emerge in India's Film segment with 25.93% market share and 8.6 million average subscribers per channel. Germany and South Korea present premium opportunities due to their high CPM rates ($5.54-$10.26) combined with lower channel densities. The analysis identifies Pop music, Video game culture, and Music as the most internationally scalable categories, while Society represents an emerging opportunity with lower saturation levels across all markets.
Data Analysis
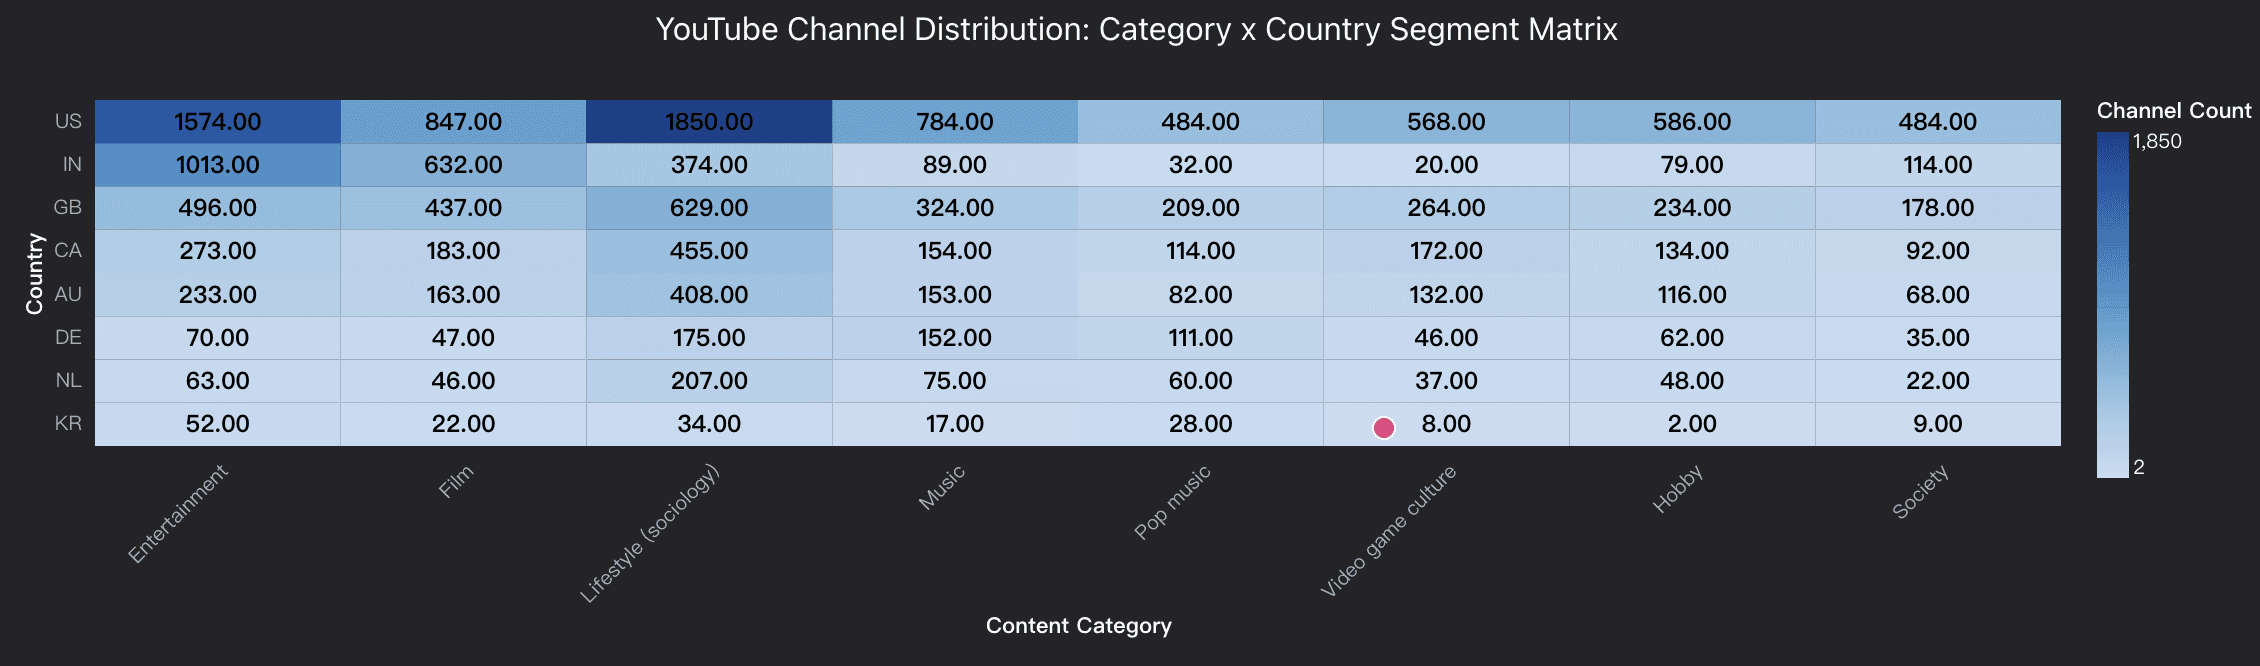
Market Penetration Matrix
Analysis of category × country segment distribution showing channel density and audience reach across the top 8 categories and 8 countries, revealing market concentration patterns and geographic diversification opportunities.
Growth Opportunity Identification
Evaluation of underserved segments with high engagement creation and audience capture growth markets with significant headroom for new channel.
Competitive Positioning Analvsis
Assessment of category-country combinations displaying superior performance metrics including engagement rates, subscriber scale, and market share advantages for strategic resource allocation.
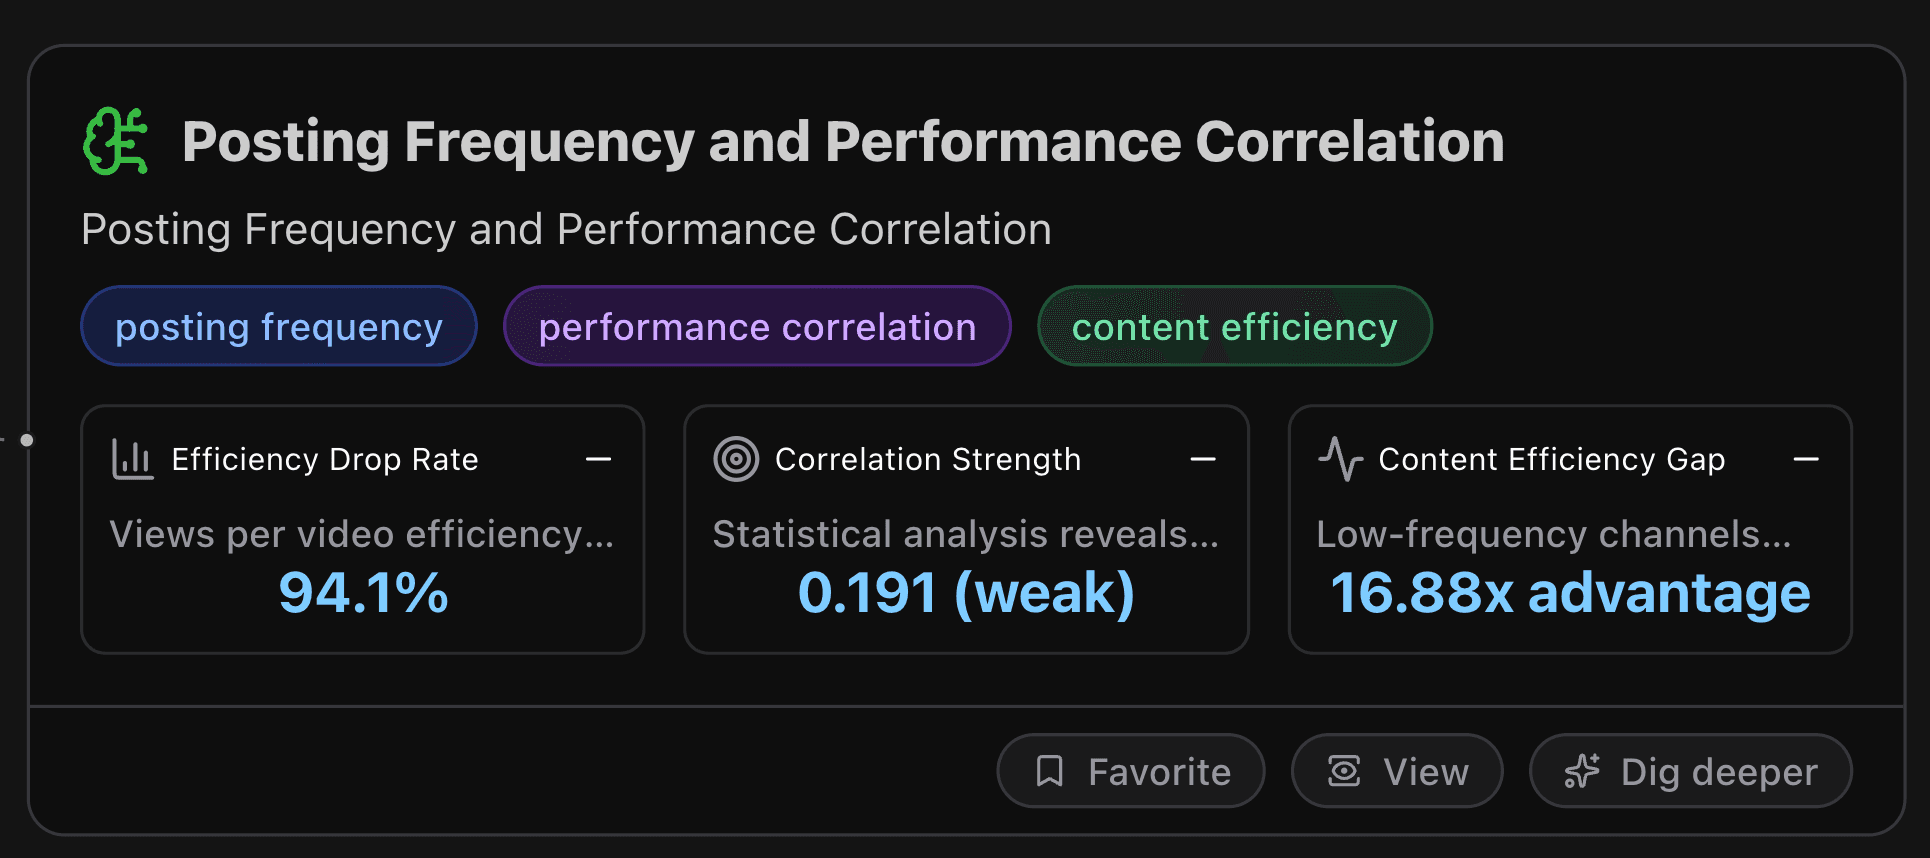
Posting Frequency and Performance Correlation
This section analyzes posting frequency and performance correlation.
Actionable Insights
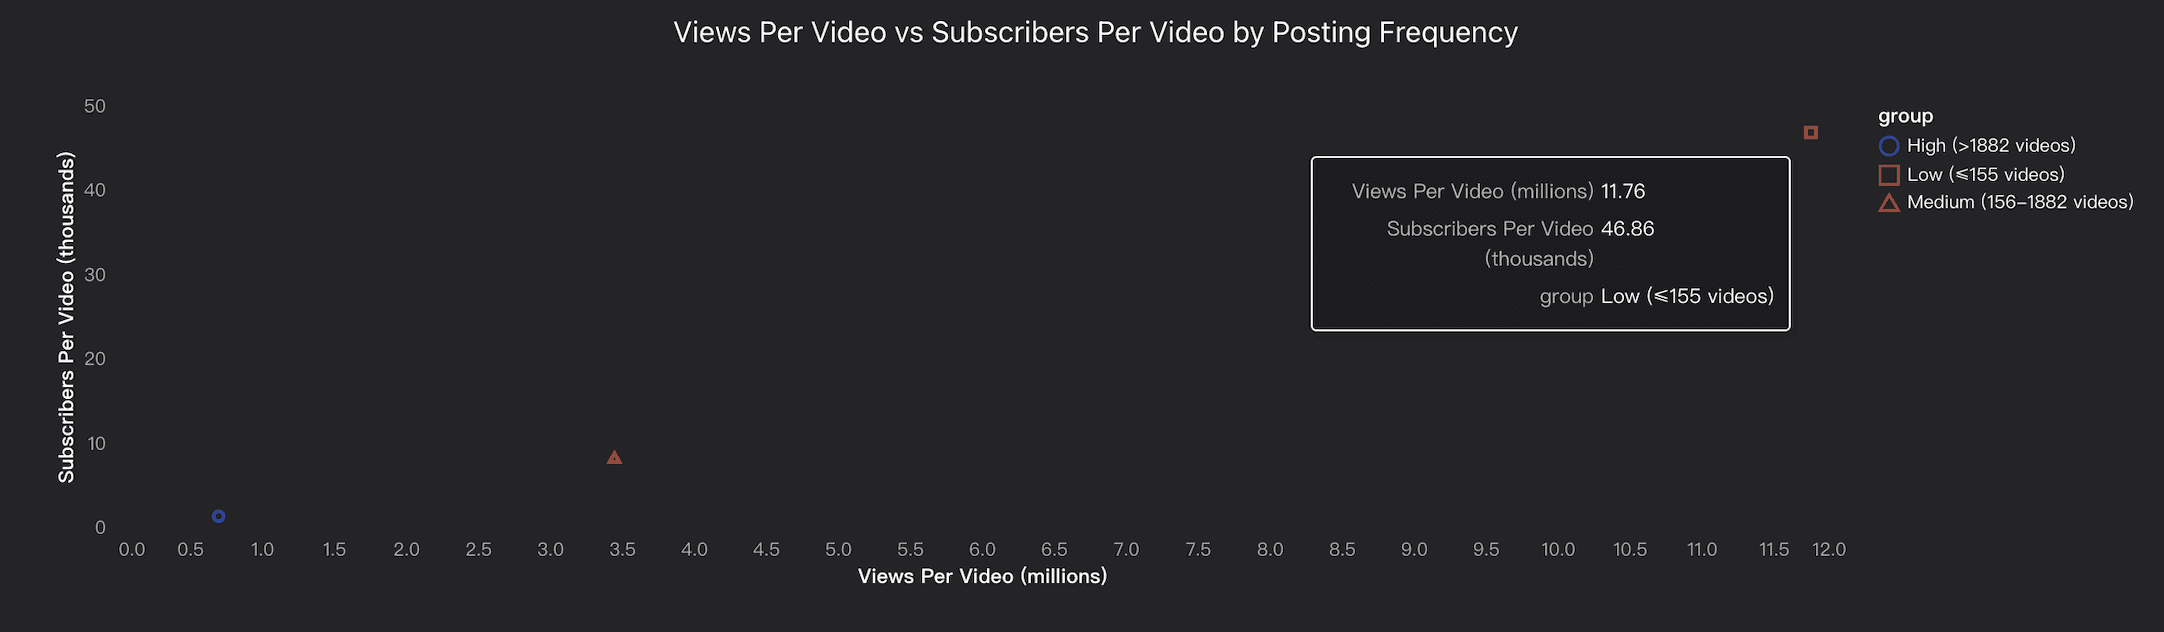
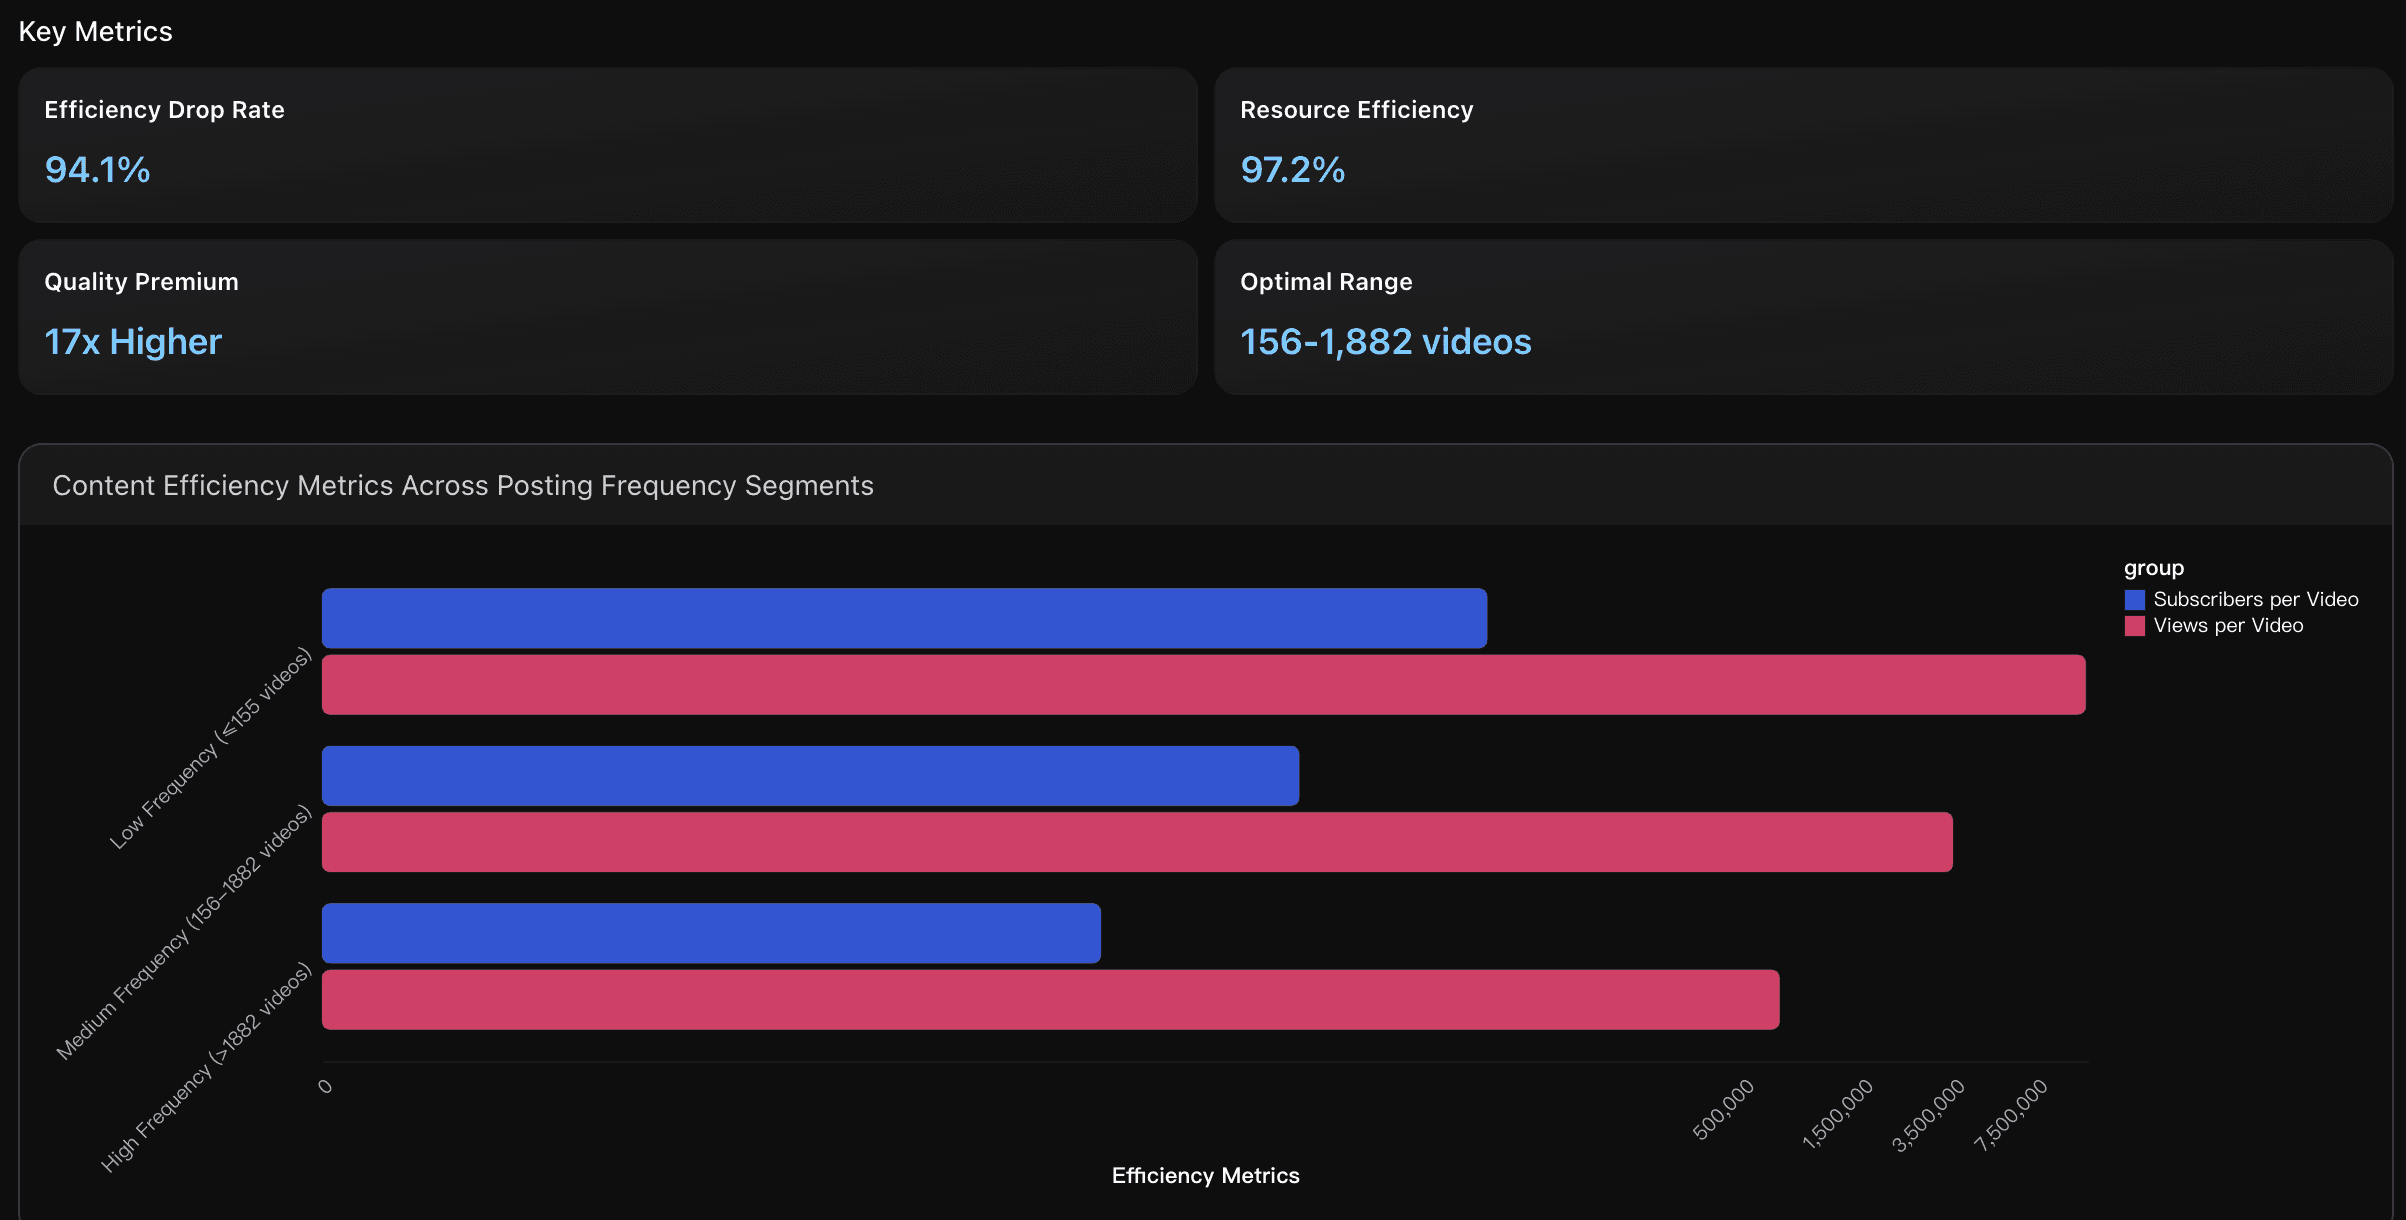
Implement a strategic content efficiency approach by adopting a 2-3 videos per week posting schedule to maximize performance per content piece. Focus resources on creating fewer, higher-quality videos rather than daily uploads, as data shows 94.1% efficiency drop in views per video from low to high-frequency posting. Prioritize content development time and production value over quantity, targeting the medium-frequency sweet spot of 156-1,882 total videos to achieve optimal balance between audience growth ( 3.45M views per video ) and sustainable content creation workflows.
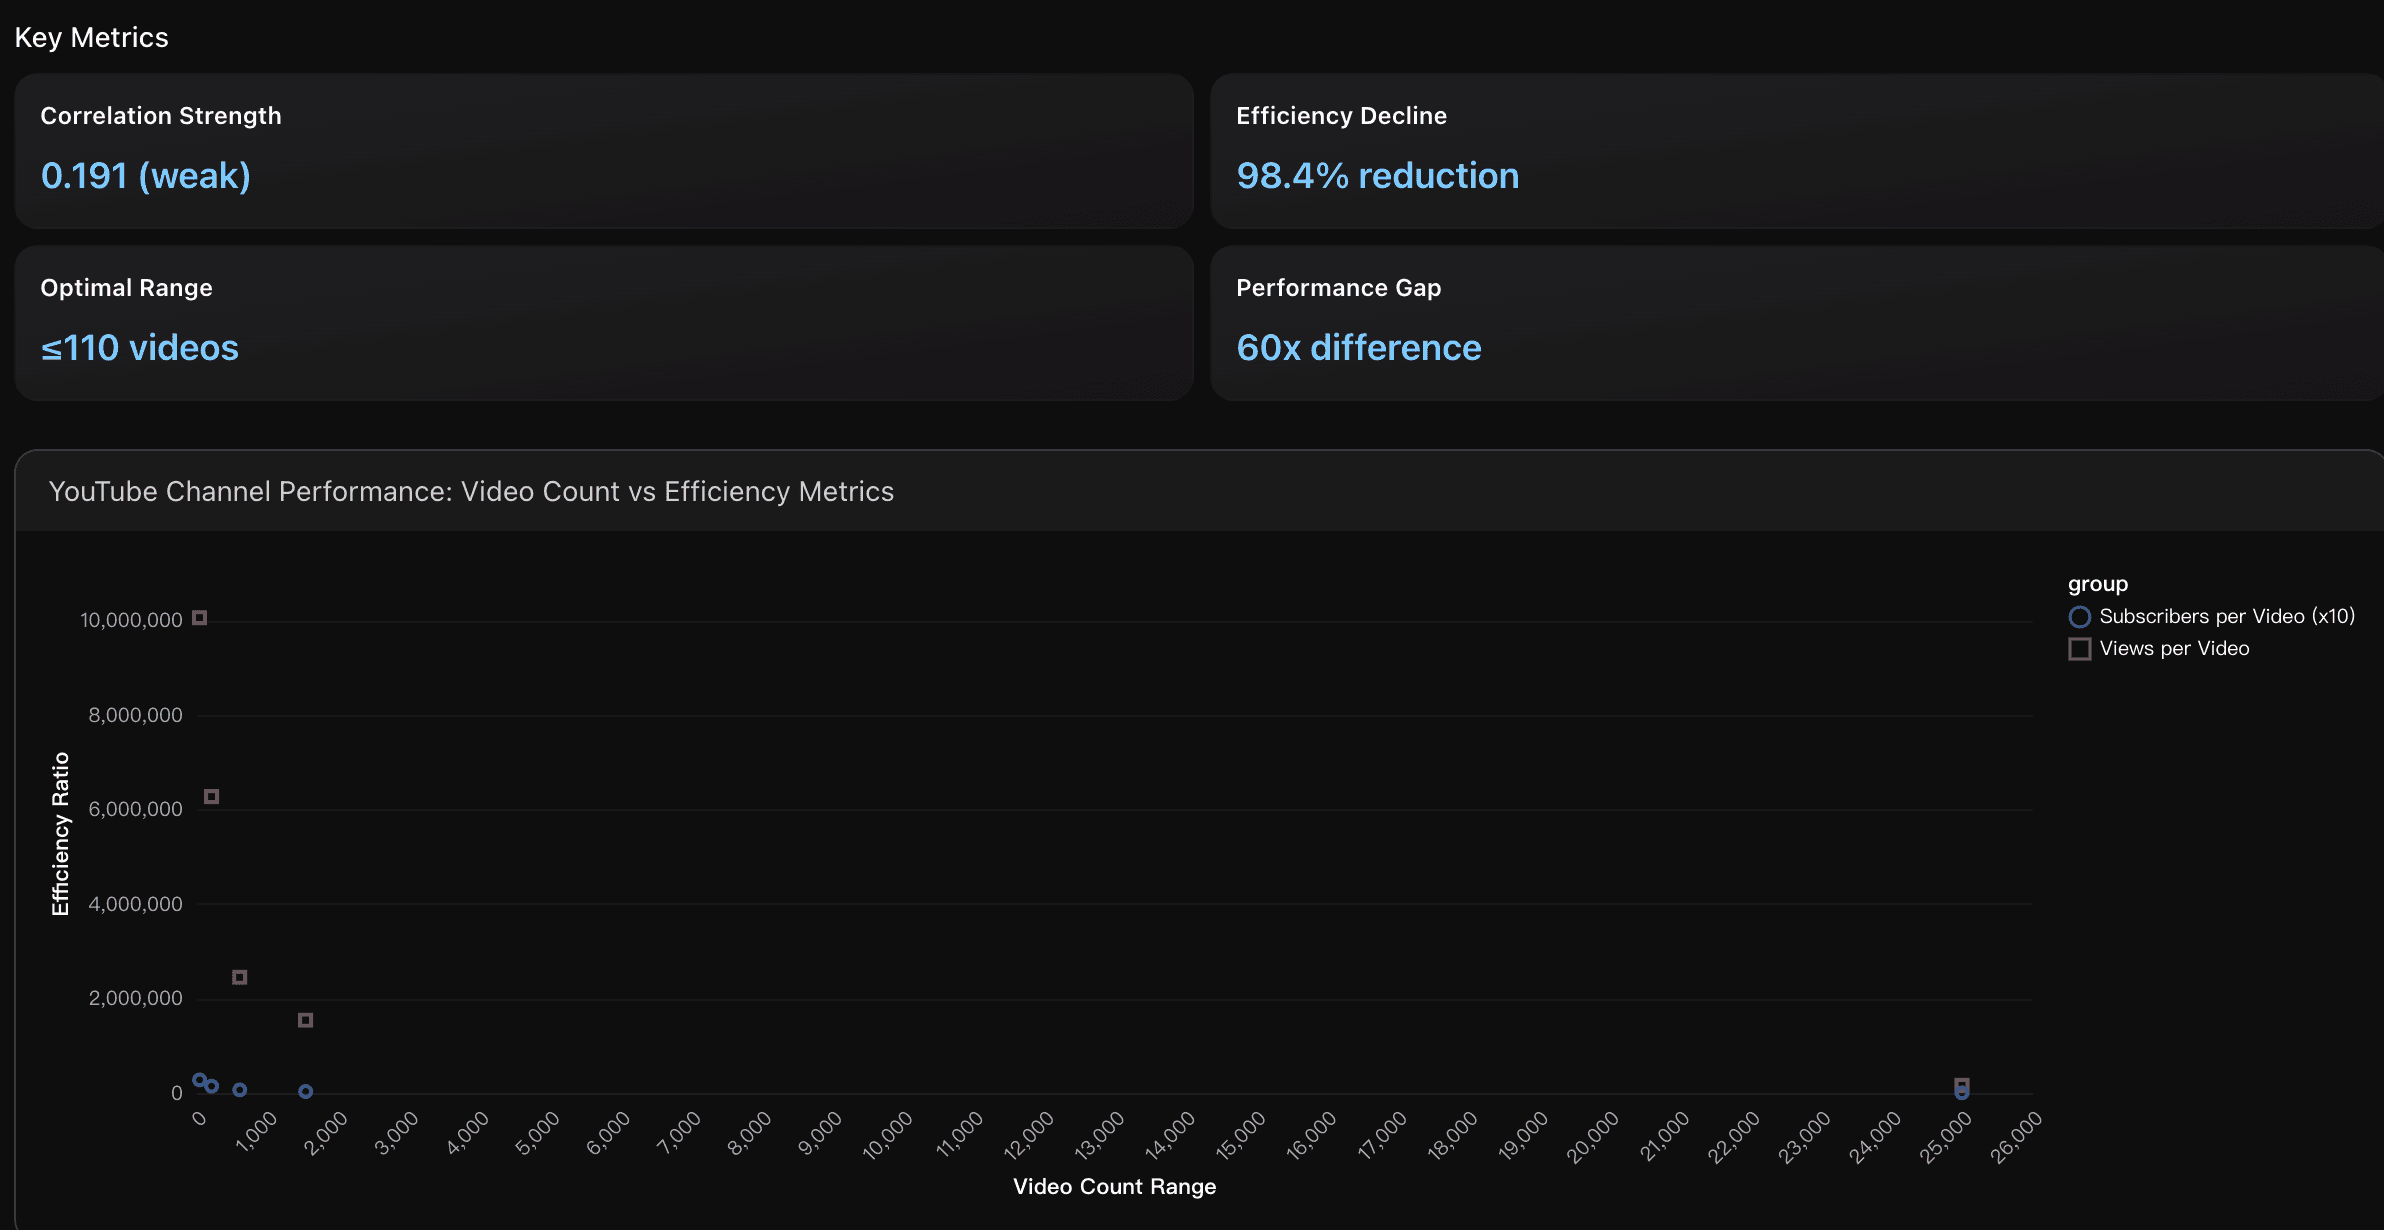
Optimize posting frequency by targeting the ≤110 video sweet spot to maximize content efficiency. Analysis reveals channels in this range achieve 10.1M views per video compared to 163K for high-frequency channels, representing a dramatic 98.4% efficiency decline beyond optimal frequency. Focus on content quality over quantity by posting 2-3 times weekly rather than daily, as industry data shows this approach delivers 6.8% growth with 53% audience retention versus daily posting's lower 4.9% growth and 41% retention. Monitor your channel's efficiency metrics monthly and reduce posting frequency if views per video drop significantly, as the data demonstrates diminishing returns become severe above 110 total videos, making strategic content curation more valuable than volume-based approaches.
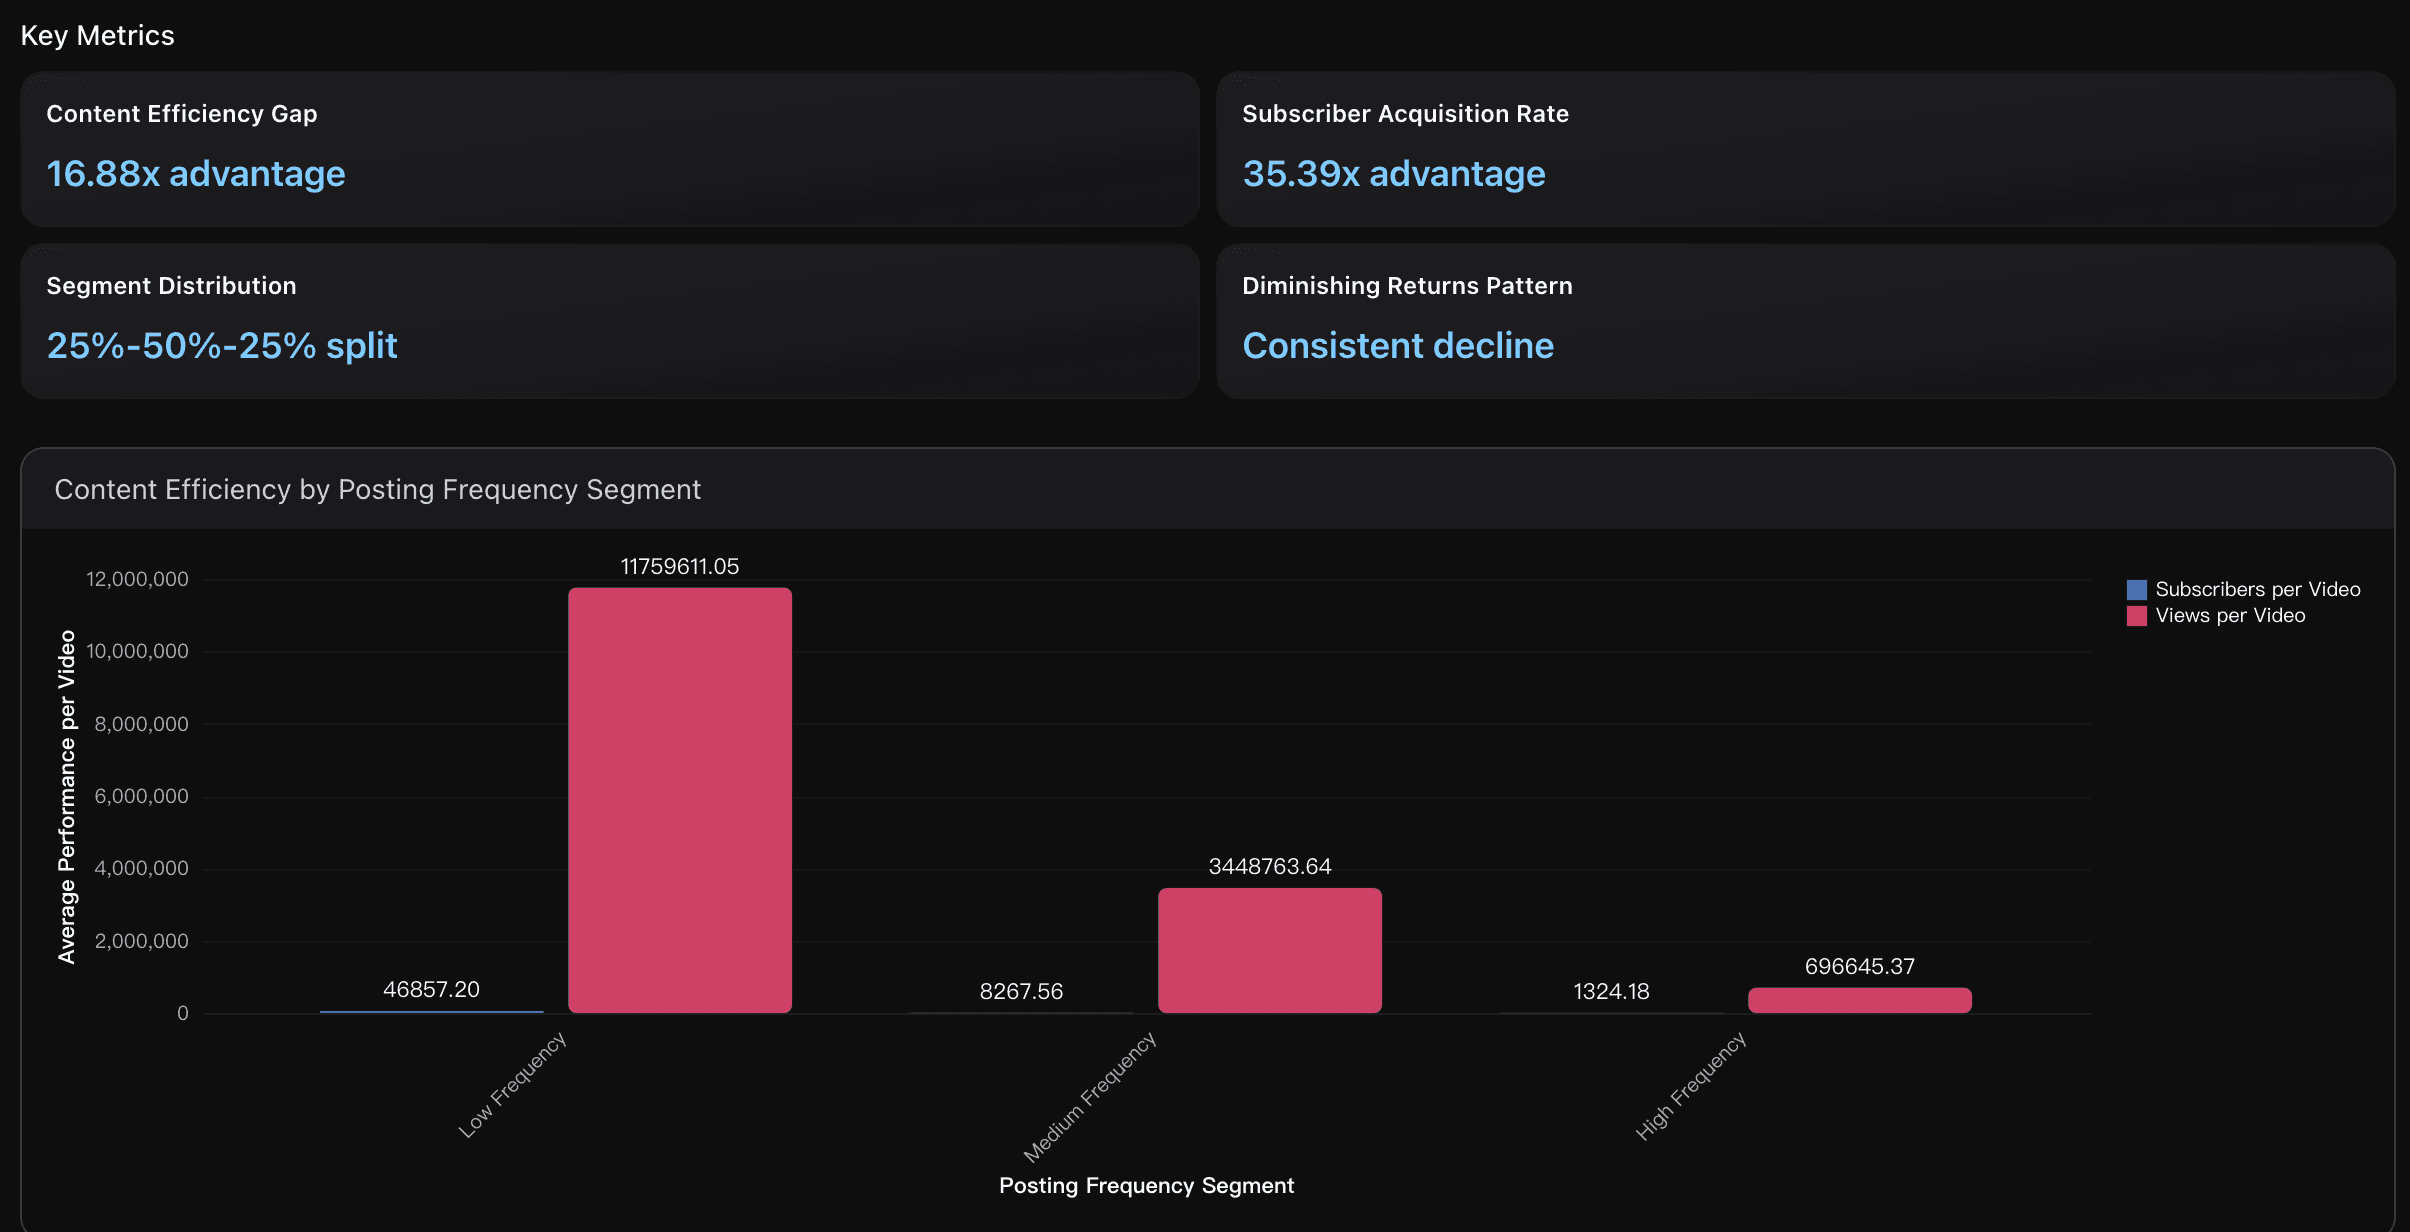
Based on the dramatic efficiency advantages demonstrated by low-frequency channels, content creators should prioritize quality over quantity in their posting strategy. Focus on developing one high-impact video per week rather than multiple lower-quality uploads, as this approach can yield up to 16.88x more views and 35.39x more subscribers per video. To implement this strategy, allocate more time for content planning, production value, and audience research for each upload. Consider batching content creation to maintain consistency while ensuring each video meets higher quality standards. This approach not only maximizes per-video performance but also reduces the 71% creator burnout rate associated with high-frequency posting, leading to more sustainable long-term growth and stronger audience relationships.
Analysis Overview
The analysis reveals a clear inverse relationship between posting frequency and performance efficiency. Low-frequency channels (≤155 videos) achieve the highest performance per video with 11.76 million views per video and 46,857 subscribers per video, demonstrating superior content efficiency. Medium-frequency channels show moderate efficiency at 3.45 million views and 8,268 subscribers per video, while high-frequency channels (>1,882 videos) sacrifice efficiency for volume with only 696,645 views and 1,324 subscribers per video. Industry research confirms optimal posting schedules of 2-3 times weekly yield 6.8% growth rate with 8.1/10 engagement score, compared to daily posting's 4.9% growth and 7.2/10 engagement. The correlation coefficients show weak positive relationships (0.14 for subscribers, 0.19 for views) indicating that while posting more videos increases total metrics, the efficiency gains diminish significantly. Quality-focused, strategic posting emerges as more effective than volume-based strategies for sustainable channel growth.
Data Analysis
Efficiency Analysis
Analyzed performance per video metrics across posting frequency segments using views per video and subscribers per video ratios to measure content efficiency and audience engagement impact.
Frequency Correlation
Examined statistical correlations between video count and peak positive relationships but diminishing returns per video.
Segment Performance
Compared three posting frequency segments based on quartile distribution showing performance variations across low (≤155 videos), medium (156-1882 videos), and high (>1882 videos) posting channels.
Branding and Channel Positioning Strategy
This section analyzes the branding and channel positioning strategies of the top YouTube channels.
Key Metrics
Premium Positioning
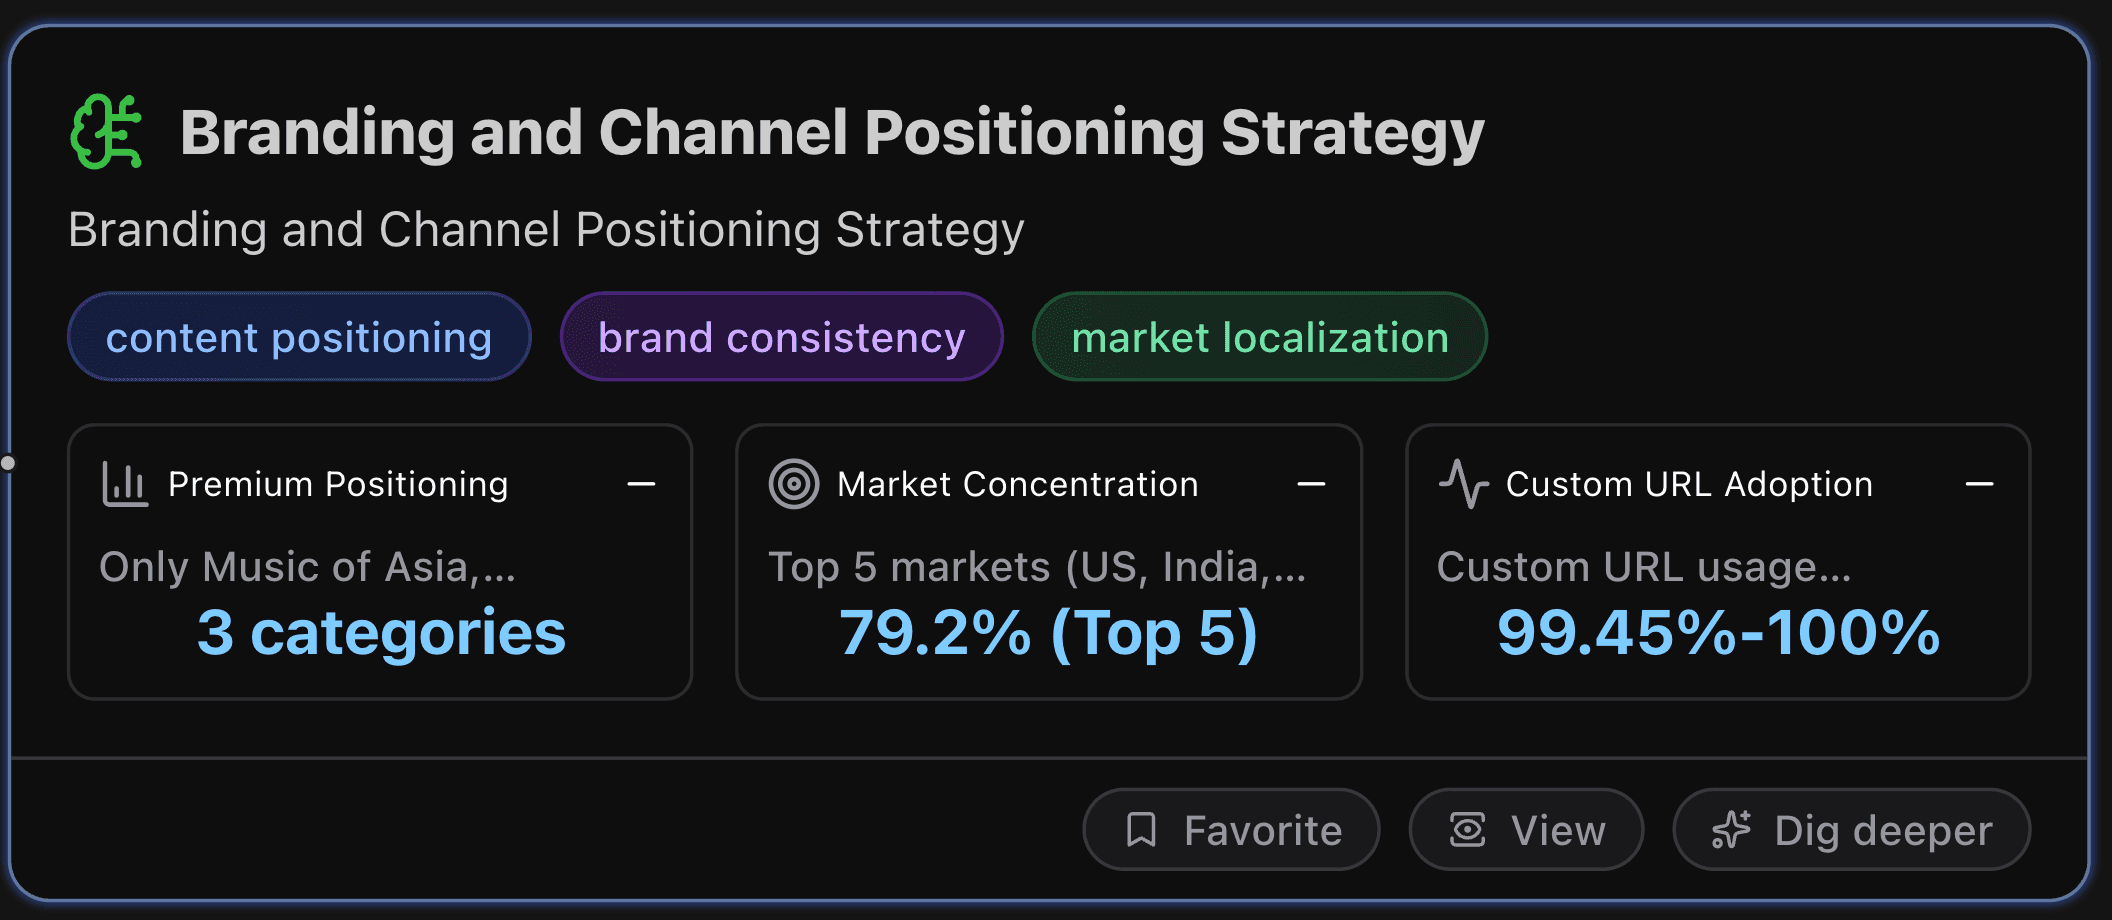
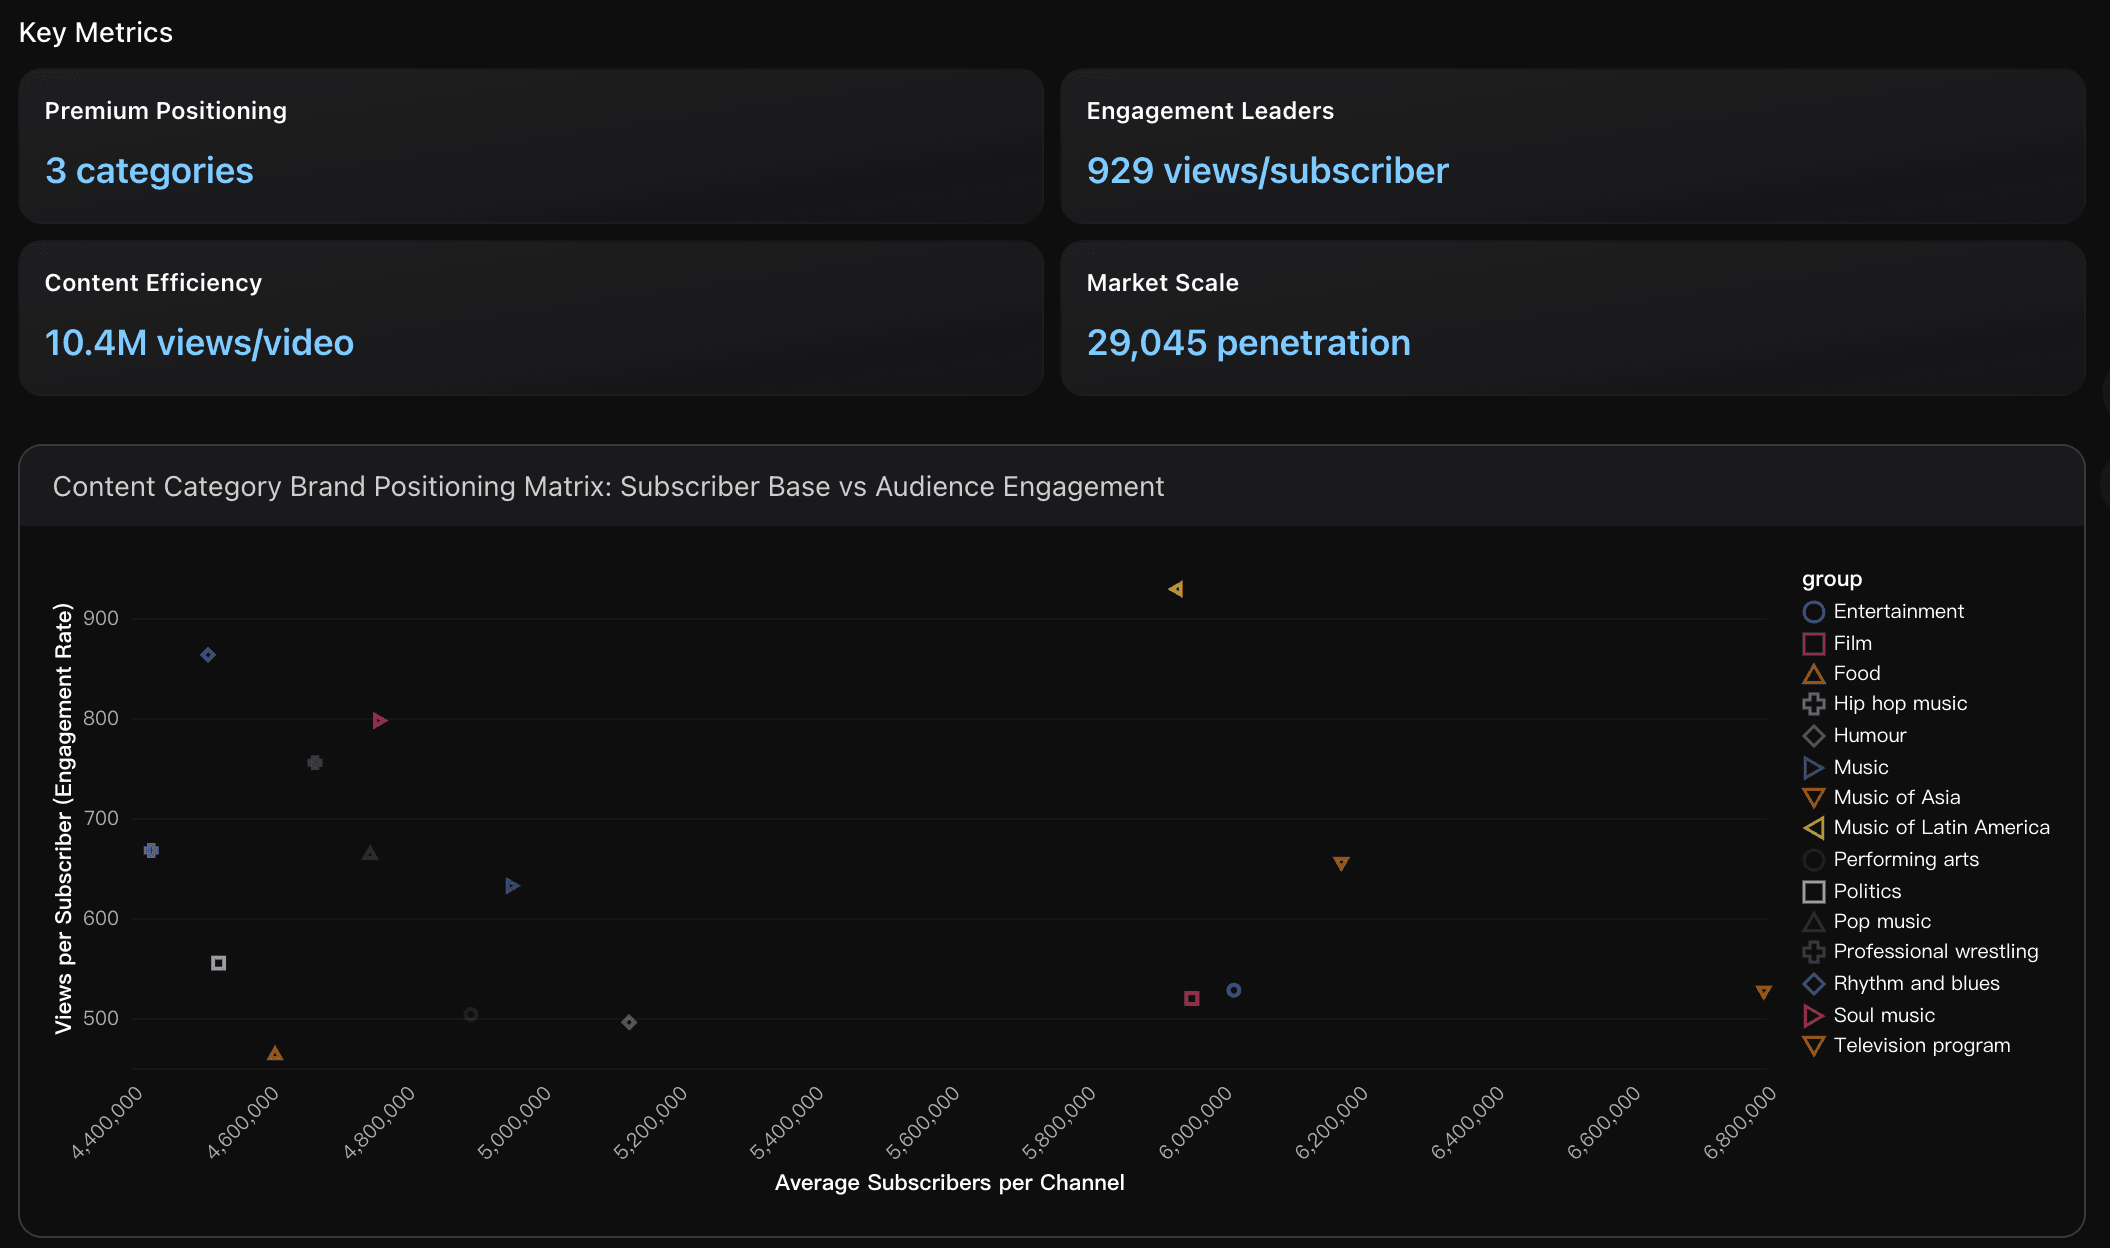
Only Music of Asia, Television Program, and Entertainment achieve premium brand positioning with 6M+ average subscribers and 500+ engagement rates. Music of Asia leads with 6.8M subscribers but moderate 526 views/subscriber, while Television Program shows highest engagement at 655 views/subscriber among premium tier, indicating superior content resonance and audience loyalty in established verticals.
Market Concentration
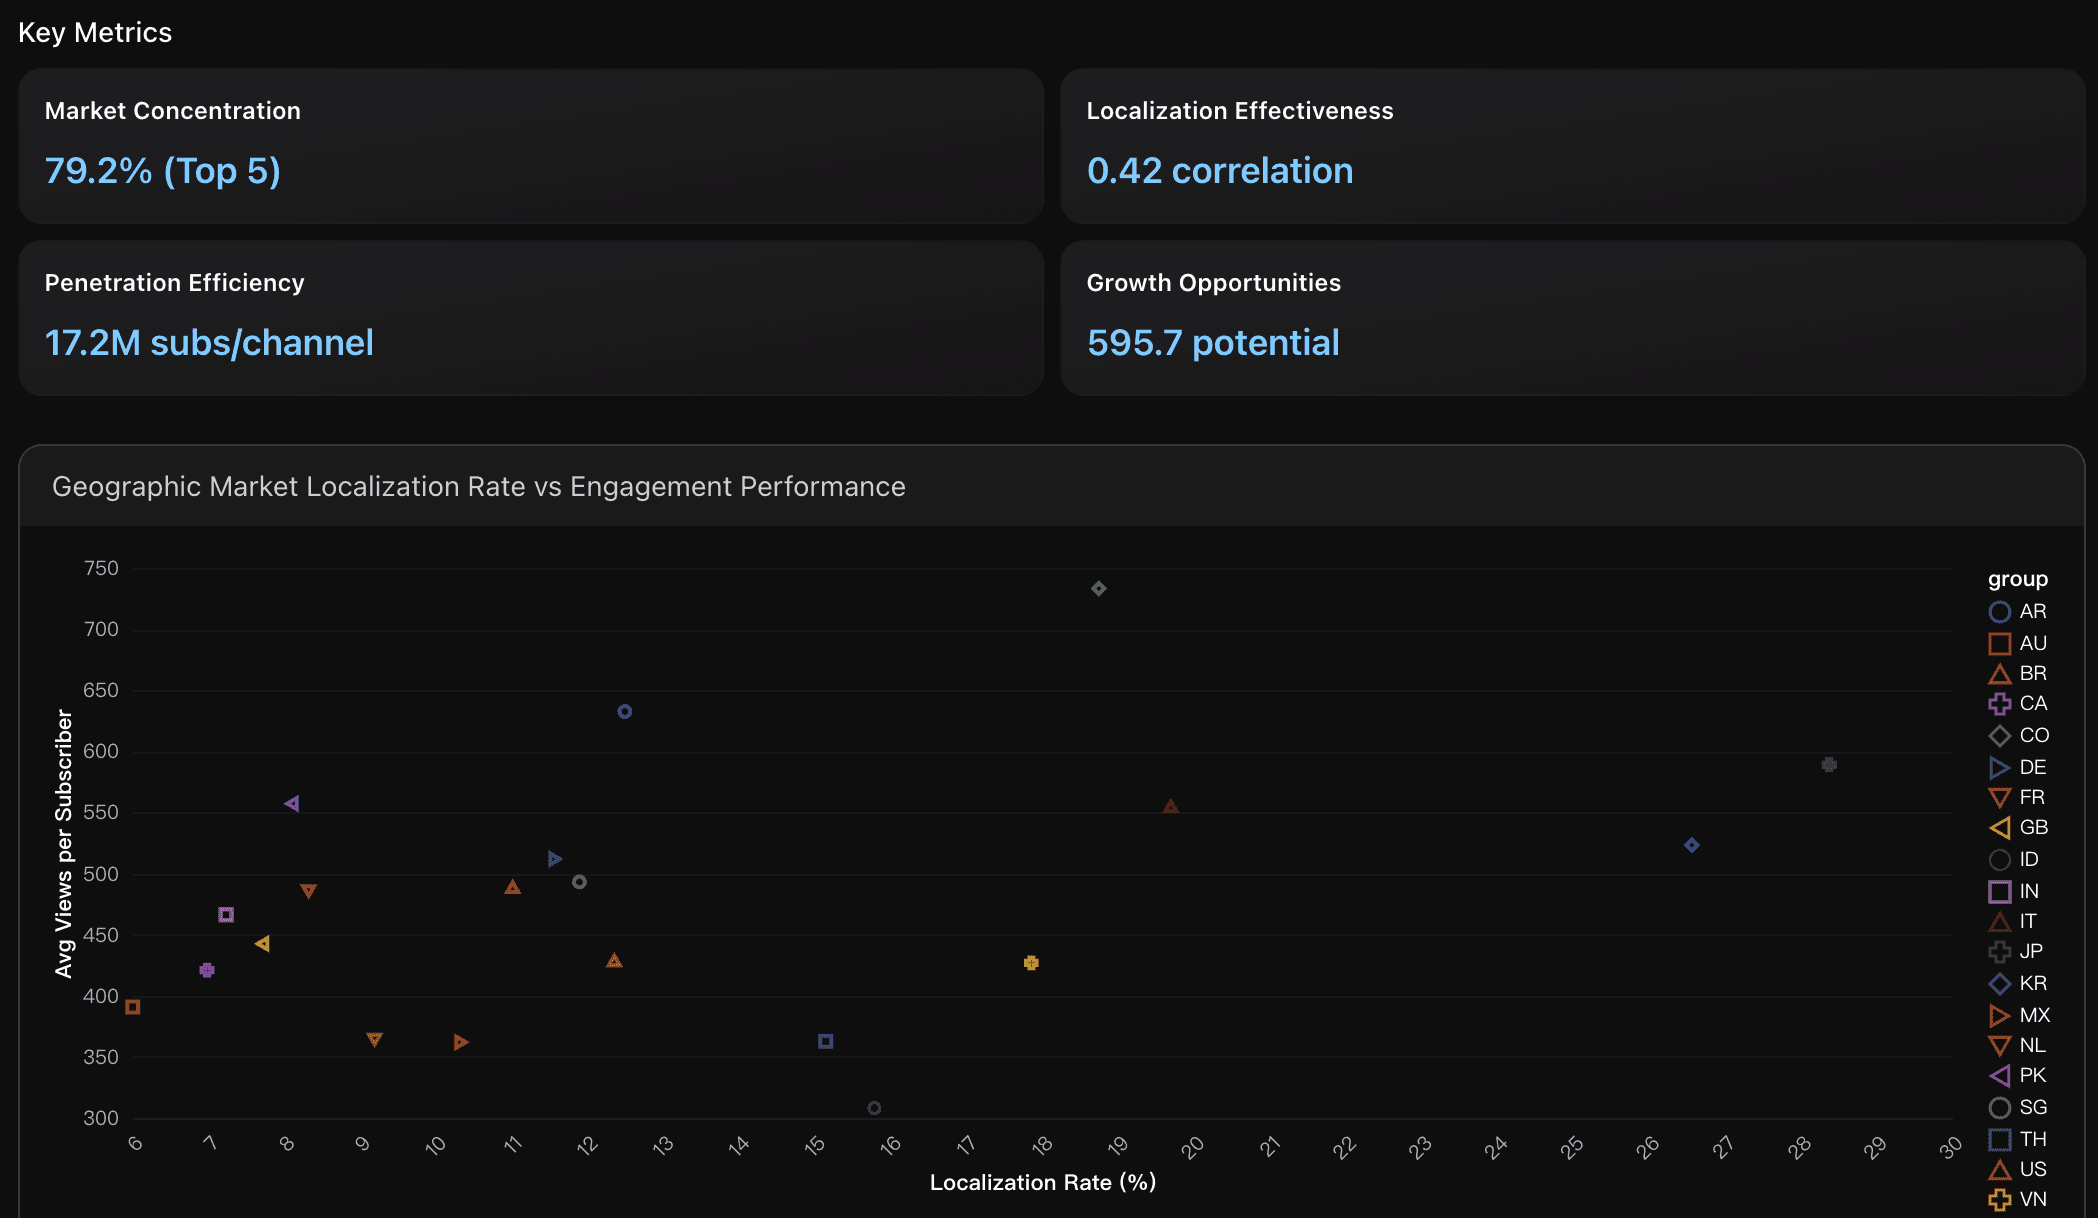
Top 5 markets (US, India, UK, Canada, Australia) control 79.2% of global subscribers and 78.8% of channels, indicating high geographic concentration with HHI index of 0.1788. US leads with 40.5% subscriber market share and 4.6M average subscribers per channel, while India demonstrates strong efficiency with 6.4M subscribers per channel despite lower 7.2% localization rate.
Custom URL Adoption
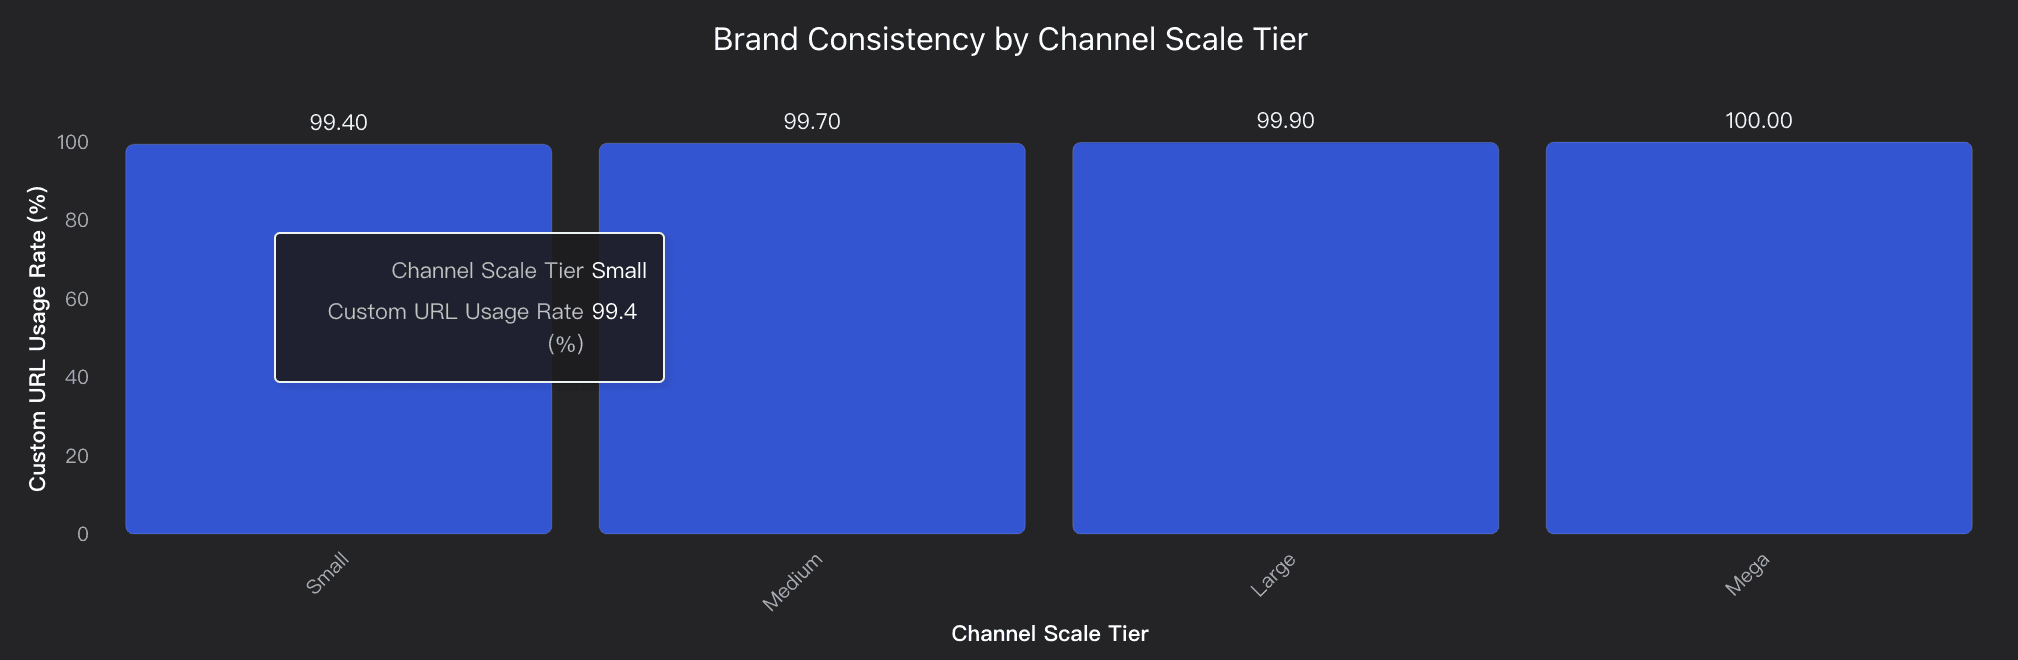
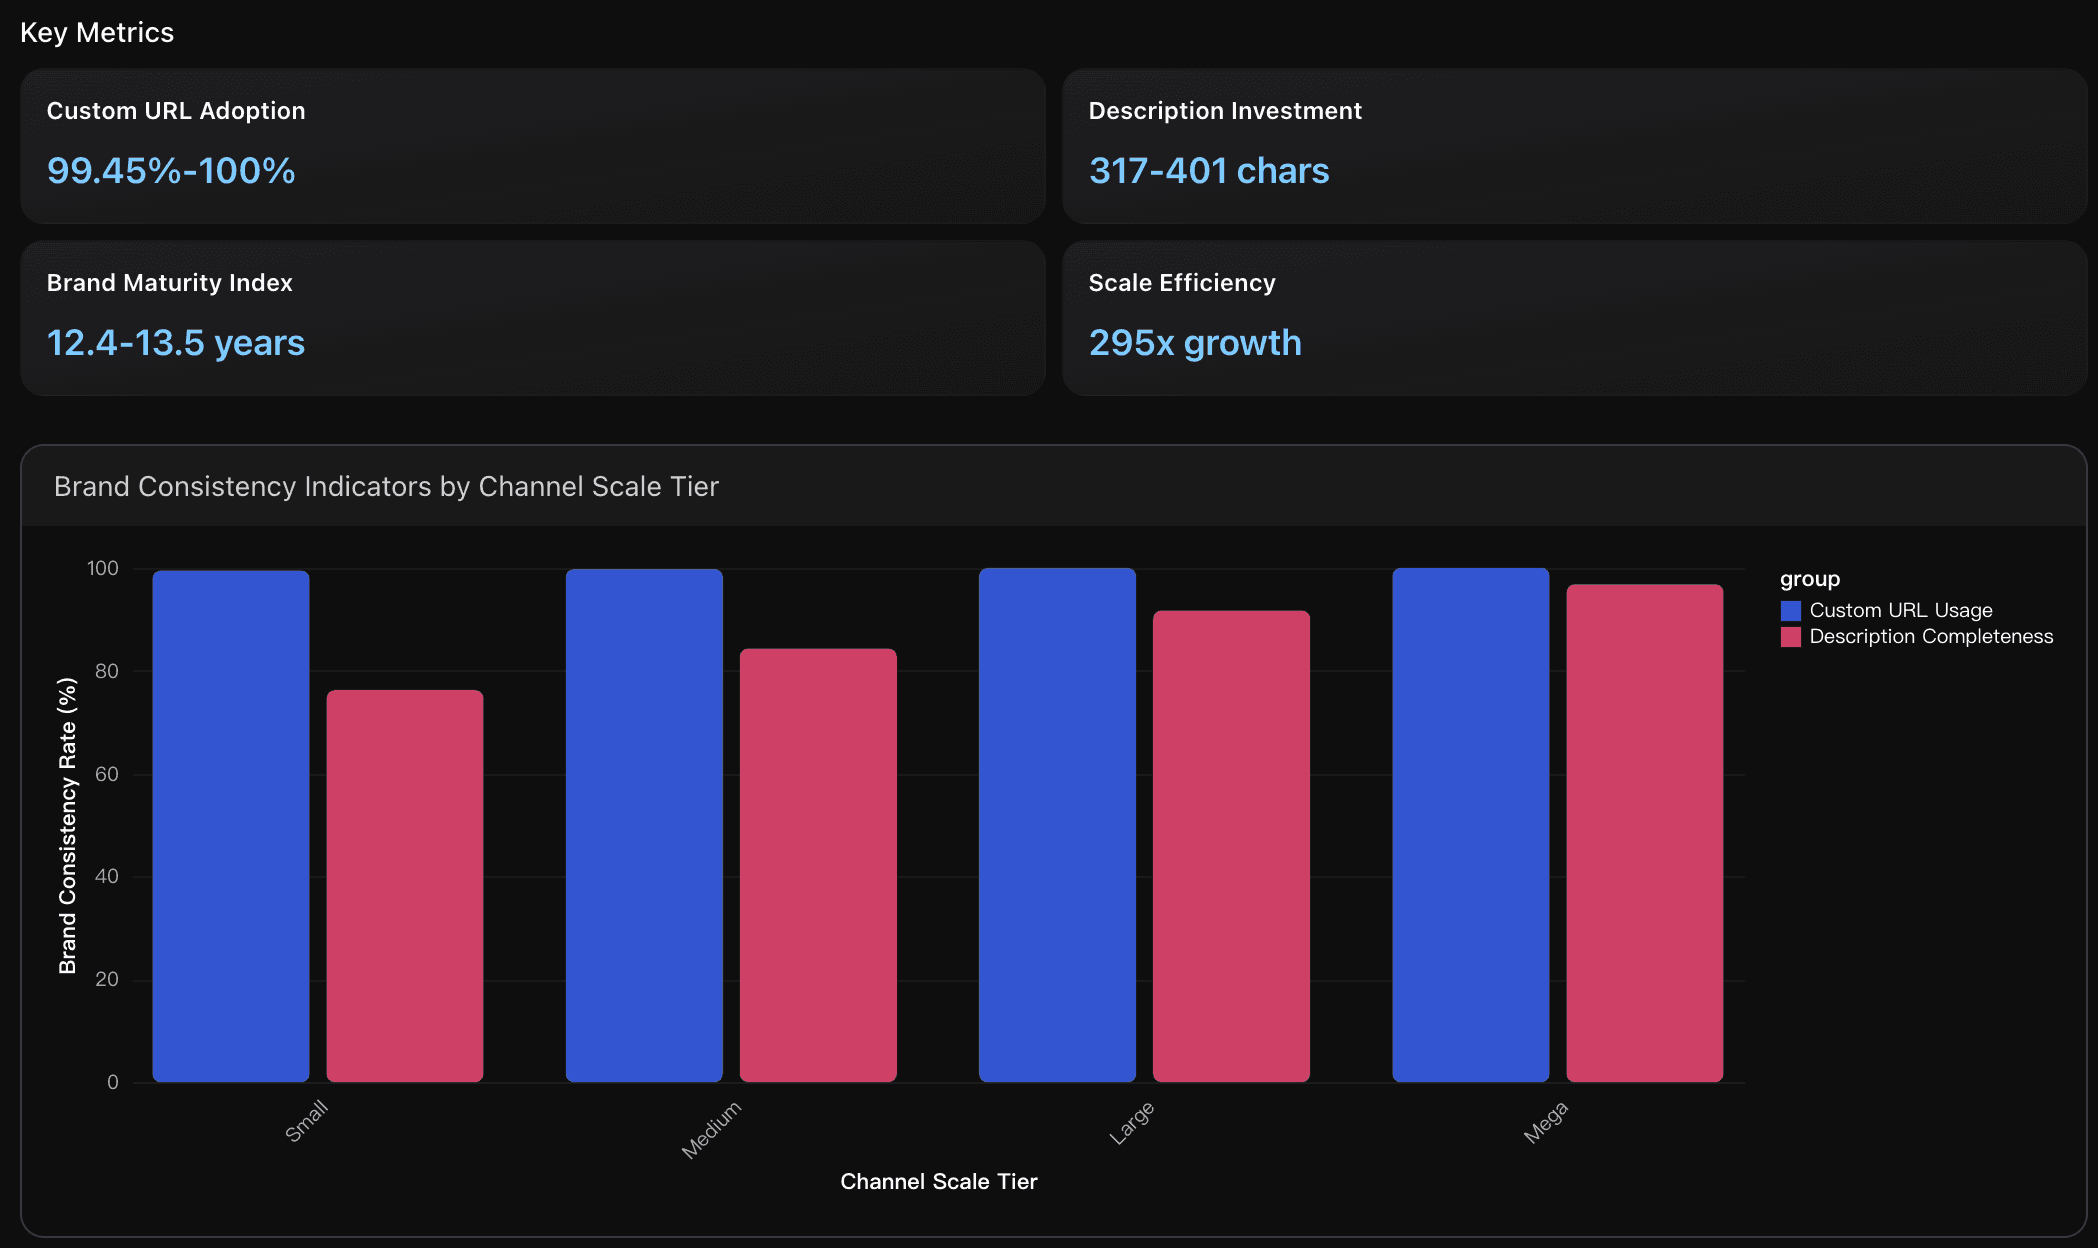
Custom URL usage demonstrates clear brand maturity correlation with channel scale. Small channels achieve 99.45% adoption while Mega channels reach 100% adoption. This 0.55% gap represents significant branding investment barriers for smaller creators, indicating that professional brand establishment requires scale-driven resources and strategic planning capabilities.
Actionable Insights
Focus on high-engagement niche positioning over mass-market reach. The data reveals that Music of Latin America achieves 929 views/subscriber despite having only 247 channels, while Entertainment with 4,826 channels generates just 528 views/subscriber. This 75% engagement advantage demonstrates that specialized content categories build more passionate audiences. Prioritize content vertical specialization in Soul Music ( 797 engagement ), Professional Wrestling ( 755 engagement ), or Rhythm and Blues ( 863 engagement ) rather than competing in oversaturated Entertainment or Film categories. These niche verticals offer higher content efficiency with 6.9-10.4M views per video compared to Entertainment's 606K views per video, enabling stronger brand differentiation and more cost-effective audience acquisition through superior content resonance.
Implement a tiered geographic expansion strategy focusing on three priority areas: (1) High-potential localization markets - Invest in cultural adaptation for Pakistan ( 557.2 views/subscriber ), Germany ( 511.8 views/subscriber ), and Singapore ( 493.2 views/subscriber ) which show strong engagement but low localization rates below 12%, representing untapped growth potential. (2) Replicate Latin American success - Scale the localization strategies proven effective in Argentina ( 17.2M subscribers/channel ), Colombia ( 13.6M subscribers/channel ), and Mexico ( 12.5M subscribers/channel ) to other Spanish-speaking markets, as these demonstrate exceptional penetration efficiency through cultural adaptation. (3) Diversify beyond concentration risk - Reduce dependency on the top 5 markets controlling 79.2% of global subscribers by targeting emerging Asian markets like Vietnam and Thailand, which show positive localization trends with 17.9% and 15.2% rates respectively, enabling sustainable geographic diversification while maintaining brand consistency across cultural boundaries.
Implement a three-tier branding investment strategy based on scale progression patterns observed in the data. For emerging channels, prioritize custom URL acquisition (achieving 99.45%+ adoption rate ) and establish minimum description standards of 350+ characters to match Medium-tier benchmarks. For established channels, focus on professional description optimization targeting 380+ character descriptions like Large-tier channels, while developing systematic brand storytelling frameworks. For scaling operations, adopt Mega-channel standards including 100% custom URL coverage and 400+ character descriptions to maximize the 295x growth potential demonstrated by top-tier channels. This graduated approach acknowledges resource constraints while establishing clear branding milestones that correlate with audience scale advancement.
Analysis Overview
The YouTube ecosystem reveals sophisticated branding and positioning strategies across three critical dimensions. Content Category Positioning shows clear winners, with Music of Asia leading at 6.8M average subscribers and Music of Latin America achieving exceptional engagement with 929 views per subscriber. These categories demonstrate how genre-specific positioning can drive massive audience building. Geographic Brand Localization strategies show market concentration effects, where US channels dominate with 22.7B total subscribers across 4,926 channels, while India achieves higher engagement efficiency at 466 views per subscriber, suggesting more targeted positioning. Channel Scale Brand Consistency reveals a progression pattern - Mega channels achieve 100% custom URL adoption versus 99.4% for small channels, paired with 25% longer descriptions (401 vs 317 characters), indicating that successful positioning requires comprehensive brand infrastructure. Industry benchmarks show 47% of users interact with brands weekly on YouTube, while 70% seek educational content, creating opportunities for strategic positioning. The data suggests successful branding strategies require category expertise, cultural adaptation, and scale-appropriate consistency investments to achieve optimal market positioning.
Data Analysis
Category-Based Brand Positioning Strategy
Analvsis of content category performance metrics revealing how different content verticals drive subscriber engagement and brand positioning. Music of Asia and Entertainment categories lead with 6.8M and 6M average subscribers respectively, indicating strong brand resonance in these verticals.
Geographic Market Concentration and Brand Localization
Examination of channel distribution across global markets showing US dominance with 4.9K channels and 22.7B total subscribers, while emerging markets like India demonstrate high engagement rates with 466 views per subscriber, suggesting effective localization strategies.
Channel Scale Tier Brand Consistency Patterns
Investigation of branding consistency indicators across different channel scales, revealing that brand establishment correlates with scale - Mega channels (100% custom URL usage) demonstrate superior brand consistency compared to smaller tiers, along with more detailed descriptions (401 vs 317 characters).
Conclusion
In a creator economy driven by algorithms, data is the new creative edge.
Through Powerdrill Bloom’s AI-powered exploration of the Kaggle YouTube dataset, we’ve uncovered what really fuels growth—engagement efficiency, market gaps, and audience concentration that separate thriving creators from the rest.
The insights are clear: categories like Latin American Music, Korean Gaming, and Christian Music aren’t just trends—they’re untapped opportunities backed by data. And while saturated markets struggle for attention, data-savvy creators are using insights like these to find their edge, grow faster, and build more loyal audiences.
If you’re serious about discovering your next winning niche, Powerdrill Bloom makes it possible.
Stop guessing. Start discovering.
Let the data tell you where your next viral moment begins.


