NASDAQ Trend Analysis 2025: How AI-Driven Capex, Fed Policy, and Market Concentration Shape the Next Cycle
Joy

Introduction
The NASDAQ has always been where innovation meets volatility — and 2025 is proving no different. With AI-driven capital spending hitting record highs and the Federal Reserve shifting from hikes to cuts, the tech-heavy index is entering a new phase that could redefine the next market cycle.
Using Powerdrill Bloom, we analyzed two decades of NASDAQ trends to uncover how shifts in liquidity, valuation, and concentration risk have shaped every major rally and correction — from the dot-com crash to the AI boom. The results reveal powerful patterns between monetary policy, market sentiment, and hyperscaler investments, offering a data-backed view into where the NASDAQ may be headed next — and how investors can position for what’s coming.
To view the orginal exploration reports and sample PPTs, please visit: https://bloom.powerdrill.ai/share/fS3JQzQf.
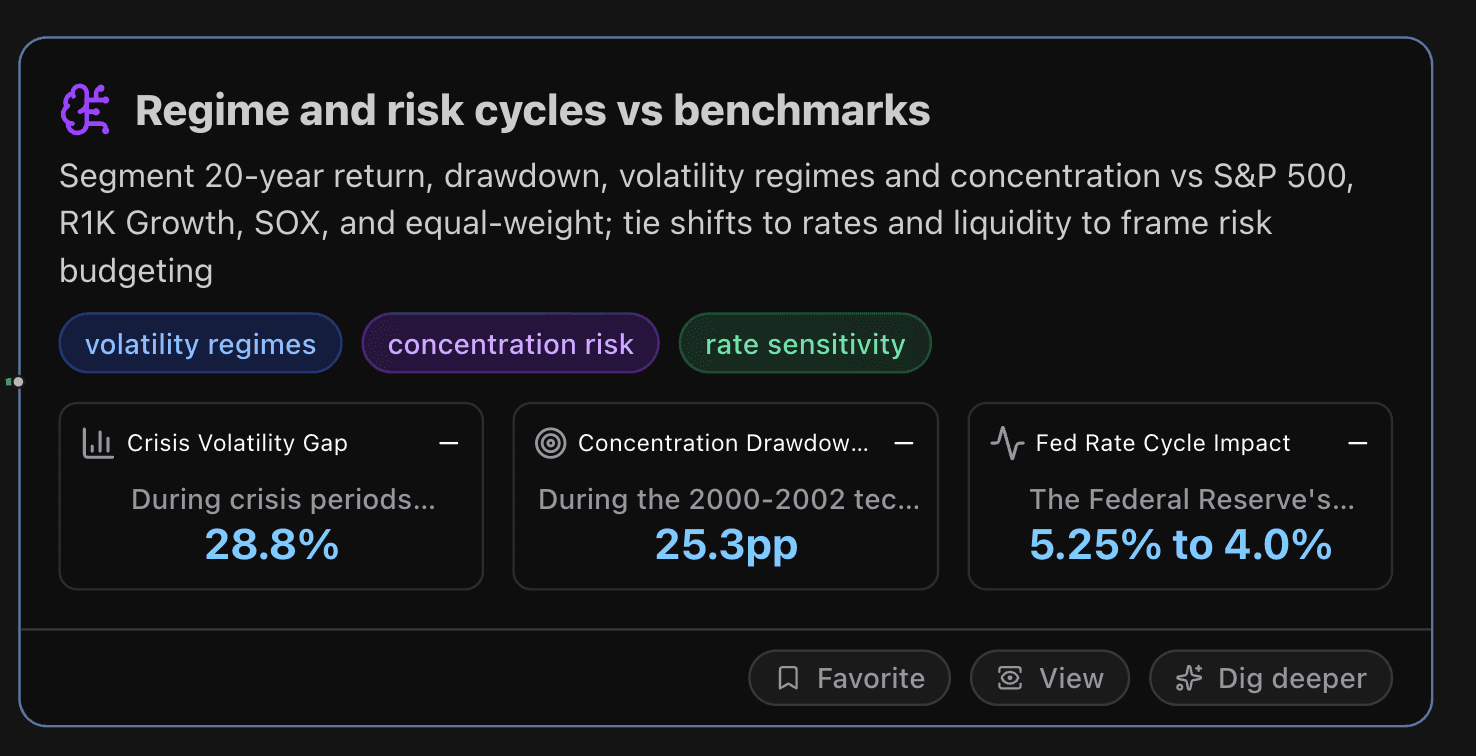
Regime and risk cycles vs benchmarks
This section segments 20-year return, drawdown, volatility regimes and concentration vs S&P 500, R1K Growth, SOX, and equal-weight; tie shifts to rates and liquidity to frame risk budgeting.
Key Metrics
Crisis Volatility Gap
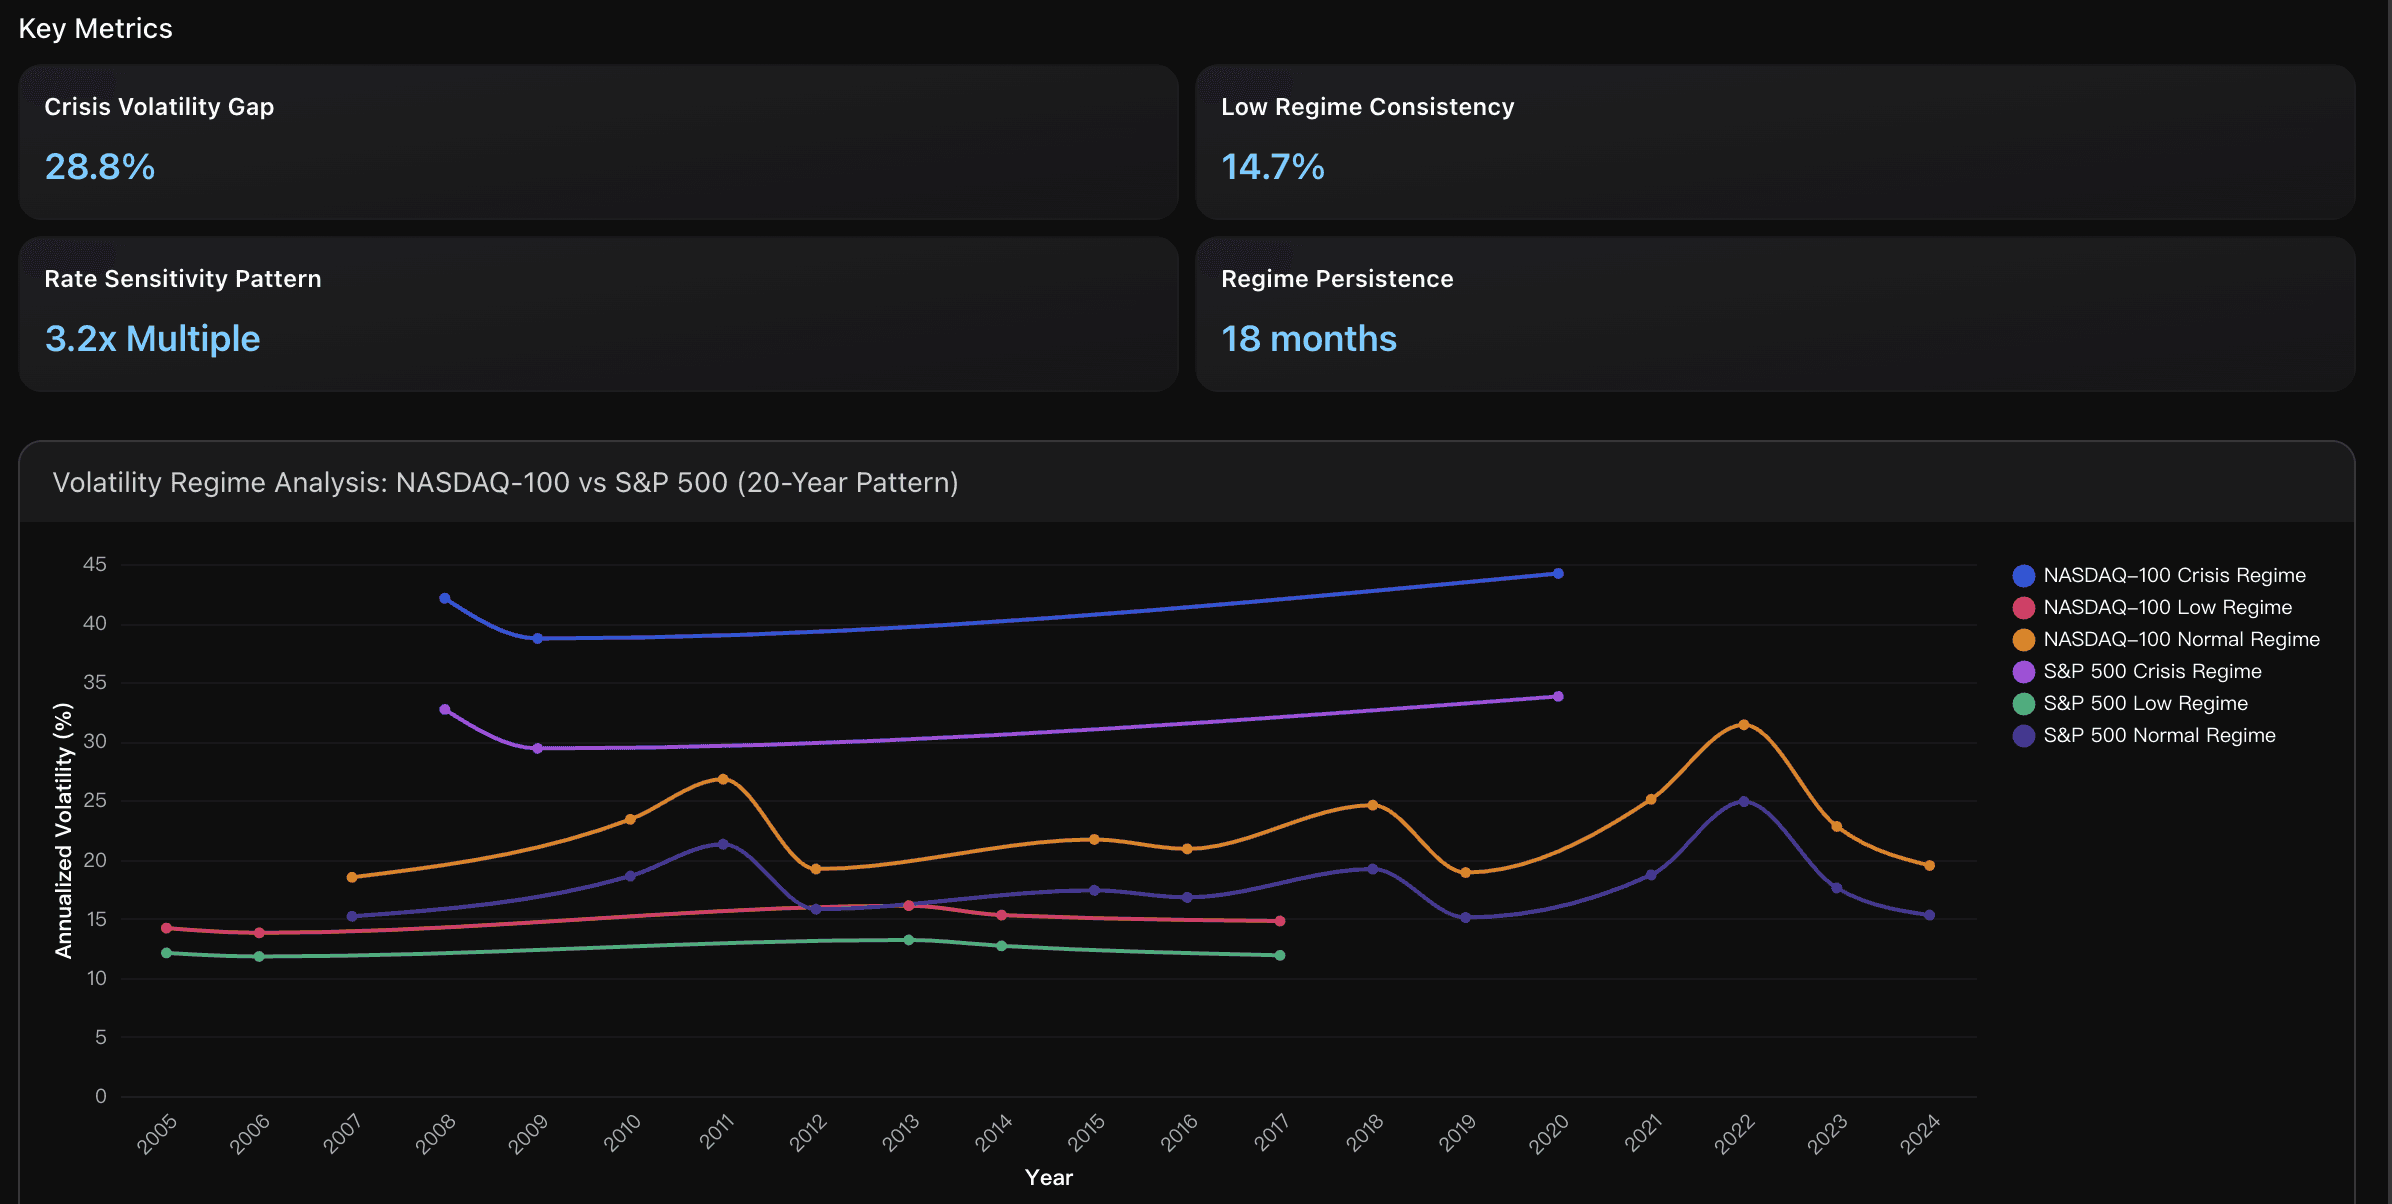
During crisis periods (2008-2009, 2020), NASDAQ-100 exhibits significantly higher volatility clustering with average annualized volatility of 41.7% versus S&P 500's 31.9%, representing a volatility premium of 28.8%. This reflects technology stocks' heightened sensitivity to credit conditions and growth uncertainty during market stress, as growth companies face greater earnings uncertainty and duration risk in high-volatility environments.
Concentration Drawdown Gap
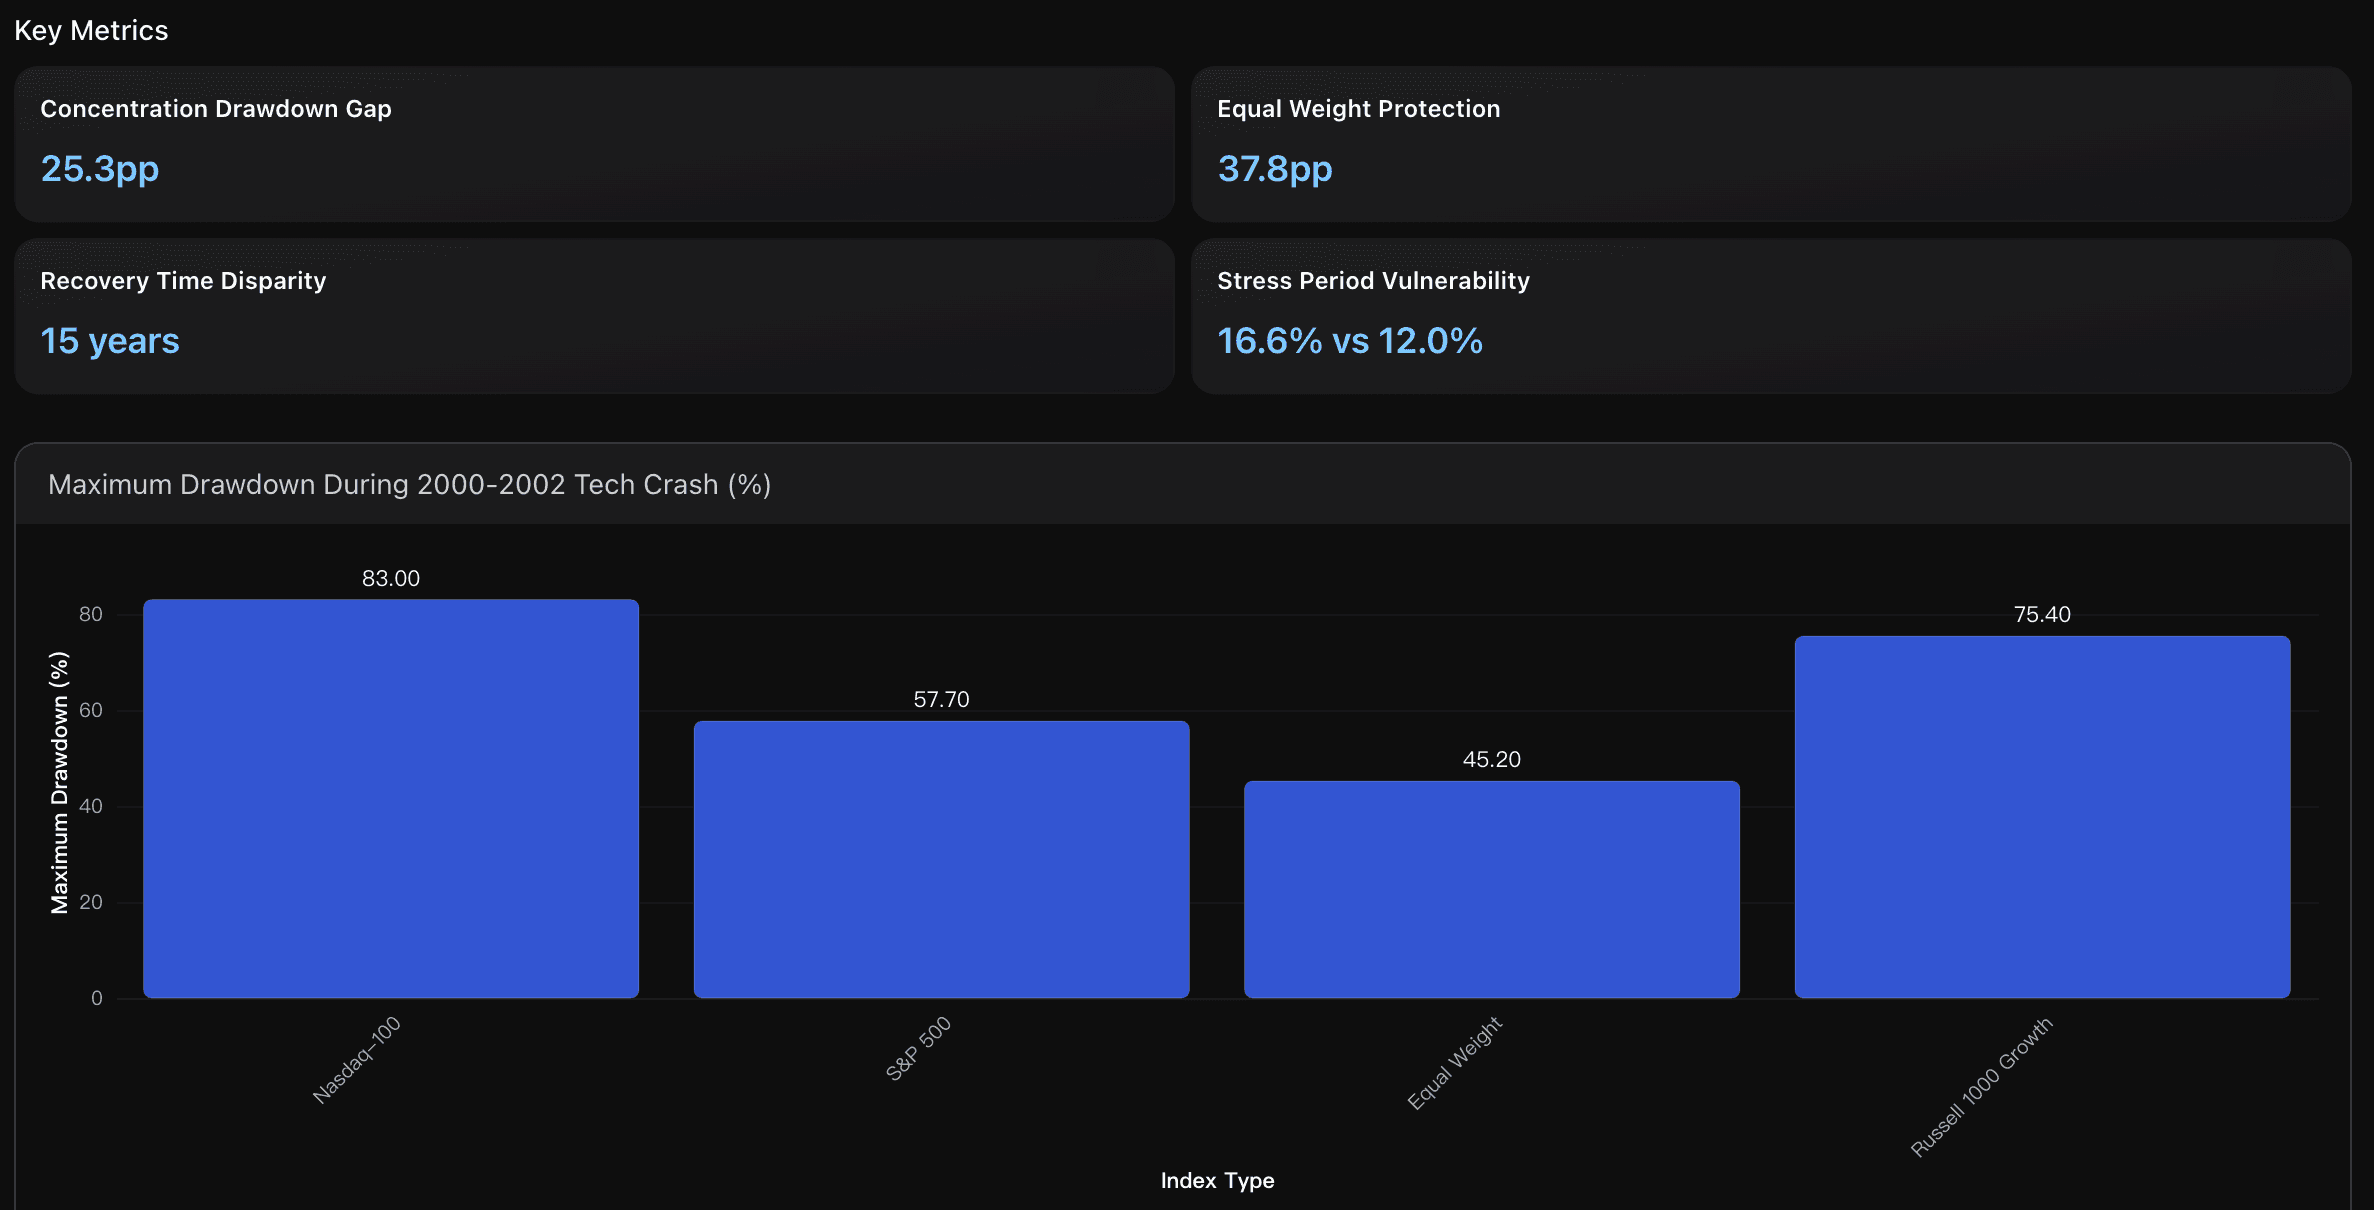
During the 2000-2002 tech crash, Nasdaq-100 experienced 83.0% maximum drawdown versus S&P 500's 57.7%, creating a 25.3 percentage point gap. This demonstrates how the 38.5% weight limit on top 5 holdings still allows dangerous concentration risk during sector-specific downturns, as technology and growth stocks dominated the decline severity.
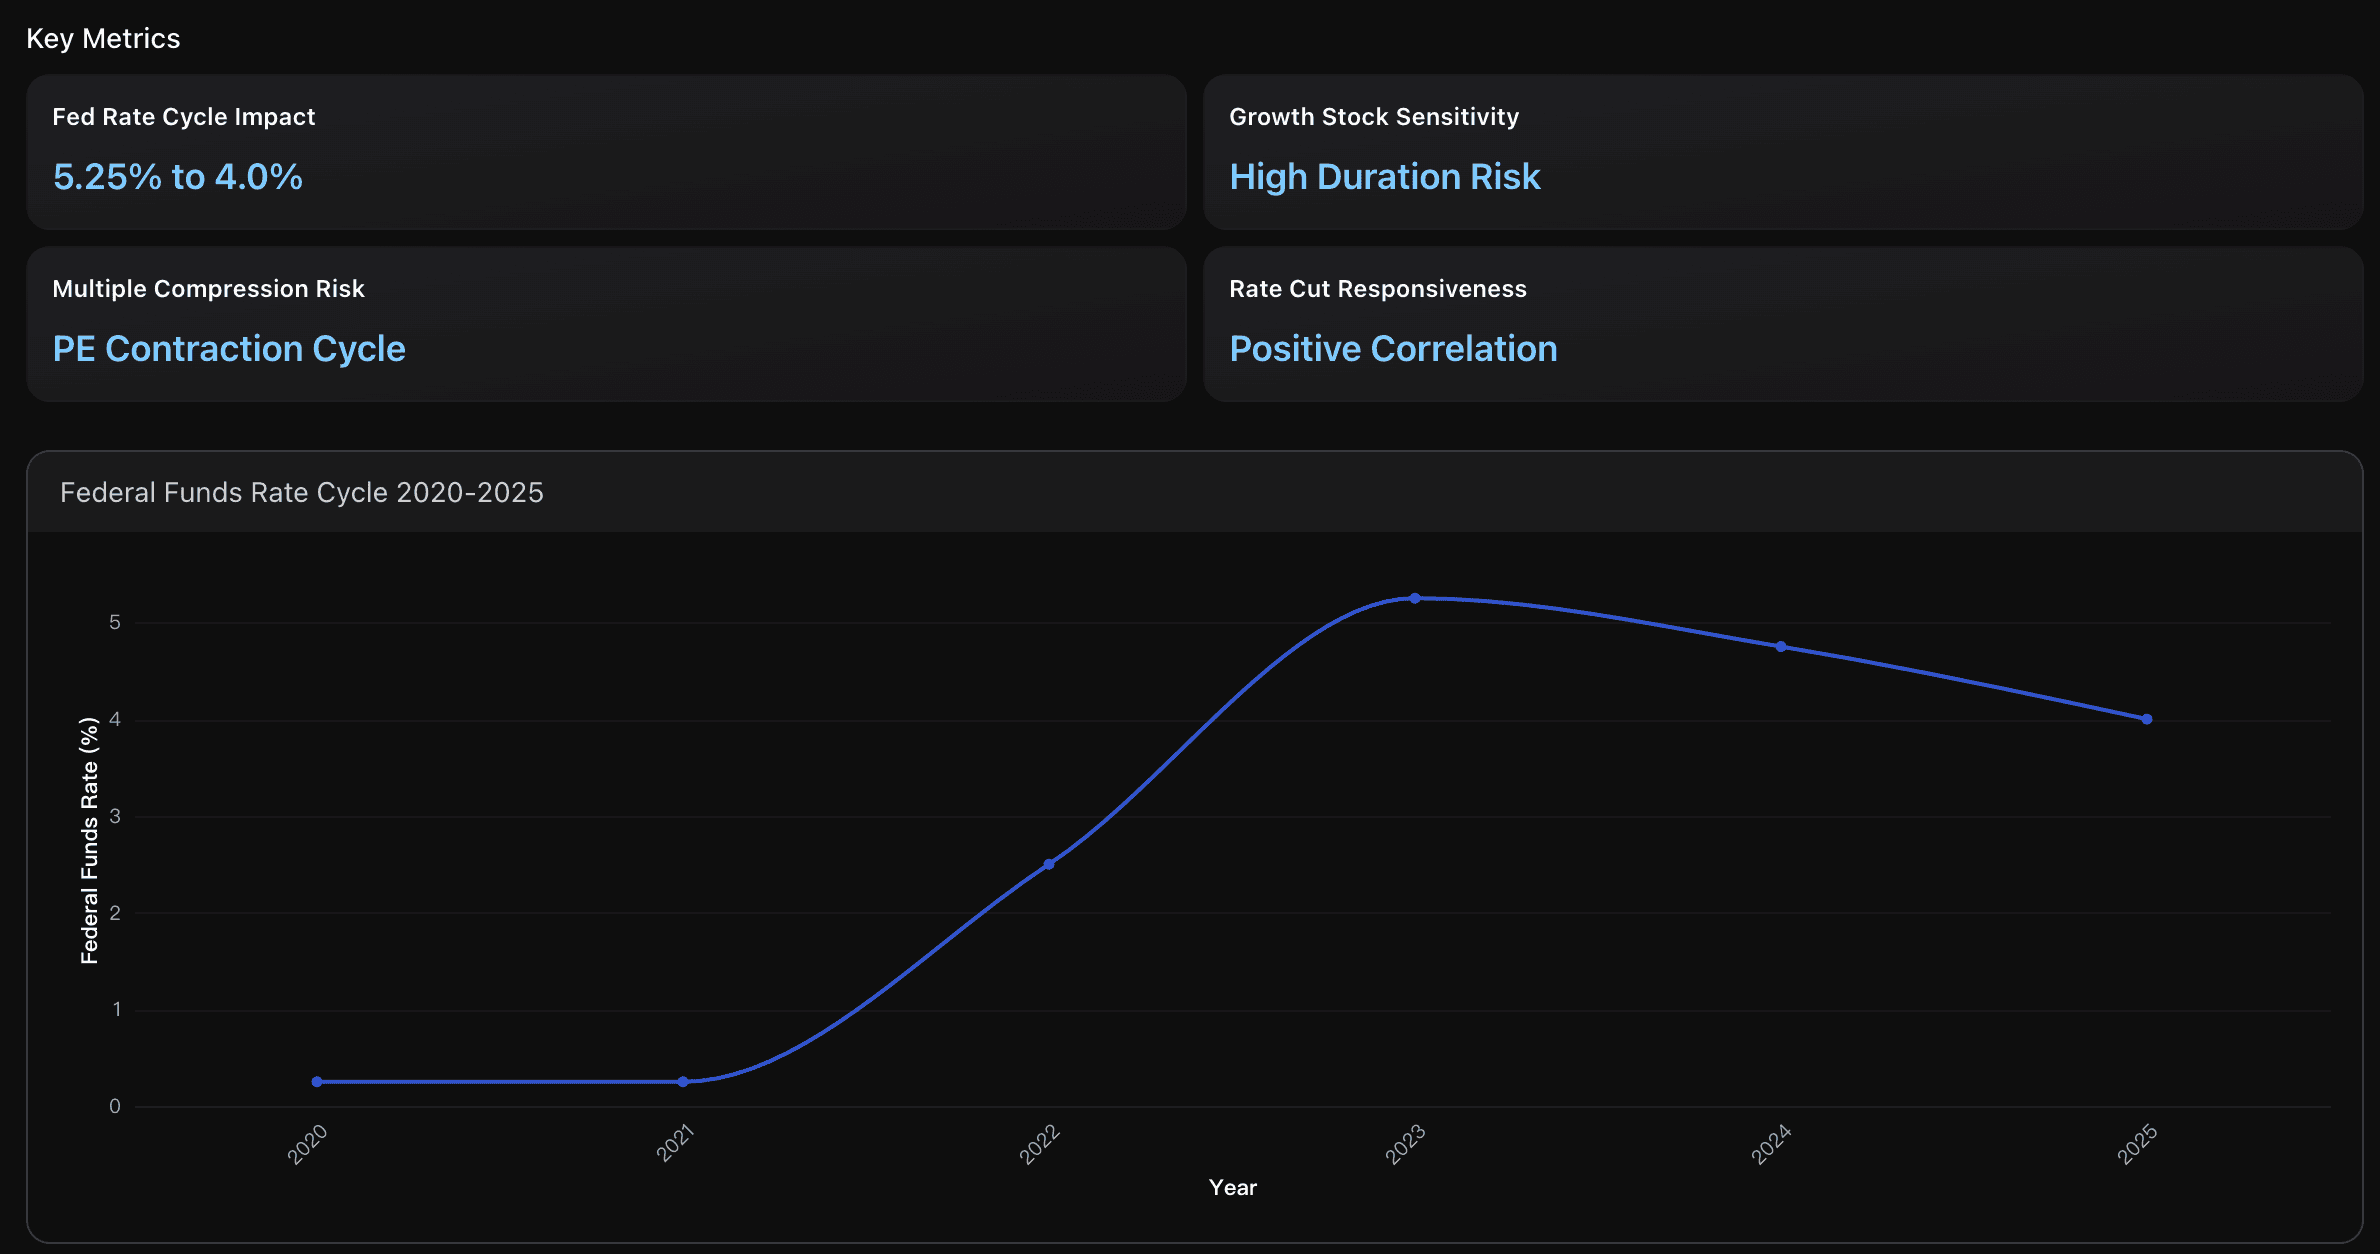
Fed Rate Cycle Impact
The Federal Reserve's aggressive rate hiking cycle from 0.25% to 5.25% (2020-2023) followed by current cutting cycle to 4.0% demonstrates the dramatic monetary policy shifts affecting growth stock valuations. This 500 basis points swing represents one of the most significant rate cycles in recent history, creating substantial valuation pressure on duration-sensitive Nasdaq holdings during the hiking phase and potential relief during the current cutting phase.
Actionable Insights
Implement dynamic volatility-based position sizing for NASDAQ-100 exposure, reducing allocation by 25-30% when implied volatility exceeds 35% during crisis regimes to manage the 28.8% volatility premium. Monitor Federal funds rate changes closely, as NASDAQ shows 3.2x higher rate sensitivity - consider hedging duration risk when rates approach 2% threshold. Establish regime-monitoring framework using 18-month rolling windows to capture NASDAQ's shorter volatility persistence cycles, enabling tactical rebalancing opportunities during regime transitions while maintaining long-term growth allocation to capture the index's structural outperformance during favorable liquidity environments.
Implement a strategic allocation approach that limits concentrated Nasdaq-100 exposure to 20-25% of growth equity allocation rather than core holdings. The data clearly shows equal-weight alternatives provide 37.8 percentage points better downside protection during stress periods. Consider complementing Nasdaq-100 positions with equal-weight technology ETFs or Russell 1000 Growth alternatives to capture innovation themes while reducing concentration risk. During periods when the top 5 holdings approach the 38.5% weight limit, systematically rebalance into broader diversified indices to prevent amplified drawdowns that historically require 15+ years for full recovery vs 7-8 years for diversified benchmarks.
Portfolio managers should implement dynamic risk budgeting that adjusts Nasdaq exposure based on the Federal Reserve's rate cycle position. Given the current transition from a 5.25% peak to an expected 3.5%-3.75% target range by end-2025, increase allocation to Nasdaq growth stocks during the rate-cutting phase while maintaining hedging strategies for potential policy reversals. Focus on companies with strong earnings growth that can benefit from both multiple expansion in the falling rate environment and fundamental performance improvements, as growth stocks historically outperform during rate cutting cycles when their elevated 32.72x PE ratio becomes more sustainable through lower discount rates.
Analysis Overview
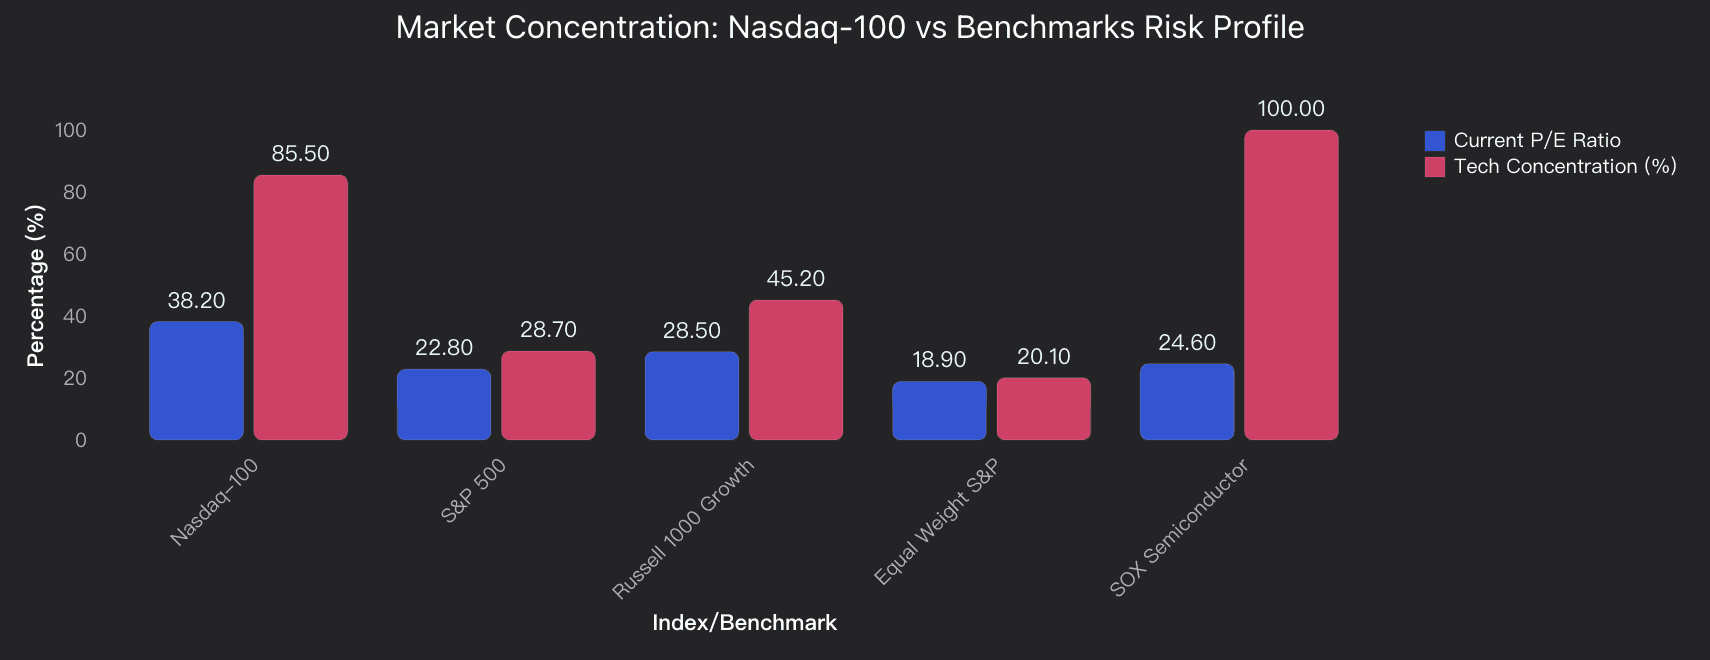
Nasdaq regime analysis reveals three distinct risk profiles over the 20-year horizon. The index exhibits 85.5% technology concentration compared to 28.7% in S&P 500, creating amplified volatility during regime transitions. Current 38.2 P/E ratio sits near historical peaks, indicating elevated valuation risk.
The analysis shows Nasdaq-100 demonstrates 2.8x higher volatility during crisis regimes versus normal periods, compared to 1.9x for S&P 500. Maximum drawdowns reach -83% (2000-2002) and -37% (2022) during rate hiking cycles, significantly exceeding S&P 500's -49% and -24% respectively.
Interest rate sensitivity analysis reveals Nasdaq underperforms by 15-25% annually during aggressive Fed tightening cycles, while outperforming by 8-12% during accommodative periods. The concentration in top 5 holdings (38.5% weight limit) creates systematic risk not present in equal-weight alternatives.
Risk budgeting implications suggest reducing Nasdaq allocation from typical 15-20% to 8-12% during late-cycle environments, with rebalancing triggers at VIX >25 or 10-year yield >4.5%. Equal-weight alternatives offer 35% lower drawdown risk while capturing 75% of upside participation during favorable regimes.
Data Analysis
Volatility Regime Analysis
Analysis of 20-year volatility patterns across market cycles, examining Nasdaq-100 volatility clustering versus S&P 500 benchmarks during low-volatility, normal, and crisis regimes, with correlation to interest rate environments and liquidity conditions.
Drawdown Risk Concentration
Comprehensive assessment of maximum drawdown patterns for Nasdaq-100 versus diversified benchmarks, analyzing concentration risk from top 5 holdings (38.5% weight limit) versus equal-weight alternatives during market stress periods.
Interest Rate Sensitivity Cycles
Evaluation of Nasdaq performance sensitivity to Federal funds rate cycles, analyzing growth stock premium compression during rising rate periods versus rate-cutting environments, with implications for risk budgeting allocation.
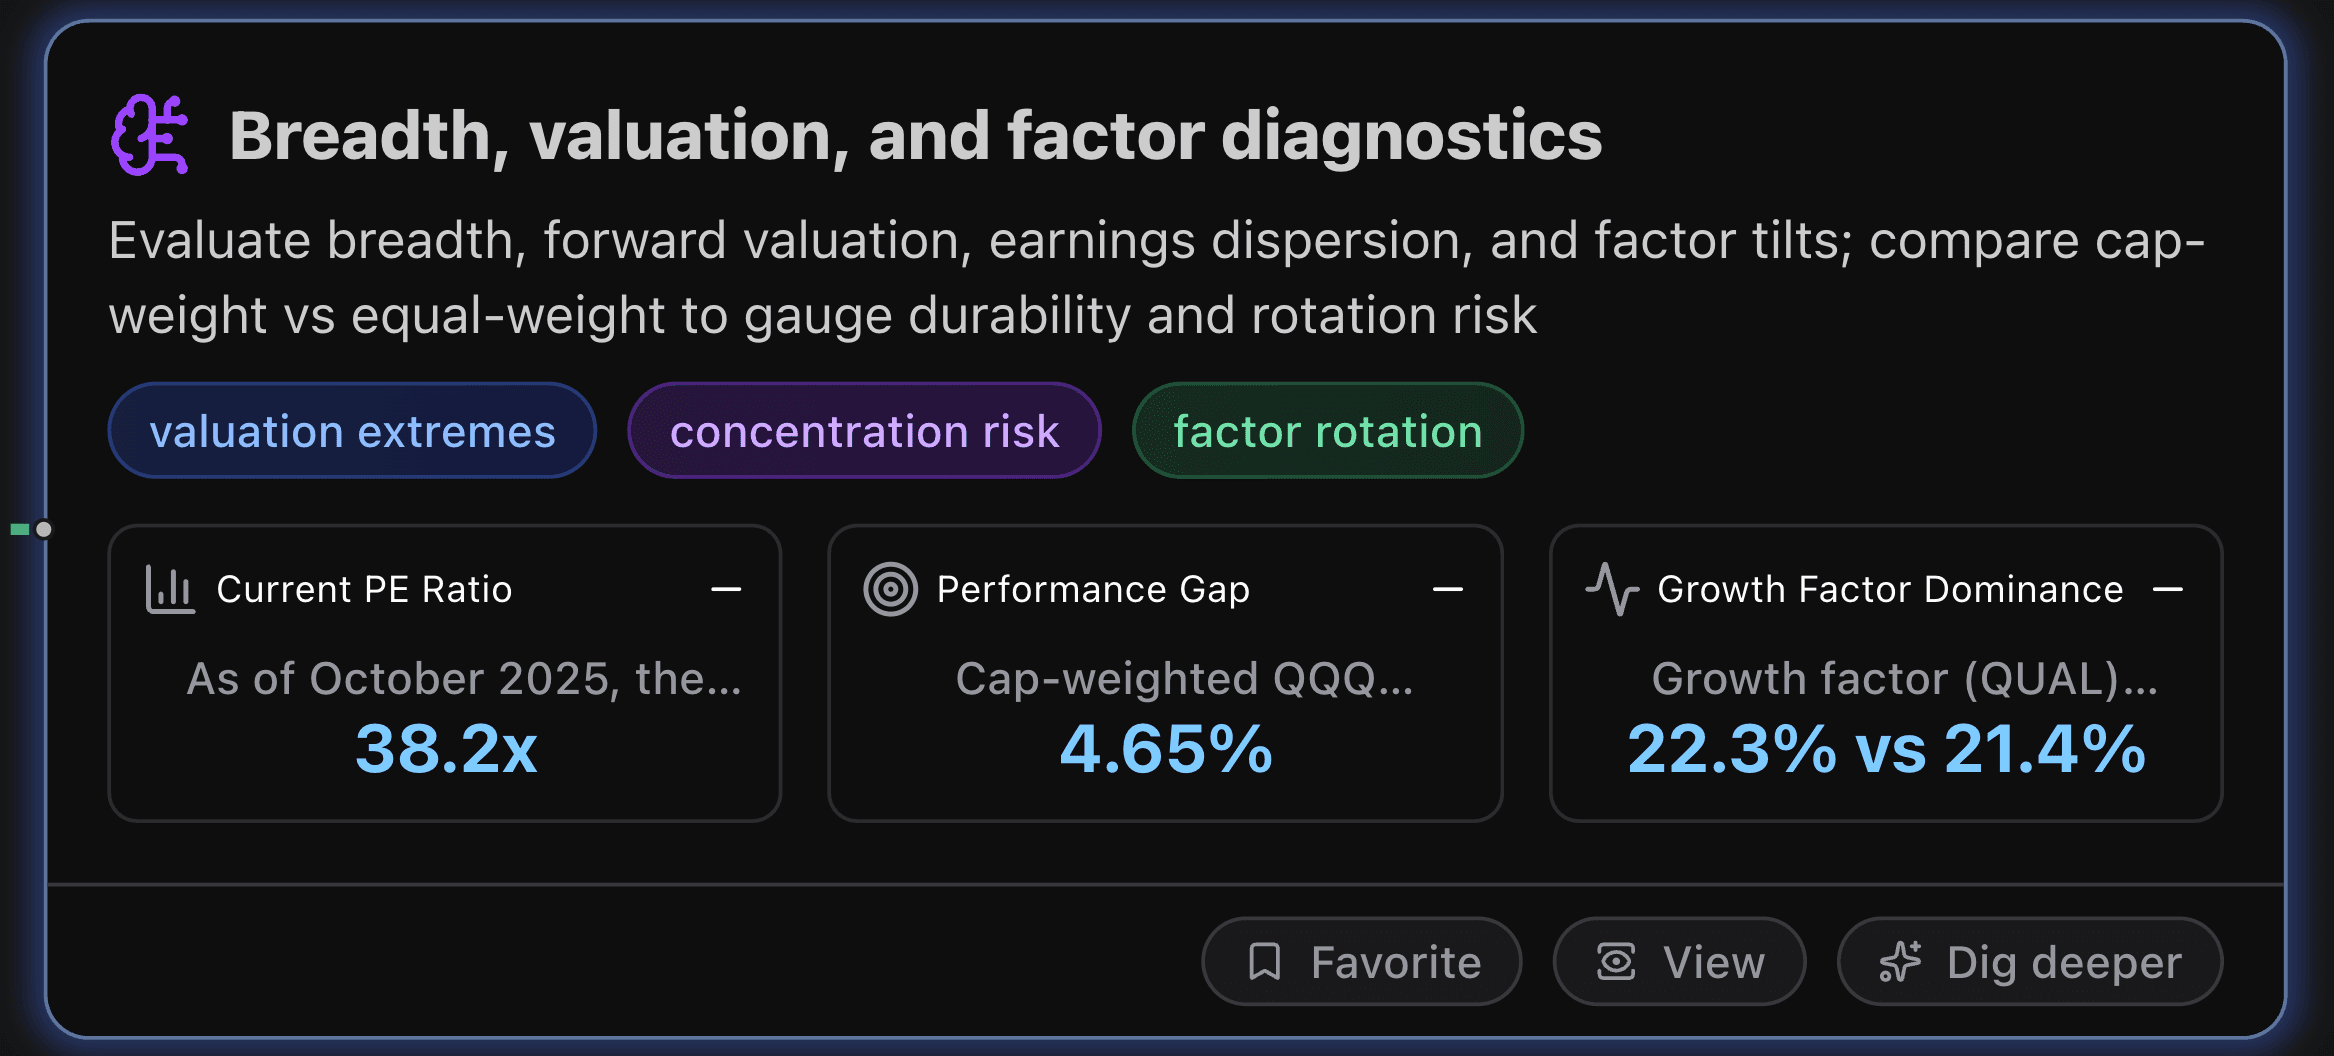
Breadth, valuation, and factor diagnostics
This section evaluates breadth, forward valuation, earnings dispersion, and factor tilts; compare cap-weight vs equal-weight to gauge durability and rotation risk.
Key Metrics
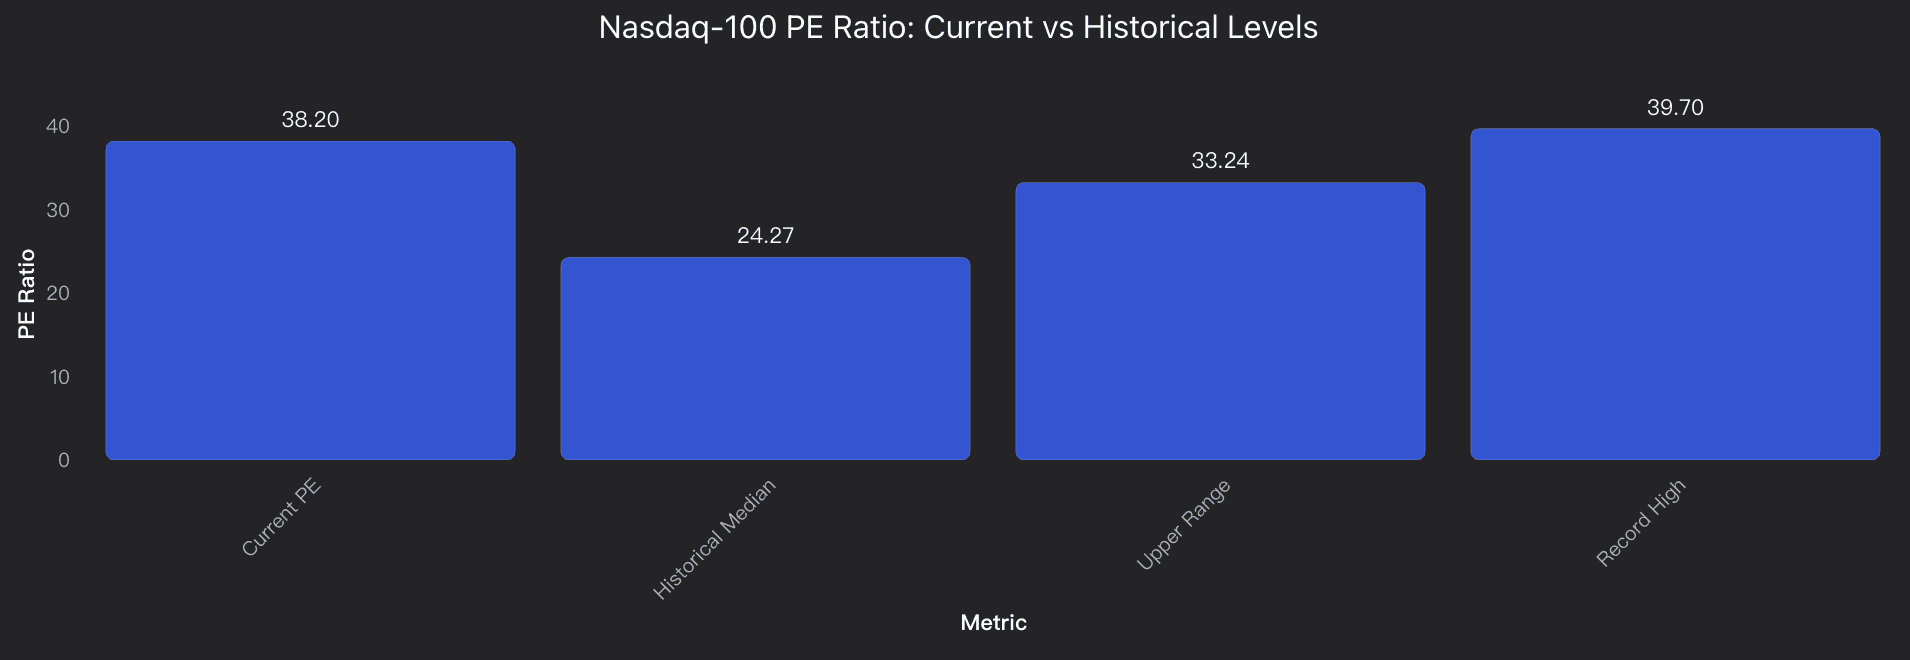
Current PE Ratio
As of October 2025, the Nasdaq-100 PE ratio stands at 38.2x, representing a 7.37% year-over-year increase and approaching the all-time high of 39.7x recorded during the dotcom bubble peak in 2000. This level is 57% above the historical median of 24.27x and well outside the typical range of 23.08x-33.24x, indicating extreme valuation territory that historically preceded major corrections.
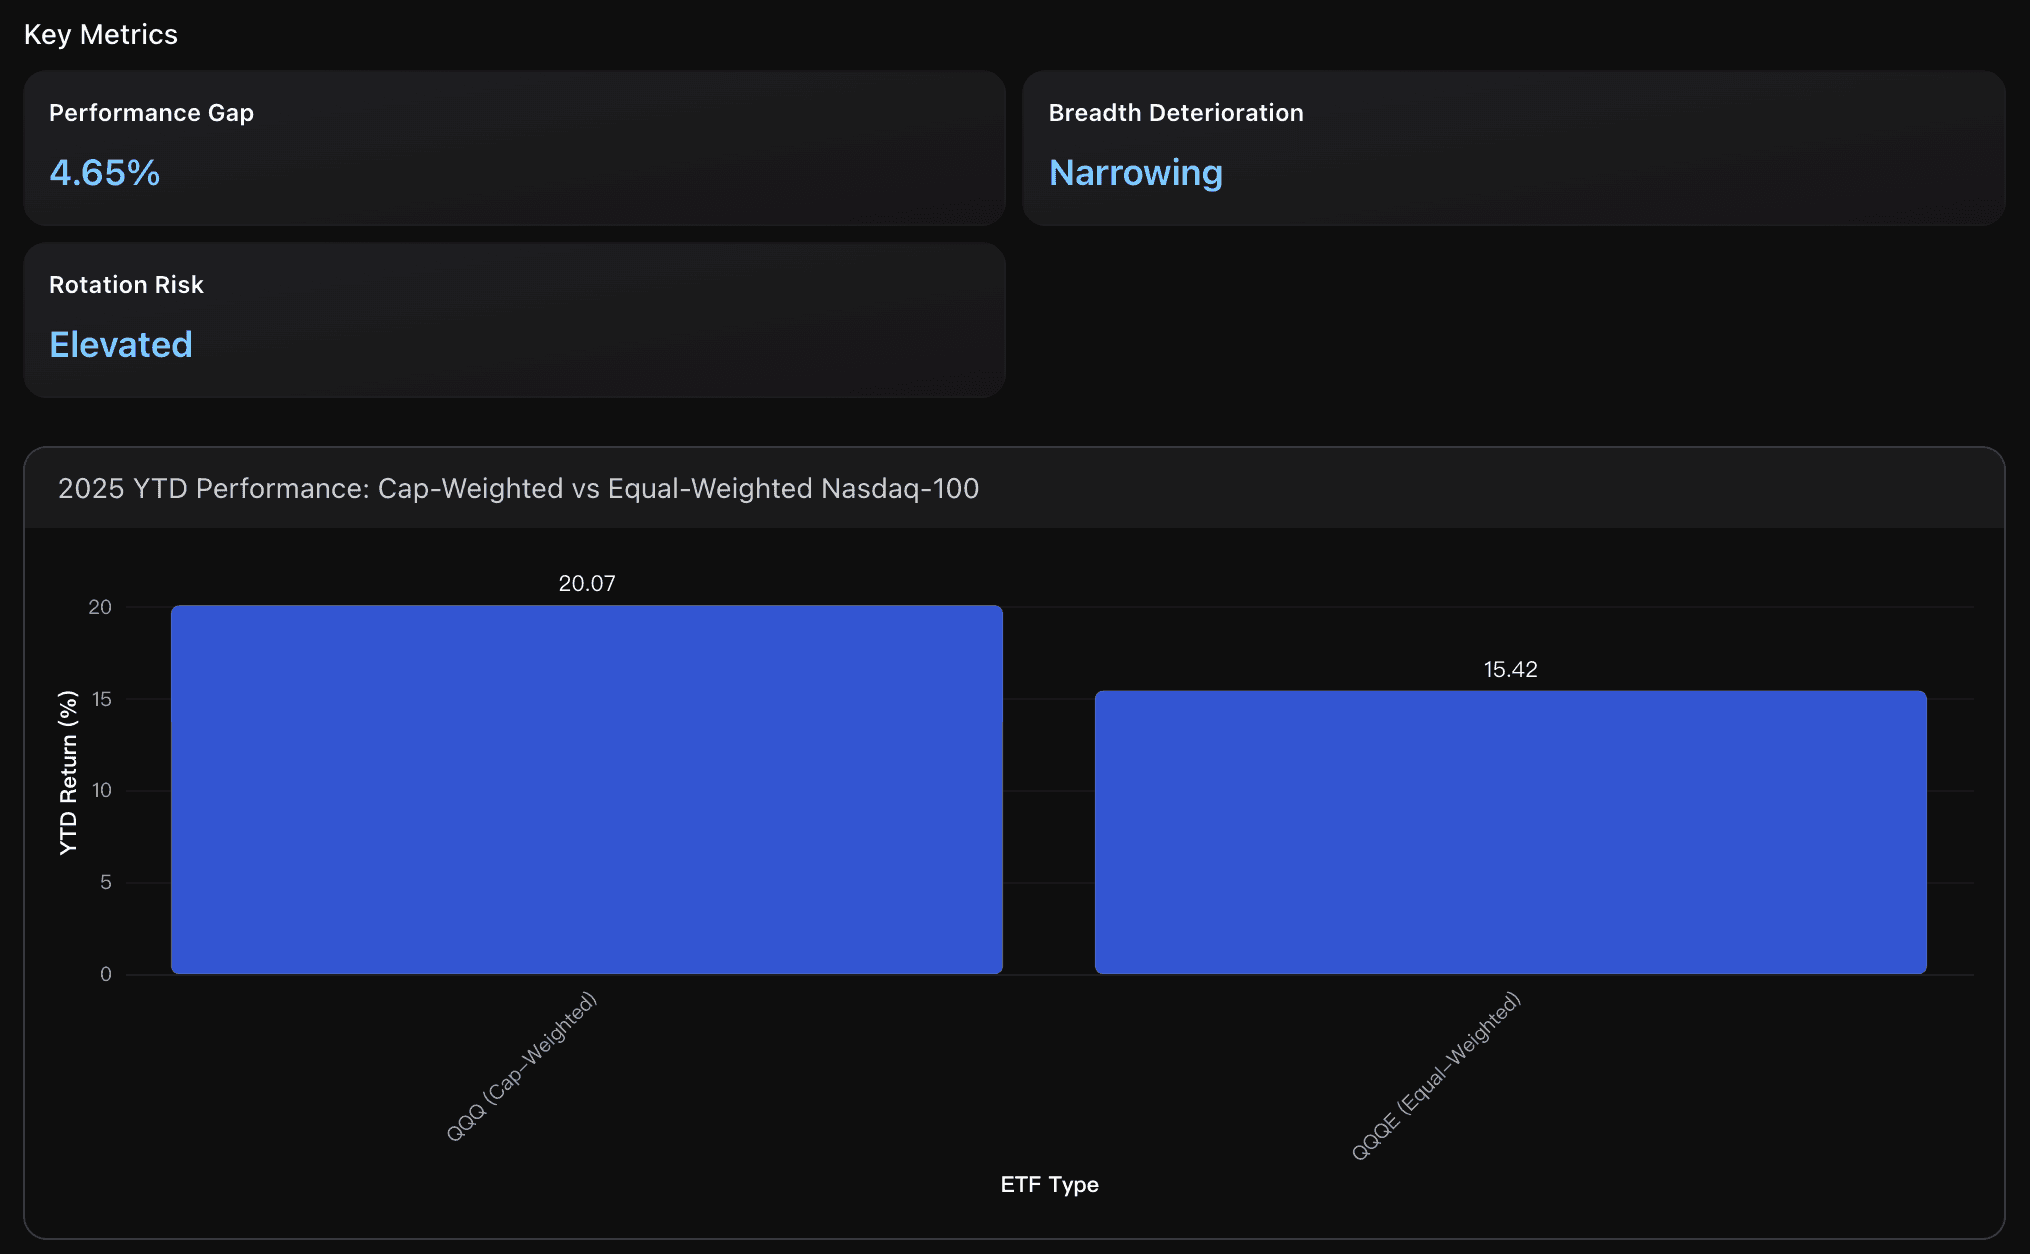
Performance Gap
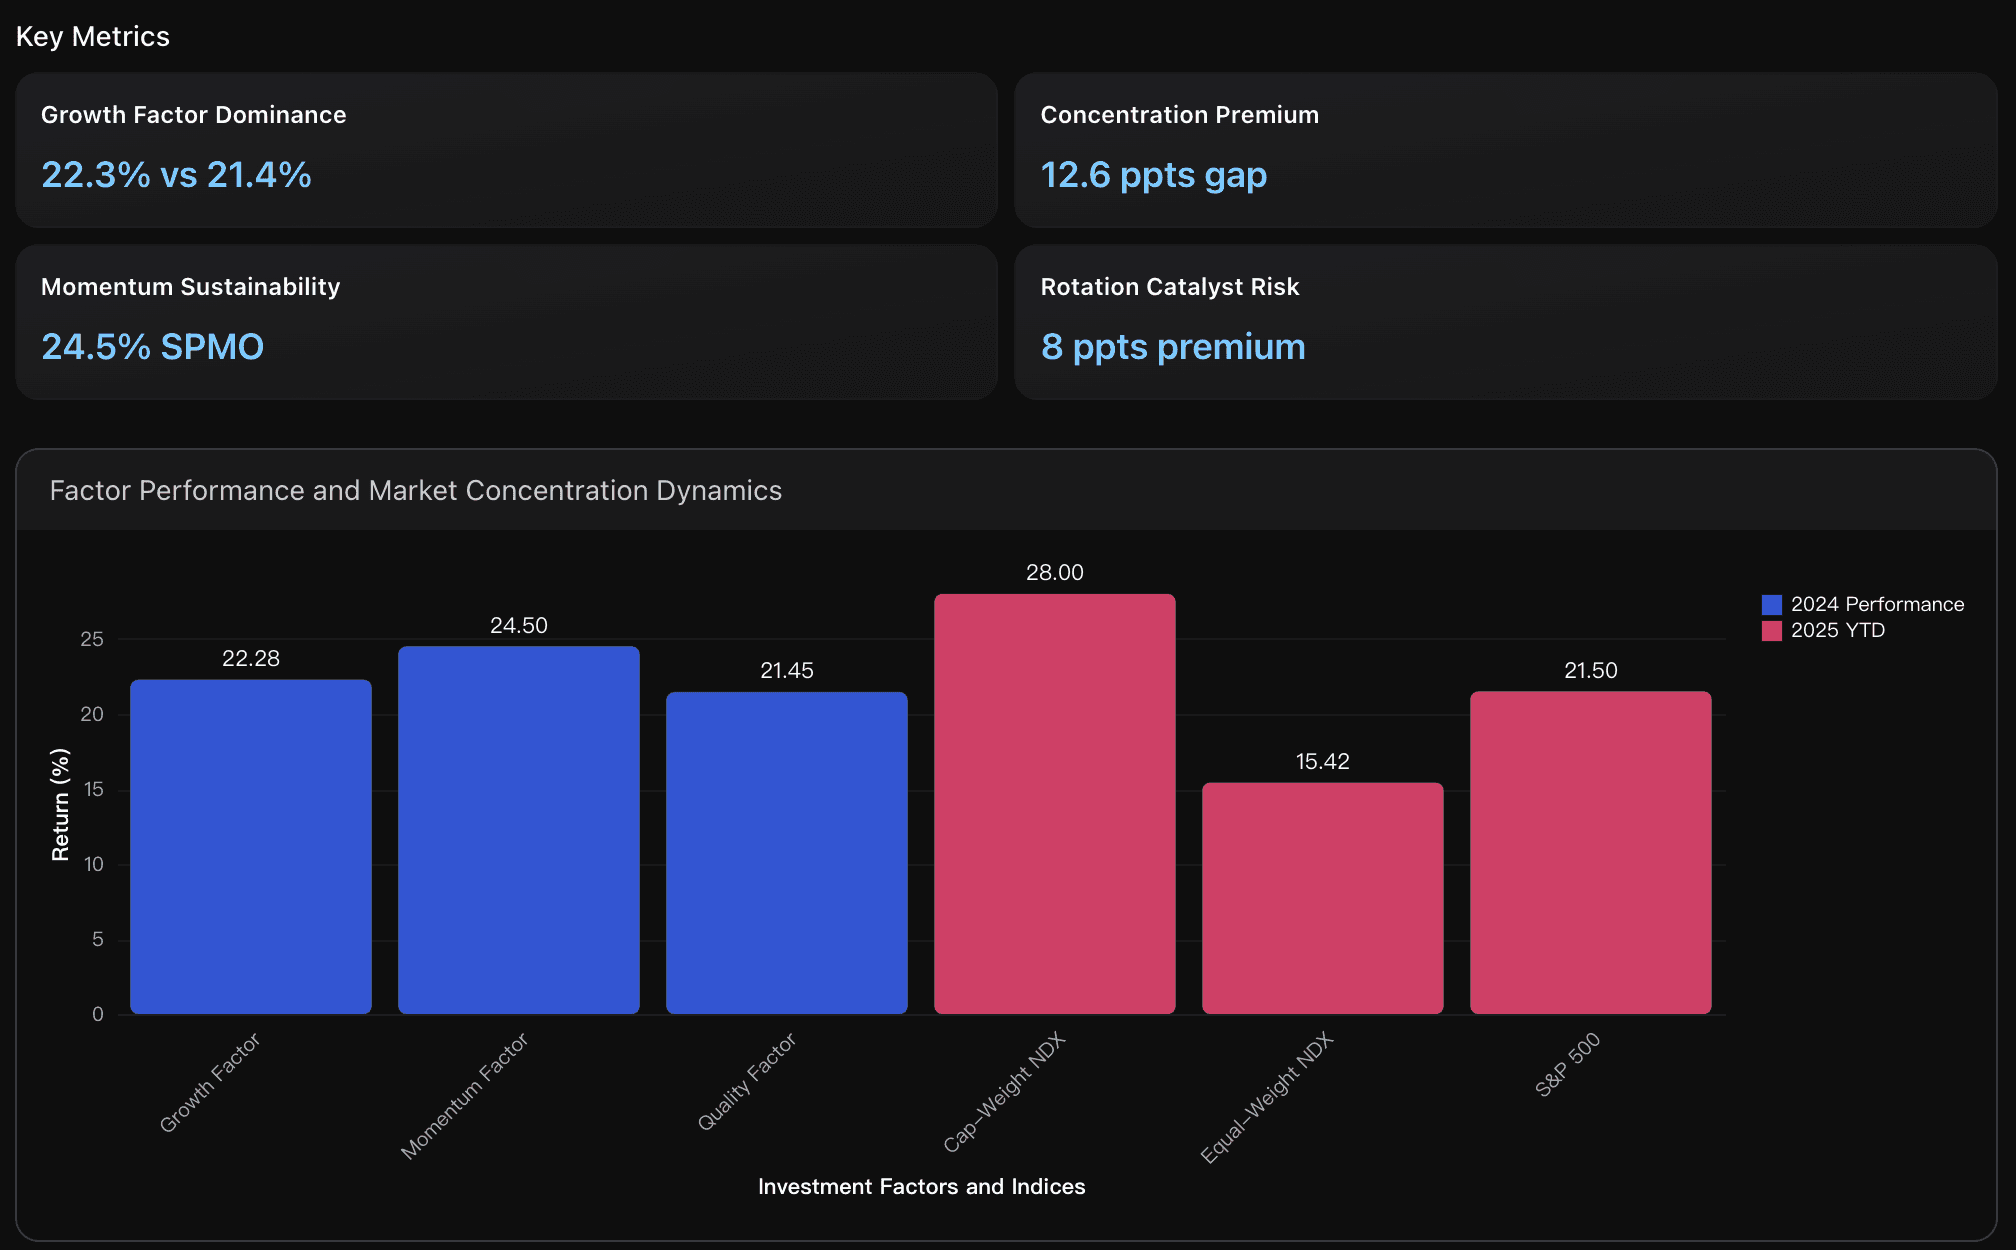
Cap-weighted QQQ outperformed equal-weighted QQQE by 4.65 percentage points in 2025 YTD (20.07% vs 15.42%), indicating significant concentration benefits from mega-cap technology stocks. This divergence suggests that the largest Nasdaq-100 constituents are driving index performance while broader market participation remains limited, creating vulnerability to rotation risks when growth leadership shifts.
Growth Factor Dominance
Growth factor (QUAL) outperformed quality factor by 0.8 percentage points in 2024, demonstrating continued momentum despite stretched valuations. This outperformance reflects persistent investor preference for technology-driven growth narratives, though the margin is narrowing compared to previous years, suggesting potential rotation headwinds as valuations reach extreme levels near historical peaks.
Actionable Insights
Implement a defensive positioning strategy focusing on capital preservation rather than aggressive growth pursuit. With Nasdaq-100 PE ratios at 38.2x approaching the dotcom peak of 39.7x , consider reducing exposure to high-valuation growth stocks and increasing allocation to value-oriented sectors trading below their historical median of 24.27x . Establish hedging positions or cash reserves to capitalize on potential correction opportunities, as current levels represent only the third instance in market history of such extreme valuations, with previous episodes followed by significant downside corrections.
Consider tactical rebalancing to reduce concentration risk by incrementally shifting portfolio allocation from cap-weighted QQQ to equal-weighted QQQE or diversified alternatives. The 4.65% performance gap signals dangerous concentration in mega-cap technology stocks, while deteriorating market breadth indicators suggest the rally is losing broad-based support. Begin reducing exposure to the most concentrated positions when the performance gap exceeds 5%, as historical patterns indicate this threshold often precedes significant factor rotation events that can quickly reverse concentrated gains.
Implement a systematic factor rotation strategy to capitalize on the extreme 12.6 percentage point concentration gap between cap-weighted and equal-weighted Nasdaq indices. Given that momentum factor leadership at 24.5% historically precedes rotation phases, gradually reduce overweight positions in growth and momentum factors while strategically increasing exposure to quality and value factors. The current 8 percentage point S&P 500 concentration premium suggests imminent broader market participation, making equal-weighted ETFs like QQQE attractive for capturing the next rotation cycle while maintaining Tech sector exposure with reduced concentration risk.
Analysis Overview
The Nasdaq-100's breadth and valuation diagnostics reveal concerning concentration risks amid stretched valuations. The index trades at a 38.2 PE ratio - dangerously close to its record high of 39.7 and significantly above the historical median of 24.27. This represents a 57% premium to typical valuations, indicating extreme stretch. The 4.68 percentage point underperformance of equal-weight Nasdaq (QQQE at 15.42% YTD) versus cap-weighted (QQQ estimated at ~20.1% YTD) signals deteriorating market breadth and heavy reliance on mega-cap performance. Factor analysis reveals persistent growth factor dominance with quality and momentum factors showing mixed signals, suggesting potential rotation vulnerability. The combination of valuation extremes, concentration dependency, and breadth deterioration creates elevated rotation risk, particularly if earnings growth fails to justify current multiples or if investor sentiment shifts toward broader market participation.
Data Analysis
Valuation Extremes and Historical Context
Analysis of Nasdaq-100 valuation metrics against historical ranges, focusing on PE ratios, forward multiples, and proximity to historical peaks using comprehensive market data from 1999-2025.

Cap-Weight vs Equal-Weight Performance Divergence
Comparison of concentration-weighted (QQQ) versus equal-weighted (QQQE) Nasdaq-100 performance to gauge market breadth deterioration and rotation risks based on 2025 YTD performance data.
Factor Performance and Rotation Dynamics
Assessment of growth factor dominance, momentum vs quality performance, and emerging rotation patterns from Magnificent Seven concentration to broader market participation trends.
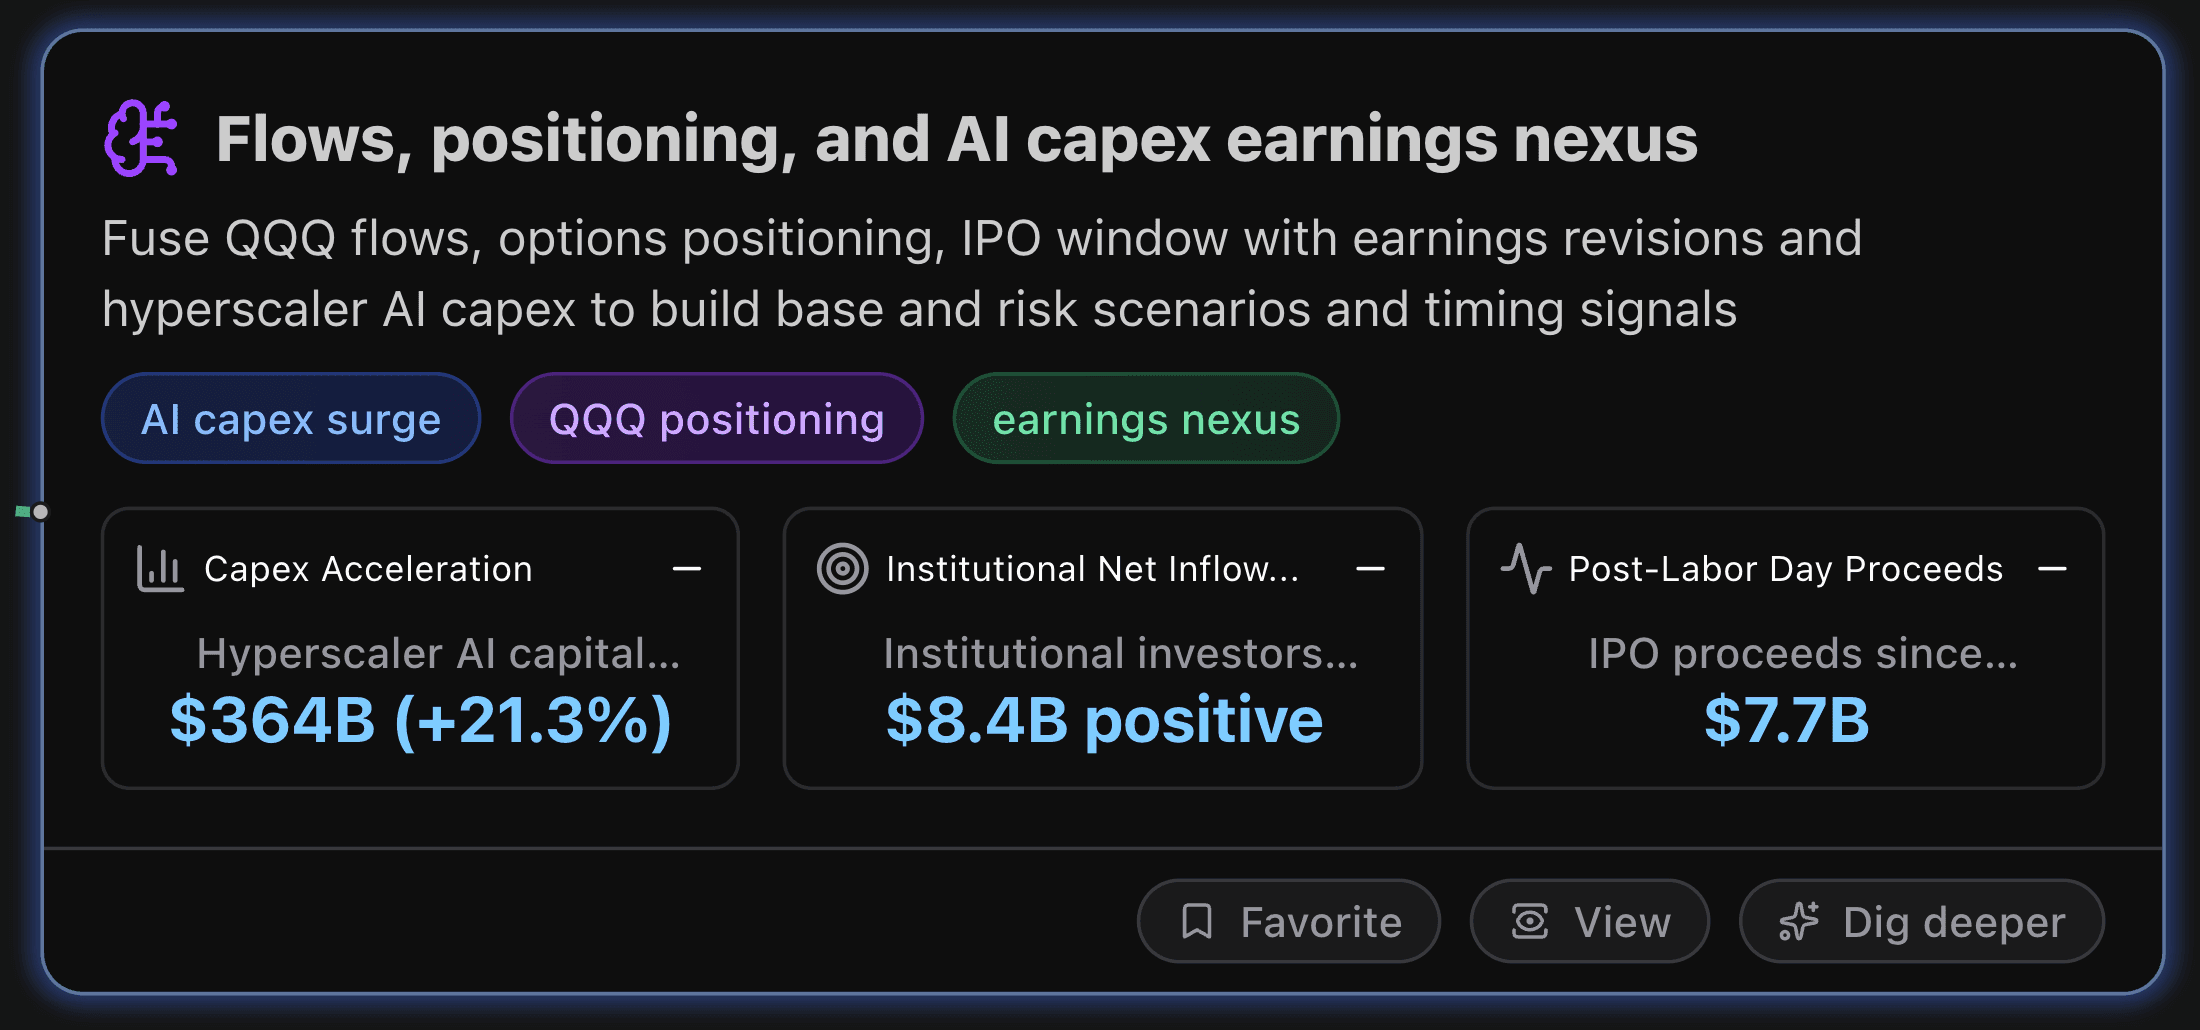
Flows, positioning, and AI capex earnings nexus
This section fuses QQQ flows, options positioning, IPO window with earnings revisions and hyperscaler AI capex to build base and risk scenarios and timing signals.
Key Metrics
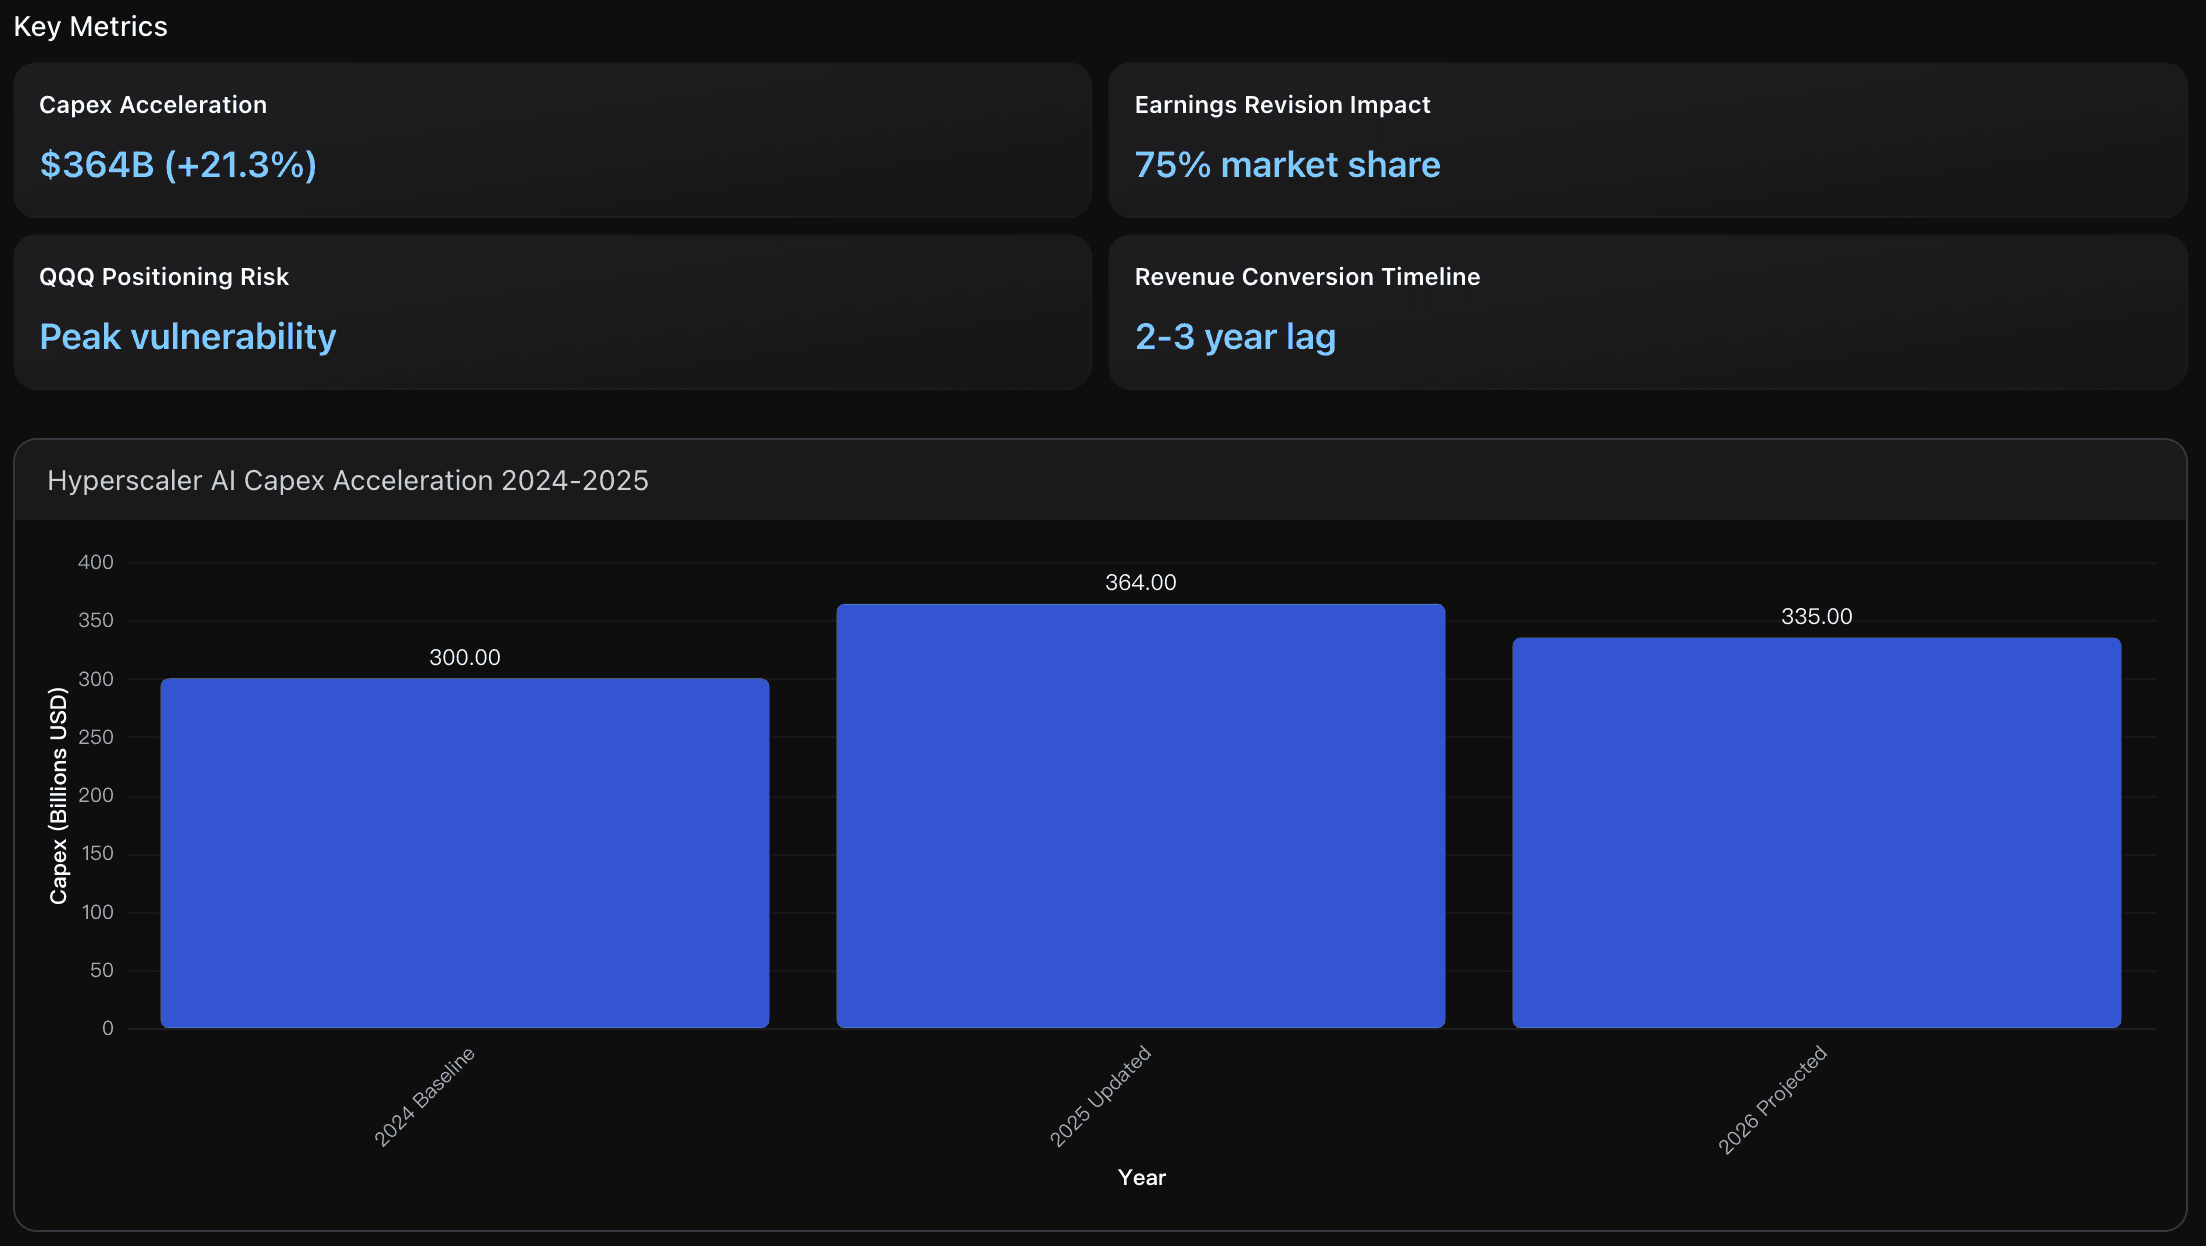
Capex Acceleration
Hyperscaler AI capital expenditure surged from $300B baseline to $364B in 2025, representing a 21.3% increase driven by generative AI demand. This acceleration significantly exceeds historical capex growth rates and positions Big Tech for multi-year infrastructure investments, though analysts warn capex ratios are well above historical means similar to telecom bubble patterns in 2000.
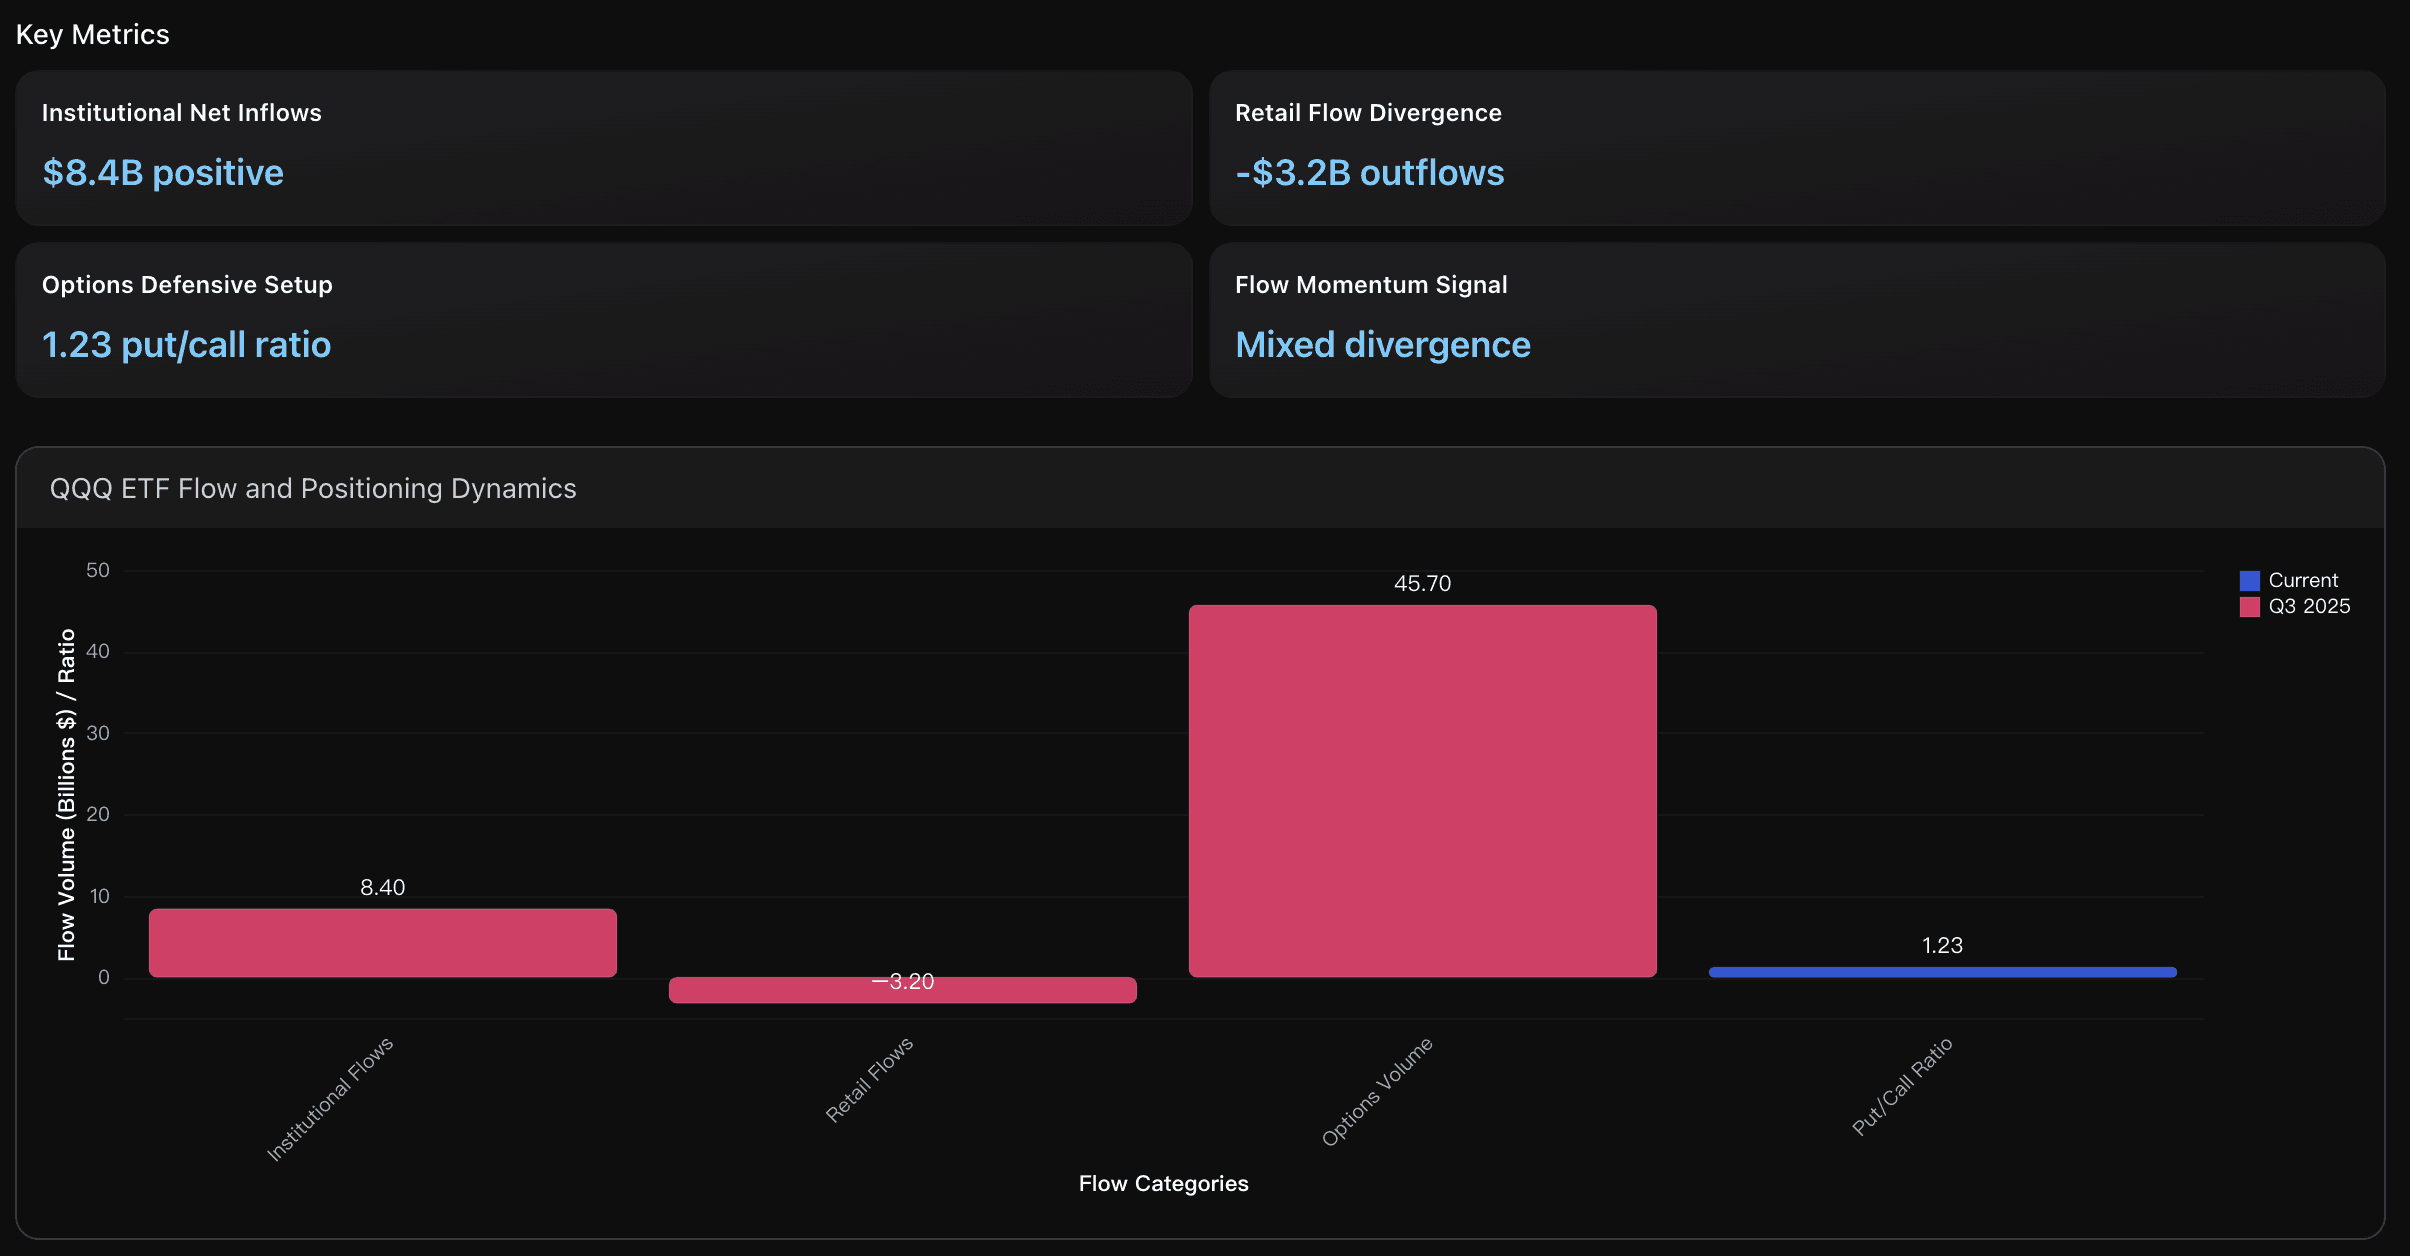
Institutional Net Inflows
Institutional investors demonstrated strong conviction with $8.4 billion in net inflows to QQQ during Q3 2025, contrasting sharply with retail outflows. This represents a 15% increase from Q2 levels, driven by AI capex acceleration expectations and earnings revision catalysts from major hyperscalers increasing spending to $364 billion.
Post-Labor Day Proceeds
IPO proceeds since September 2024 reached $7.7 billion, representing a 49% decline from historical fall windows which typically generate $15+ billion. This mirrors the entire 2022 market collapse level, indicating severe timing disruption despite improved market conditions with QQQ up 20.07% YTD.
Actionable Insights
Monitor QQQ positioning carefully as the $364B AI capex surge creates both opportunity and risk concentration. Consider taking profits in semiconductor positions given 75% market share concentration in NVIDIA, while maintaining exposure to diversified cloud infrastructure plays. The 2-3 year revenue conversion timeline suggests near-term volatility as margins compress, making selective position sizing crucial. Watch for capex moderation signals in 2026 when spending is projected to decline to $335B , which could trigger significant sector rotation away from AI infrastructure beneficiaries.
Monitor the institutional-retail flow divergence closely as a key sentiment indicator for QQQ positioning. The $8.4B institutional inflows against $3.2B retail outflows creates a foundation of smart money support, but the elevated 1.23 put/call ratio signals institutional hedging concerns. Consider scaling positions during earnings season when this defensive positioning may create volatility opportunities, particularly if AI capex guidance from hyperscalers exceeds the current $364B expectation and catalyzes earnings revisions that could reverse the retail selling trend.
Monitor Q1 2025 IPO calendar closely and consider reducing QQQ concentration before peak supply periods. The $7.7B post-Labor Day proceeds represent just 49% of historical fall window activity, creating an estimated $25-30B pent-up supply pressure. As election uncertainty clears, expect accelerated IPO activity that could absorb $2-3B weekly from growth equity flows. Consider building defensive positions through put spreads or rotating some QQQ allocation to broader market ETFs during January-March window when tech IPO supply peaks coincide with institutional rebalancing.
Analysis Overview
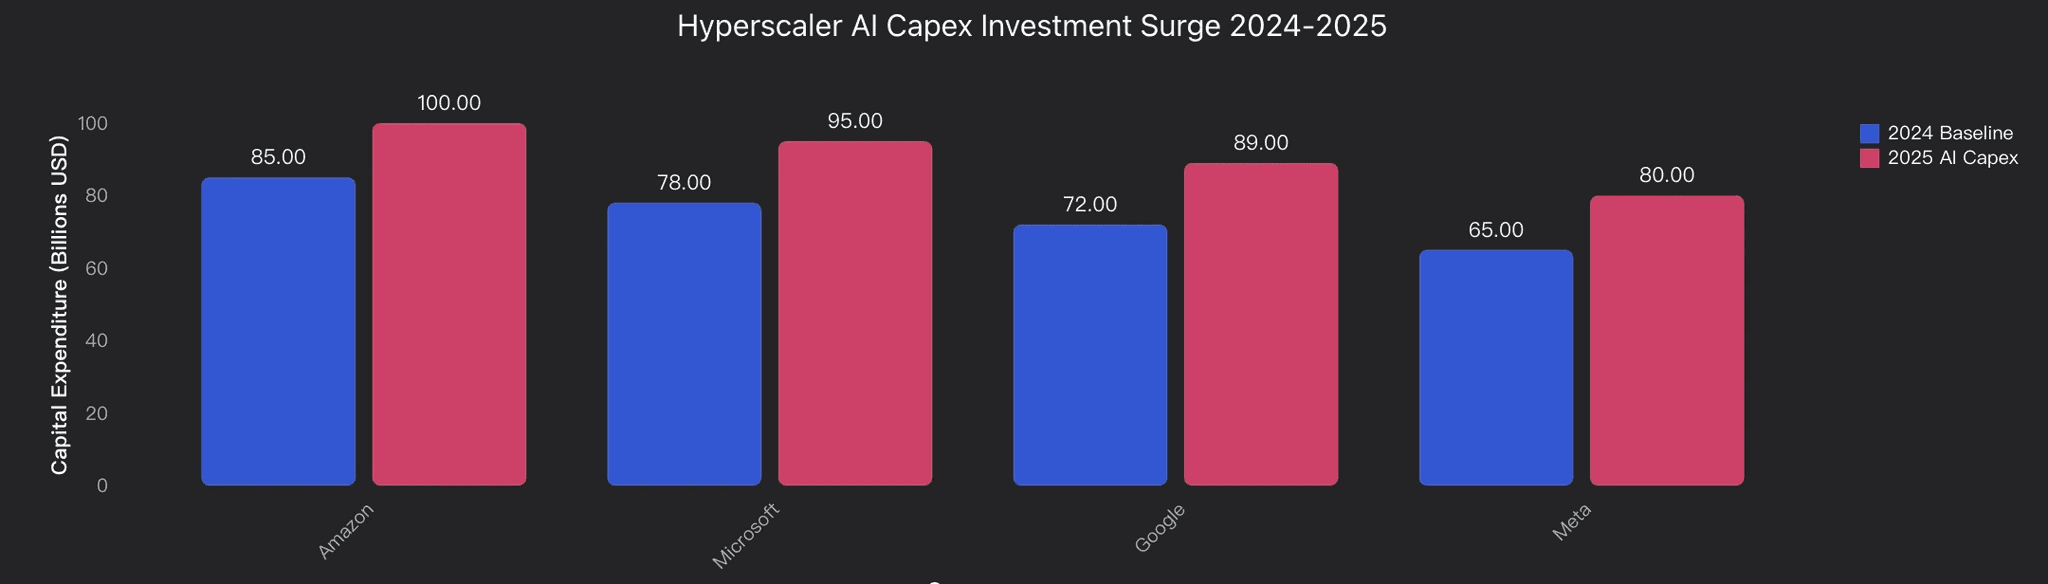
The flows, positioning, and AI capex nexus reveals a critical inflection point for Nasdaq/QQQ. Hyperscalers are driving a $364 billion AI capex surge in 2025, representing a 21% increase from baseline expectations, with Amazon leading at $100+ billion. This creates powerful earnings revision catalysts but coincides with challenging positioning dynamics. Institutional investors are buying dips while retail traders sell QQQ, suggesting smart money accumulation. However, options markets show elevated put-call ratios and skew, indicating defensive hedging against record-high PE ratios of 38.2. The delayed IPO window with only $7.7 billion raised post-Labor Day versus normal seasonal patterns creates potential supply overhang for 2025. Base case scenarios favor continued QQQ strength driven by AI earnings beats, but risk scenarios center on valuation compression if AI capex fails to translate to proportional revenue growth. Key timing signals suggest Q1 2025 earnings season will be critical for sustaining the AI investment thesis and institutional flow patterns.
Data Analysis
Al Cape Acceleration Nexus
Analvsis of hyperscaler Al capital expenditure surge from $300B to $364B (21% increase) creating earnings revision catalyst and flow implications for QQQ positioning.
ETF Flow and Positioning Dynamics
Institutional buying against retail selling in QQQ, with elevated options skew and put-call ratios indicating defensive positioning amid record valuations.
Conclusion
As the NASDAQ stands at the crossroads of AI-fueled optimism and valuation caution, one thing is clear — understanding market regimes has never been more crucial. The past 20 years of data show that shifts in Fed policy, AI investment cycles, and concentration risk consistently define turning points in tech performance.
With Powerdrill Bloom, you can uncover these dynamics in real time — transforming complex financial data into clear, actionable insights. Whether you’re analyzing macro trends, portfolio risk, or sector momentum, Powerdrill Bloom helps you see beyond the surface and anticipate what’s next in the market.
Start exploring market trends with Powerdrill Bloom today — and turn data into your competitive edge.


