Why Your Food Always Comes Late — An analysis of food delivery times and influencing factors
Ma Li
Dec 24, 2024
Have you ever found yourself constantly checking the clock, wondering why your food delivery is taking longer than expected? It's not just the distance from the restaurant that dictates when your meal will arrive.
In this eye-opening blog, we delve deep into the myriad factors that influence food delivery times. From the unpredictable weather conditions to peak traffic hours, and even the operational speed of the restaurant itself—many elements play a critical role in the timing of your food delivery.
Whether you're a casual diner or a delivery service aficionado, this exploration will provide you with fascinating insights and a greater appreciation for the complex dance of logistics that brings your favorite dishes to you.
Data preparations
In the following analysis, we use real-world data downloaded from Kaggle. The dataset contains the following columns:
Order_ID: Unique identifier for each order.Distance_km: The delivery distance in kilometers.Weather: Weather conditions during the delivery, including Clear, Rainy, Snowy, Foggy, and Windy.Traffic_Level: Traffic conditions categorized as Low, Medium, or High.Time_of_Day: The time when the delivery took place, categorized as Morning, Afternoon, Evening, or Night.Vehicle_Type: Type of vehicle used for delivery, including Bike, Scooter, and Car.Preparation_Time_min: The time required to prepare the order, measured in minutes.Courier_Experience_yrs: Experience of the courier in years.Delivery_Time_min: The total delivery time in minutes (target variable).
Tool preparations
The data analysis tool we use is Powerdrill. The following data report is generated by using its AI Report Generator feature.
Now, let's discover together what's really happening behind the scenes and how it affects the clock ticking on your next meal delivery.
Food delivery times in different whether conditions
Analysis of Average Delivery Time
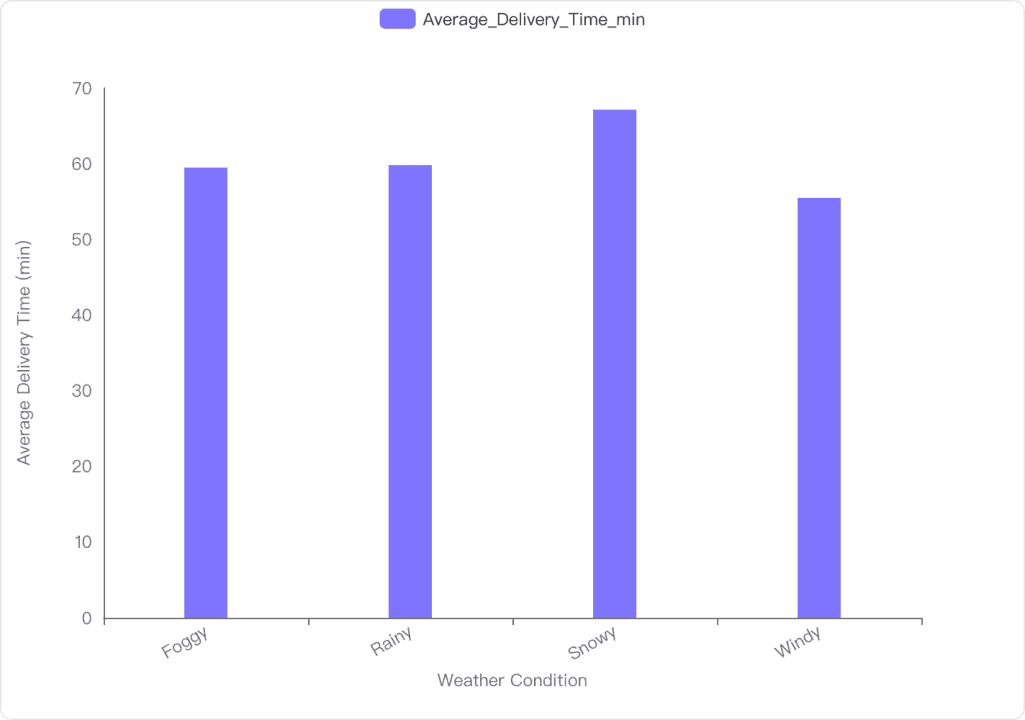
Clear Weather: The average delivery time is approximately 53.08 minutes, the shortest among all conditions.
Foggy Weather: The average delivery time increases to about 59.47 minutes.
Rainy Weather: Similar to foggy conditions, the average delivery time is around 59.79 minutes.
Snowy Weather: This condition has the longest average delivery time at 67.11 minutes.
Windy Weather: The average delivery time is approximately 55.46 minutes, shorter than foggy and rainy conditions but longer than clear weather.
Visualization Insights
Bar Chart Representation: The chart clearly shows that snowy weather significantly increases delivery time compared to other conditions.
Comparison: Clear weather results in the fastest deliveries, while snowy conditions cause the most delays.
Conclusion and Insights
Impact of Weather: Weather conditions have a noticeable impact on delivery times, with snowy weather causing the most significant delays.
Operational Considerations: Businesses should prepare for longer delivery times during adverse weather conditions, especially snow, to manage customer expectations effectively.
Food delivery times across different times of the day
Statistical Analysis
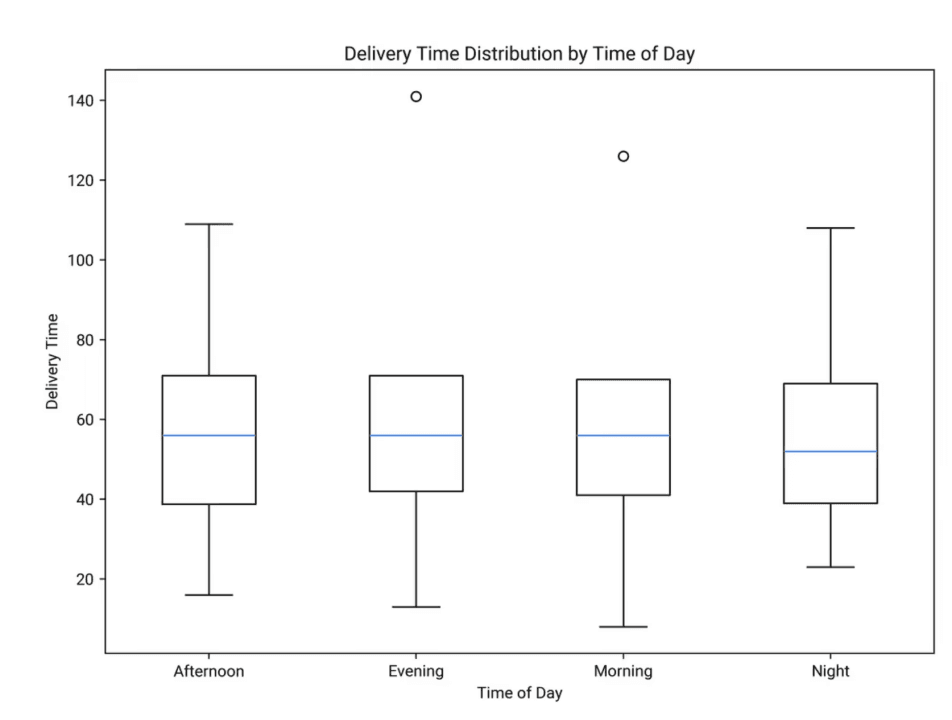
Afternoon: The average delivery time is approximately 56.08 minutes, with a standard deviation of 21.09 minutes. The delivery times range from 16 to 109 minutes.
Evening: The average delivery time is about 57.48 minutes, with a standard deviation of 22.18 minutes. The range is from 13 to 141 minutes.
Morning: The average delivery time is around 56.12 minutes, with a standard deviation of 21.54 minutes. Times range from 8 to 126 minutes.
Night: The average delivery time is approximately 55.21 minutes, with a standard deviation of 21.43 minutes. The range is from 23 to 108 minutes.
Visualization Insights
Box Plot Overview: The box plot shows the spread and central tendency of delivery times for each time of day.
Outliers: There are noticeable outliers in the evening and morning time slots, indicating some exceptionally long delivery times.
Conclusion and Insights
Consistency Across Times: Delivery times are relatively consistent across different times of the day, with means ranging from 55 to 57 minutes.
Evening Variability: The evening has the highest variability and the presence of outliers, suggesting potential delays during this period.
Traffic level impacts on food delivery times
Average Delivery Time by Traffic Level
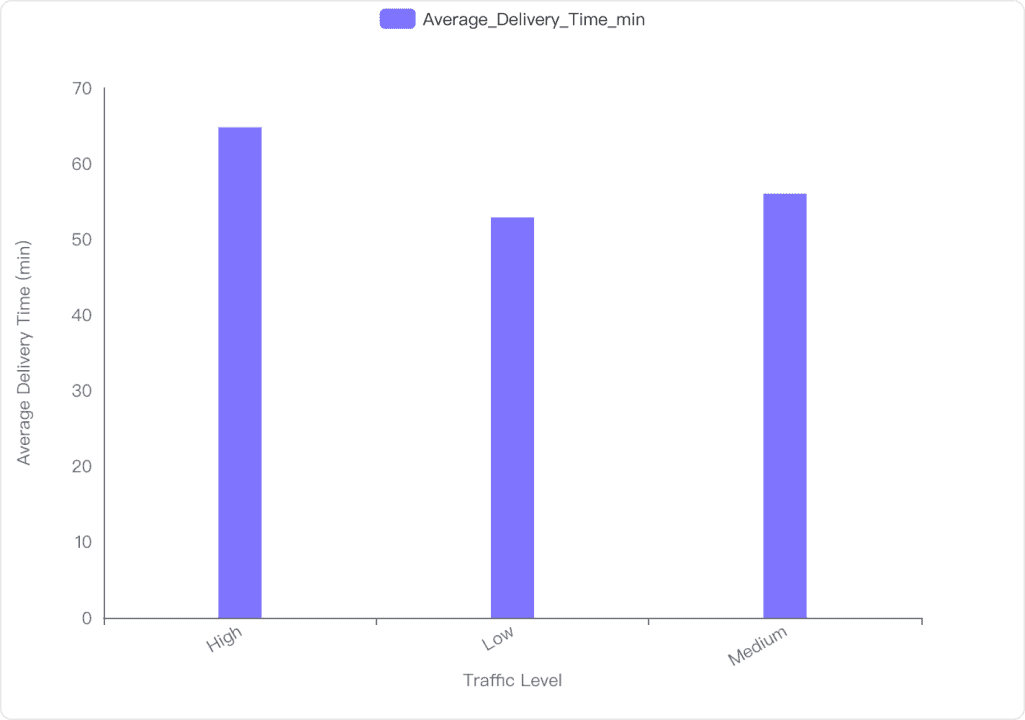
High Traffic: The average delivery time is approximately 64.81 minutes.
Medium Traffic: The average delivery time is approximately 56.02 minutes.
Low Traffic: The average delivery time is approximately 52.89 minutes.
Visualization of Traffic Impact
The bar chart illustrates that higher traffic levels correspond to longer delivery times.
Low traffic conditions result in the shortest delivery times, while high traffic leads to the longest delivery times.
Conclusion and Insights
Traffic Level Impact: There is a clear correlation between traffic levels and delivery times. As traffic increases, delivery times also increase.
Operational Considerations: Businesses should consider traffic conditions when estimating delivery times to improve customer satisfaction and operational efficiency.
Food delivery times vary by vehicle type
Average Delivery Time by Vehicle Type
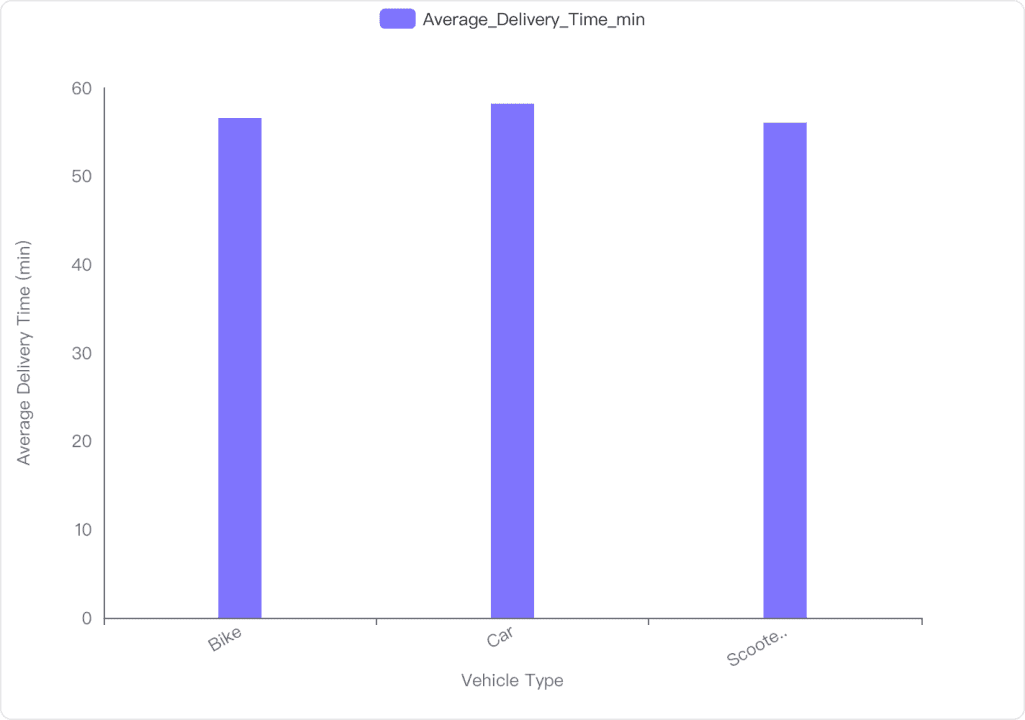
Bike: The average delivery time is approximately 56.57 minutes.
Car: The average delivery time is the highest at 58.2 minutes.
Scooter: The average delivery time is the lowest at 56.05 minutes.
Visualization of Delivery Times
Bar Chart: The chart shows that cars have the longest average delivery time, while scooters have the shortest.
Conclusion and Insights
Impact of Vehicle Type: The type of vehicle does affect delivery time. Cars tend to have longer delivery times compared to bikes and scooters.
Efficiency: Scooters are the most efficient in terms of delivery time, suggesting they might be preferable for quicker deliveries
Relationship between courier experience and delivery time
Correlation Analysis
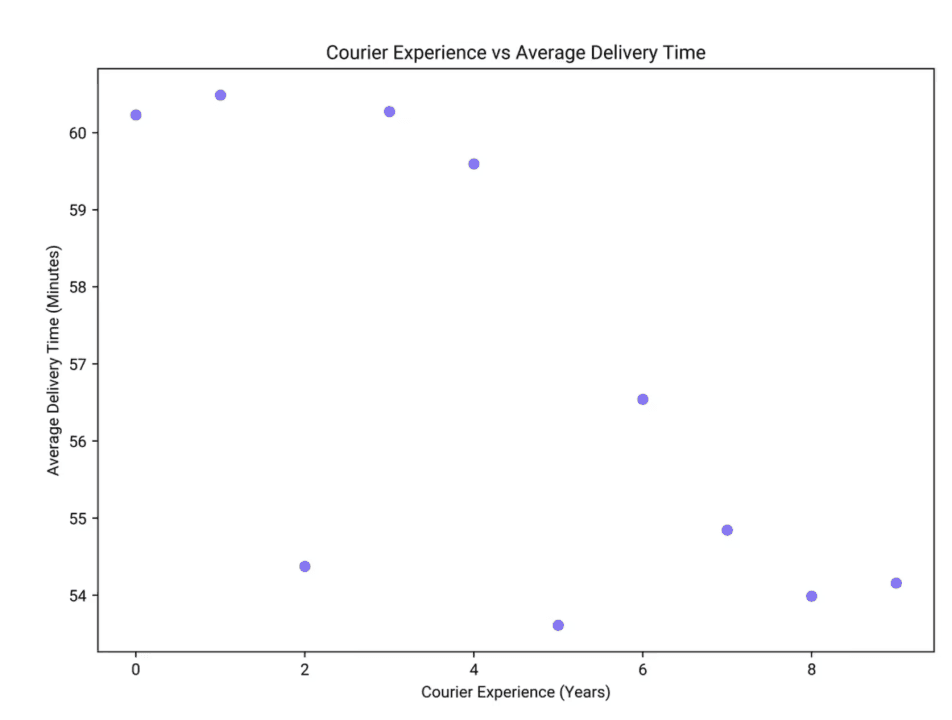
Correlation Value: The correlation between courier experience (in years) and delivery time (in minutes) is -0.09. This indicates a very weak negative correlation, suggesting that as courier experience increases, delivery time slightly decreases, but the relationship is not strong.
Data Overview
Courier Experience Range: The data includes couriers with experience ranging from 0 to 9 years.
Average Delivery Time: The average delivery time ranges from 53.61 to 60.49 minutes.
Visualization Insights
Trend Observation: The scatter plot shows a slight downward trend, indicating that more experienced couriers tend to have slightly faster delivery times. However, the spread of data points suggests variability and a weak overall trend.
Conclusion and Insights
Weak Negative Correlation: There is a weak negative correlation between courier experience and delivery time, suggesting that experience may contribute to slightly faster deliveries, but other factors likely play a significant role.
Potential for Further Analysis: Additional variables or a larger dataset might be needed to better understand the factors influencing delivery times.
How preparation time affects overall delivery speed
Correlation and Regression Analysis
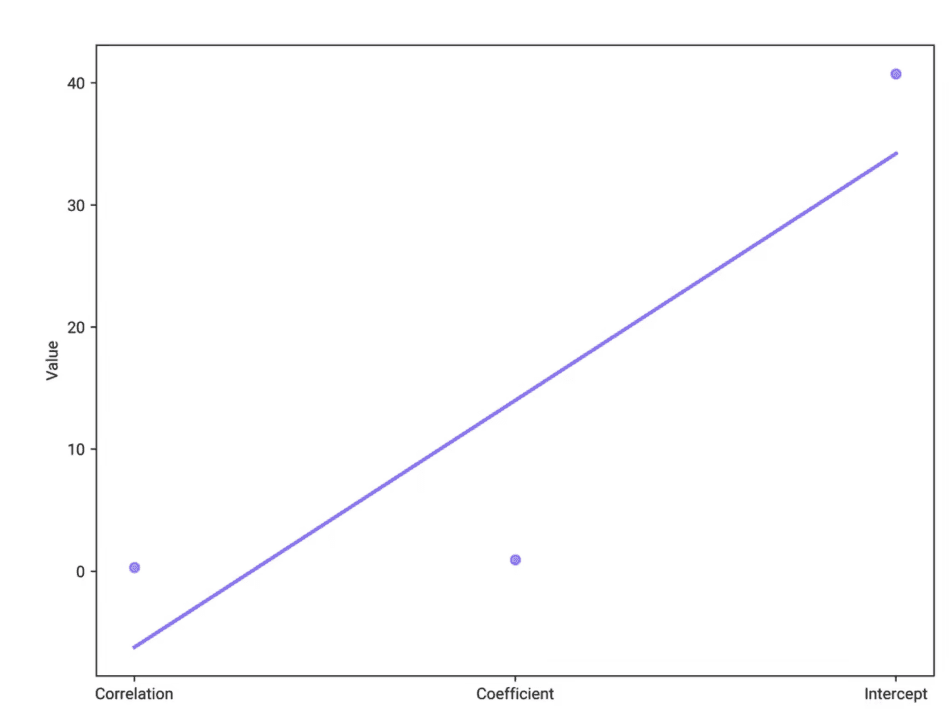
Correlation: The correlation between preparation time and delivery time is 0.31, indicating a moderate positive relationship.
Coefficient: The regression coefficient is 0.94, suggesting that for each additional minute of preparation time, the delivery time increases by approximately 0.94 minutes.
Intercept: The intercept is 40.74, representing the estimated delivery time when preparation time is zero.
Visualization
Scatter Plot with Regression Line: The plot illustrates the relationship between preparation time and delivery time. The regression line shows a positive slope, confirming the positive influence of preparation time on delivery time.
Conclusion and Insights
Moderate Influence: Preparation time has a moderate positive influence on delivery time, as indicated by the correlation and regression analysis.
Predictive Model: The regression model can be used to predict delivery times based on preparation times, with a reasonable degree of accuracy.


