
Introduction
In the AI era, data isn't just a byproduct of operations — it's the foundation for innovation, decision-making, and competitive advantage. But before building models or drawing conclusions, one crucial step must come first: exploration.
Data exploration is how teams make sense of their raw information, identify patterns, detect outliers, and form the right hypotheses. It's the stage where questions are born, trends are discovered, and insights begin to take shape. Yet with growing data volumes and increasingly complex sources, traditional exploration methods are no longer enough.
In 2025, AI is transforming the way we interact with data. Generative models, intelligent agents, and automation are accelerating what used to take hours into seconds. Whether you're a data analyst, product manager, engineer, or business leader, modern data exploration tools now help you think faster, ask better questions, and get smarter answers — all powered by AI.
In this post, we highlight the top data exploration tools in 2025 that are reshaping how we understand and interact with data in the AI era.
What Makes a Great Data Exploration Tool in the AI Era?
The definition of a "good" data exploration tool has evolved. In 2025, it's not just about tables, charts, or SQL editors anymore — it's about intelligence, speed, and accessibility. Here are the key qualities that make a tool stand out today:
AI-Native Capabilities
The best tools go beyond static dashboards — they leverage large language models (LLMs) to summarize trends, generate visualizations, and recommend next steps. This drastically reduces the effort needed to interpret data.
Support for Large and Complex Datasets
From unstructured text to real-time events and multimodal data, modern tools must handle variety and volume with ease. In-memory processing, columnar engines, and vector support are becoming standard.
Interactivity and Visualization
Exploration means curiosity. Tools must offer fluid interactivity — filtering, zooming, slicing — combined with beautiful, customizable visual outputs.
Collaboration and Sharing
Insights are meant to be shared. The best platforms enable seamless collaboration across teams, whether through real-time editing, comments, or embeddable apps.
These criteria guided our selection of tools below — each one designed to empower smarter, faster data exploration in the AI-first world.
Now, let's dive into the best data exploration tools in 2025.
1. Powerdrill Bloom
Powerdrill Bloom is an AI-first data exploration canvas designed to make data insights feel intuitive—like sketching ideas on a whiteboard, but with AI agents powering the analysis. Simply upload your data file, and Bloom’s intelligent agents instantly clean, analyze, and surface three guided exploration paths. Within seconds, you’re presented with visual insights, natural-language summaries, and interactive exploration cards that flex with your curiosity.
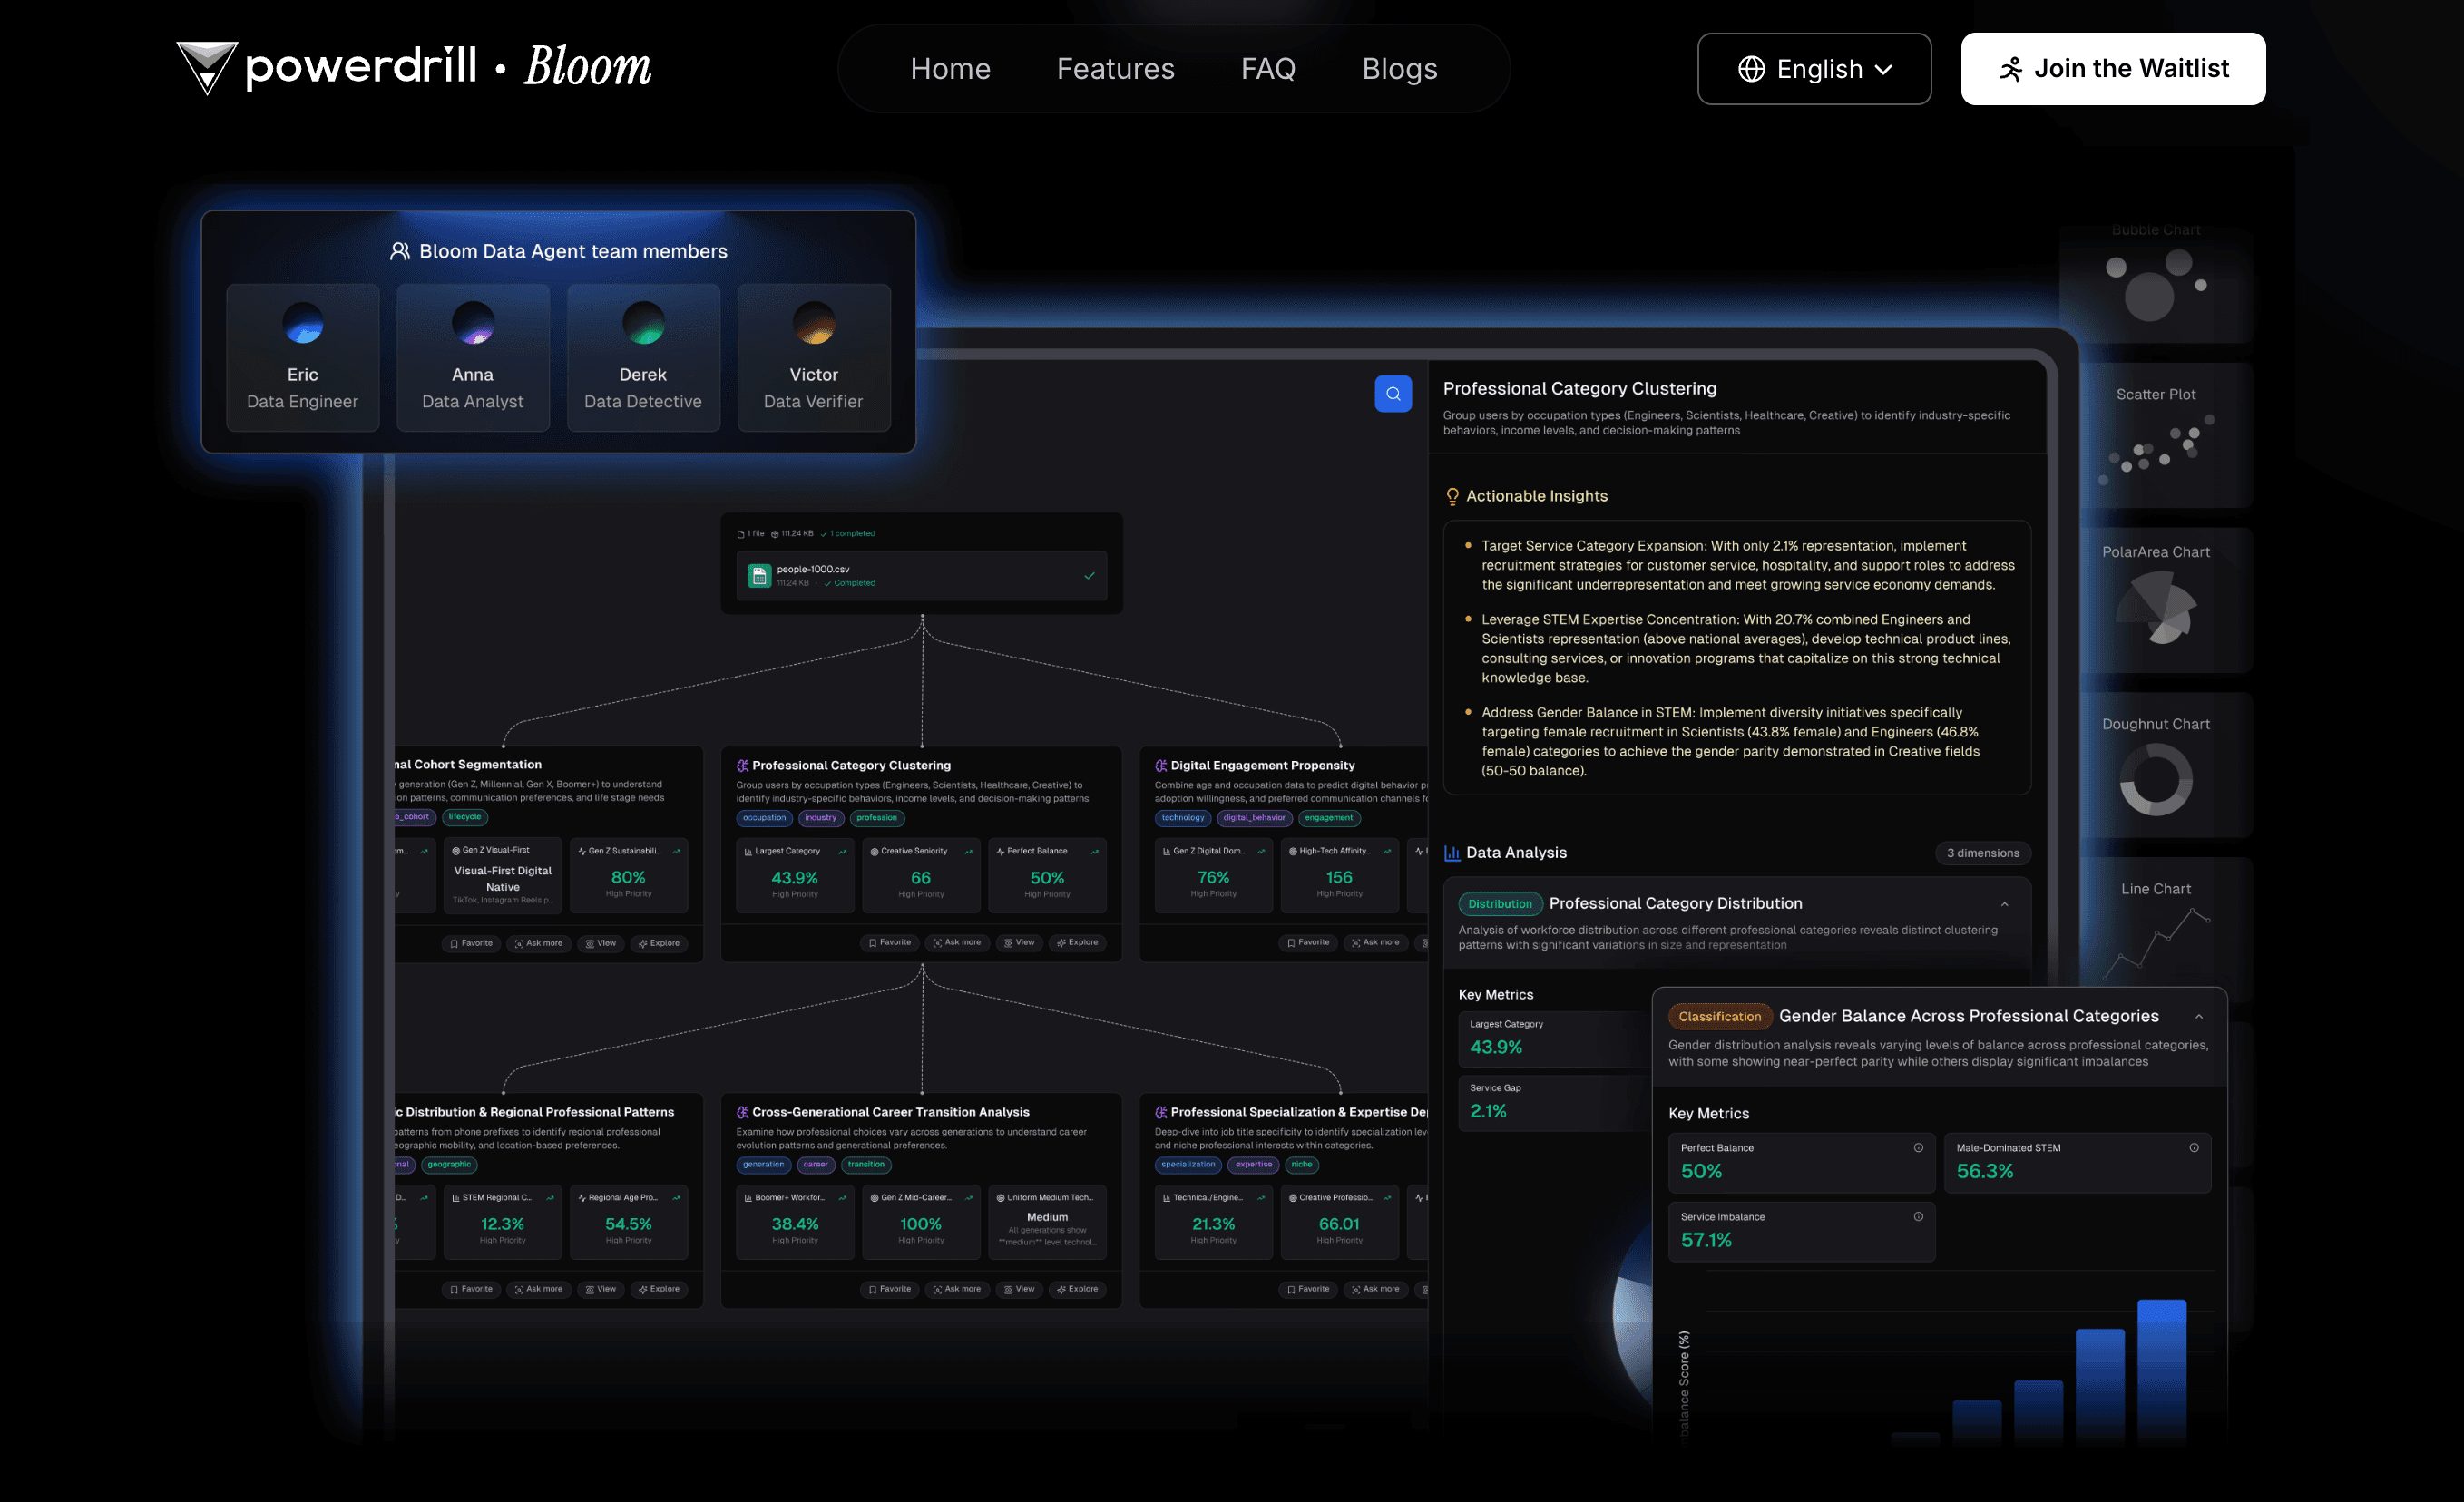
Key Features
Smart AI Canvas: Bloom auto-generates charts, text insights, and cards you can freely move, group, or build on—creating a truly visual, modular exploration interface.
Natural Language Interactions: No need for formulas or scripting—just ask questions like “Which segment saw the highest growth?” and get instant answers with visuals.
Automated Presentation Generation: After exploring, Bloom converts your journey into a fully formatted slide deck—with insights and visuals included—so you go from analysis to storytelling in one workflow.
Multi-Agent Collaboration: A cohort of AI agents clean your data, detect trends, visualize patterns, and verify accuracy—bringing trust and depth to every insight.
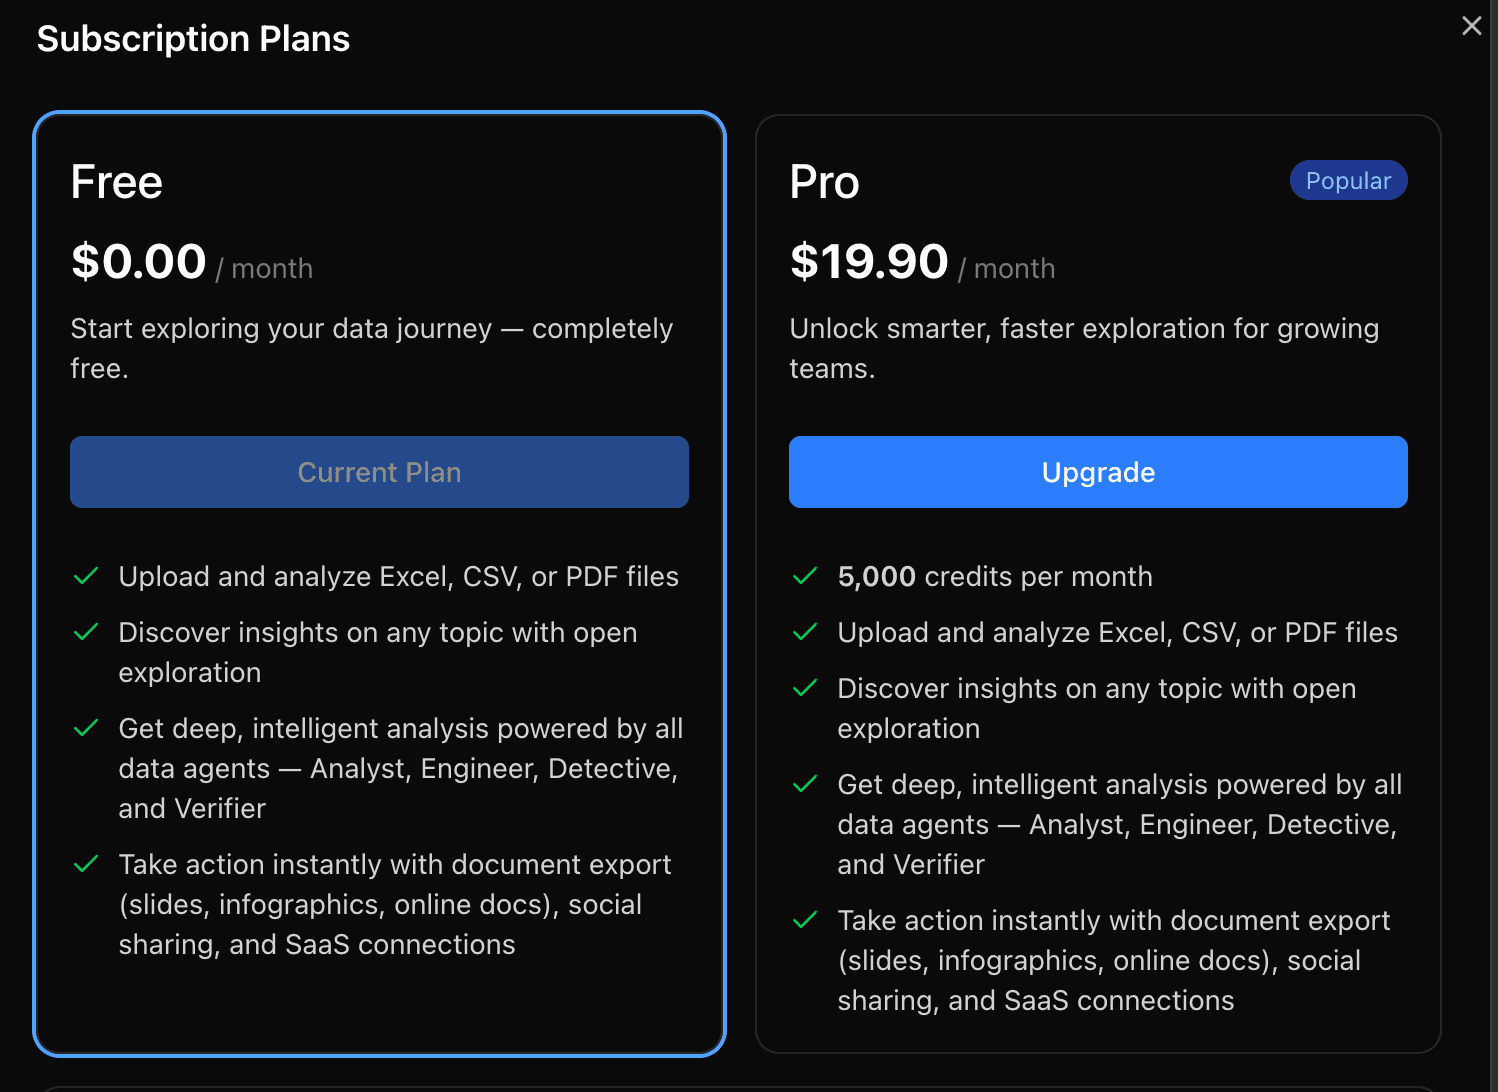
Pricing
Powerdrill Bloom offers simple, usage-based pricing with a Free plan to get started and a Pro plan for advanced AI exploration and higher productivity.
Ideal For
Business analysts and product managers who want instant, no-code insights.
Teams seeking seamless transitions from analysis to presentation, without manual charting.
Non-technical users exploring revenue, customer behavior, sentiment, or multilingual datasets.
Anyone looking for an accessible, AI-assisted data exploration tool that’s both powerful and intuitive.
Why it's great in 2025
As more organizations demand faster, more intuitive, and AI-assisted analytics, Bloom hits the sweet spot—empowering both technical and non-technical users to uncover trends, validate decisions, and share insights effortlessly.
2. DuckDB (with Ibis & Polars)
DuckDB is a high-performance in-process SQL OLAP database optimized for analytical queries. Paired with Ibis (a unified Python dataframe-SQL interface) and Polars (a lightning-fast DataFrame library), this modern open-source stack powers blazing-fast data exploration directly in notebooks or apps — no need for a separate database server.
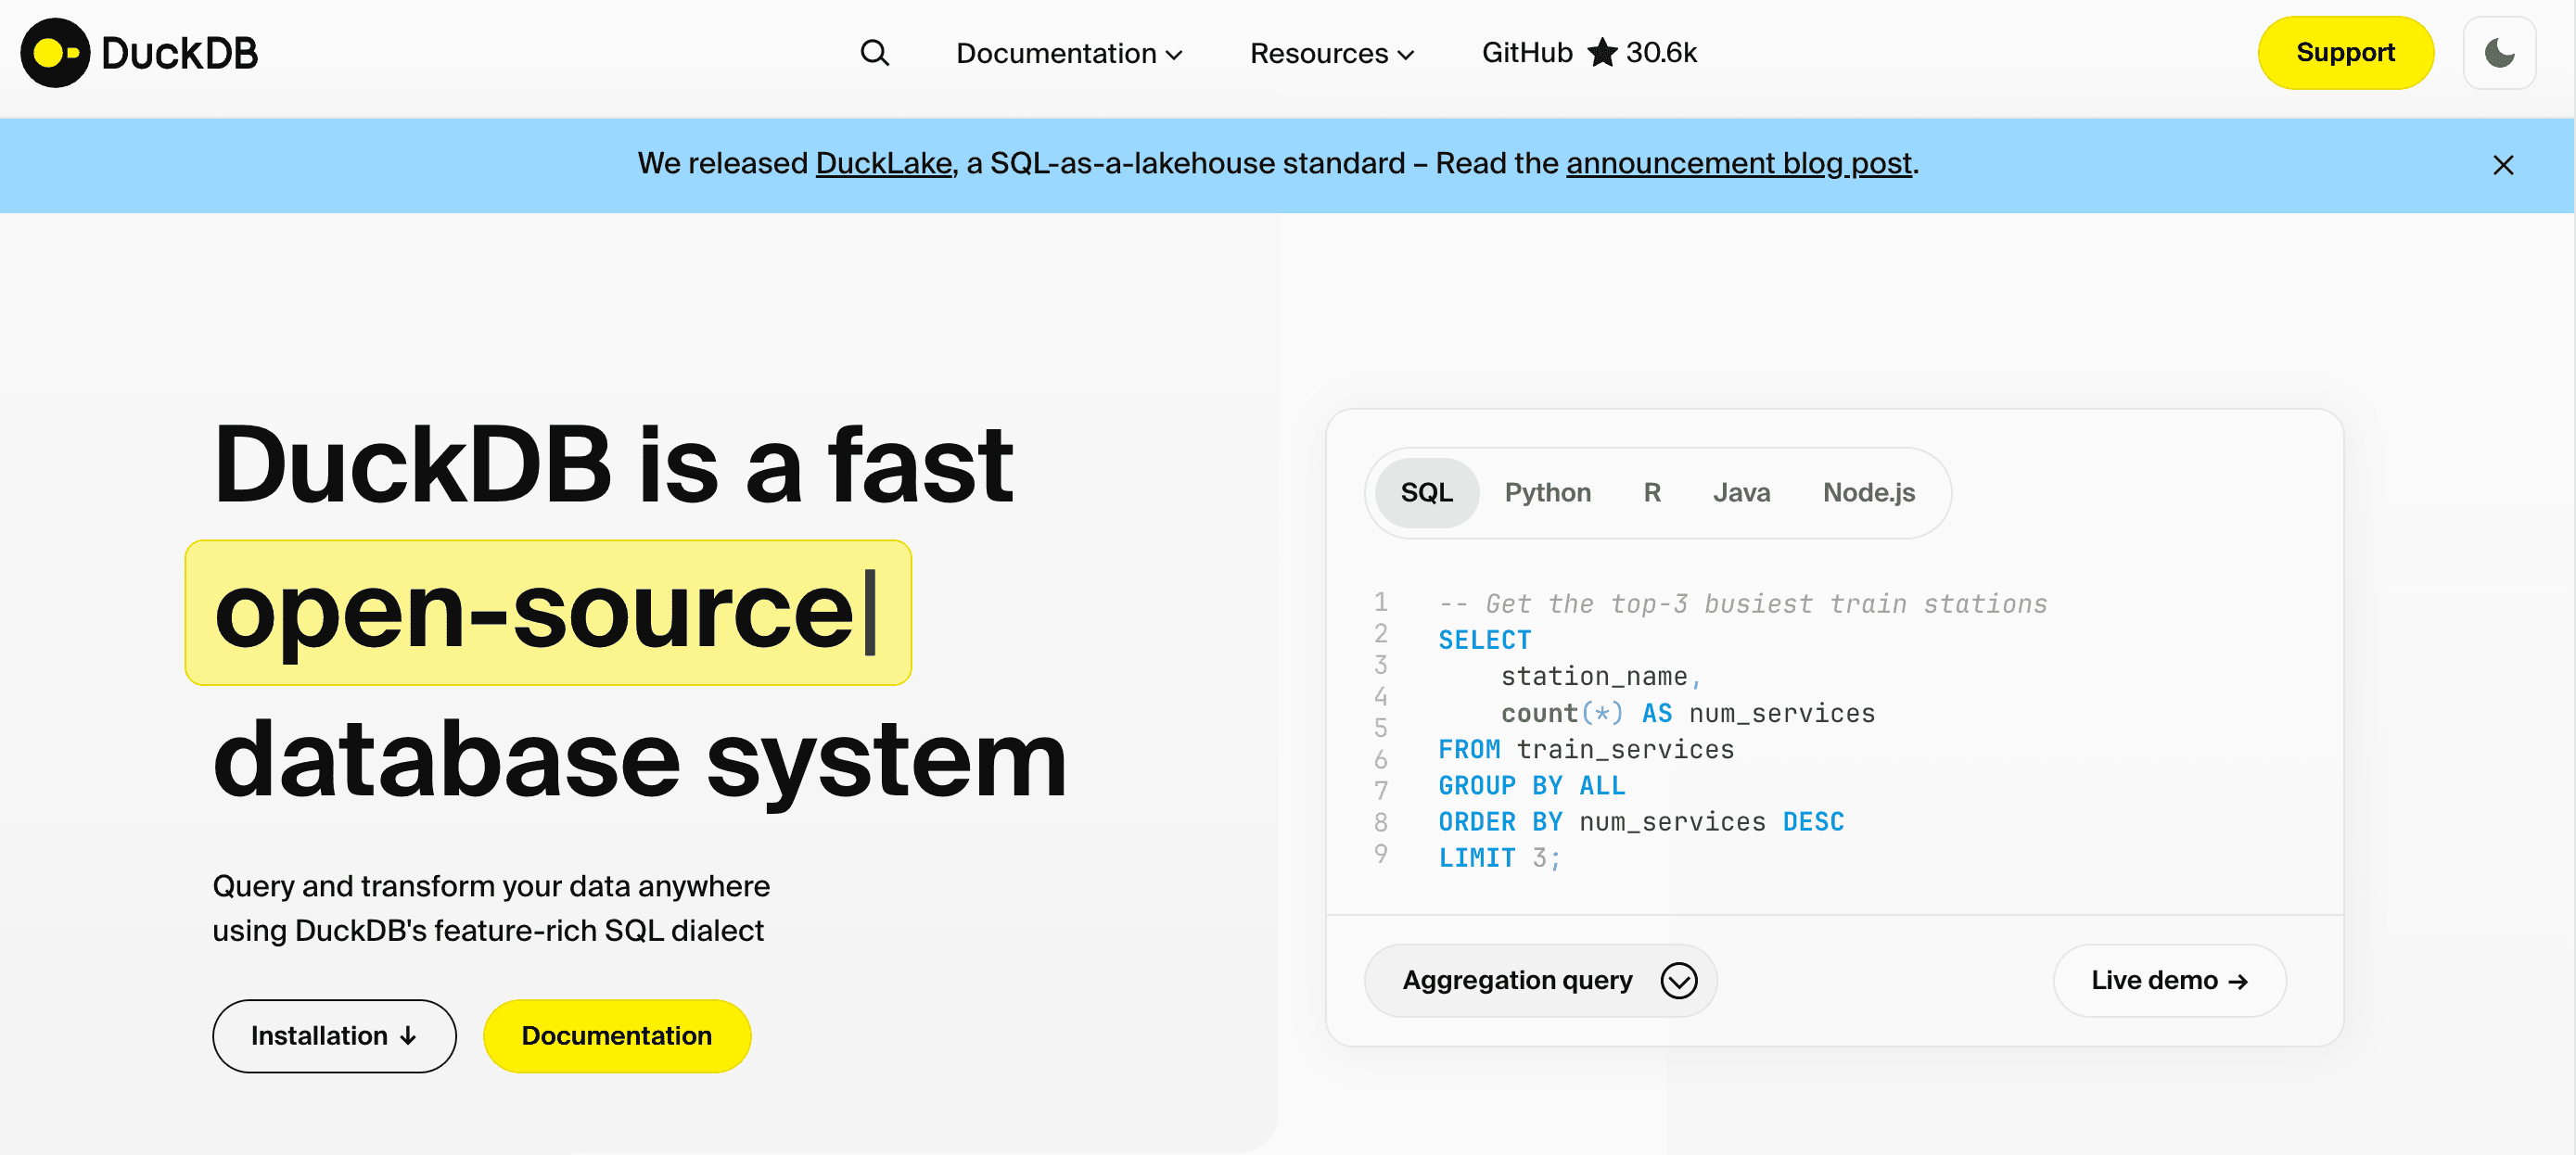
Key Features
In-process OLAP engine with SQL support
Lightning-fast performance on local files (CSV, Parquet, JSON)
Python and Jupyter-native integration
Works seamlessly with Ibis and Polars for hybrid workflows
No server setup or infrastructure dependency
Ideal For
Data engineers, scientists, and technical analysts working with local files or embedded analytics.
Pricing
Free and open-source.
Why it's great in 2025
DuckDB has become the de facto analytical database for Python-native workflows, thanks to its zero-dependency setup and unmatched performance. It's ideal for fast, private, serverless data exploration — especially in LLM agents or notebook environments.
3. Observable
Observable is a reactive notebook platform focused on collaborative data visualization using JavaScript. Designed for teams to build, share, and iterate on data stories, it supports live, interactive exploration with a strong emphasis on D3.js and custom visuals.
Key Features
Reactive JavaScript-based notebook environment
Built-in support for D3, Vega-Lite, Plot, and Web APIs
Real-time collaboration with versioning
Rich embedding and publishing options
Extensive library of public notebooks and templates
Ideal For
Data storytellers, front-end developers, and visualization-first teams.
Pricing
Free for public notebooks; team plans start at $20/user/month.
Why it's great in 2025
In an era of data overload, storytelling matters more than ever. Observable empowers users to craft compelling, interactive narratives and dashboards that go beyond static BI — ideal for internal demos, product walkthroughs, or external reports.
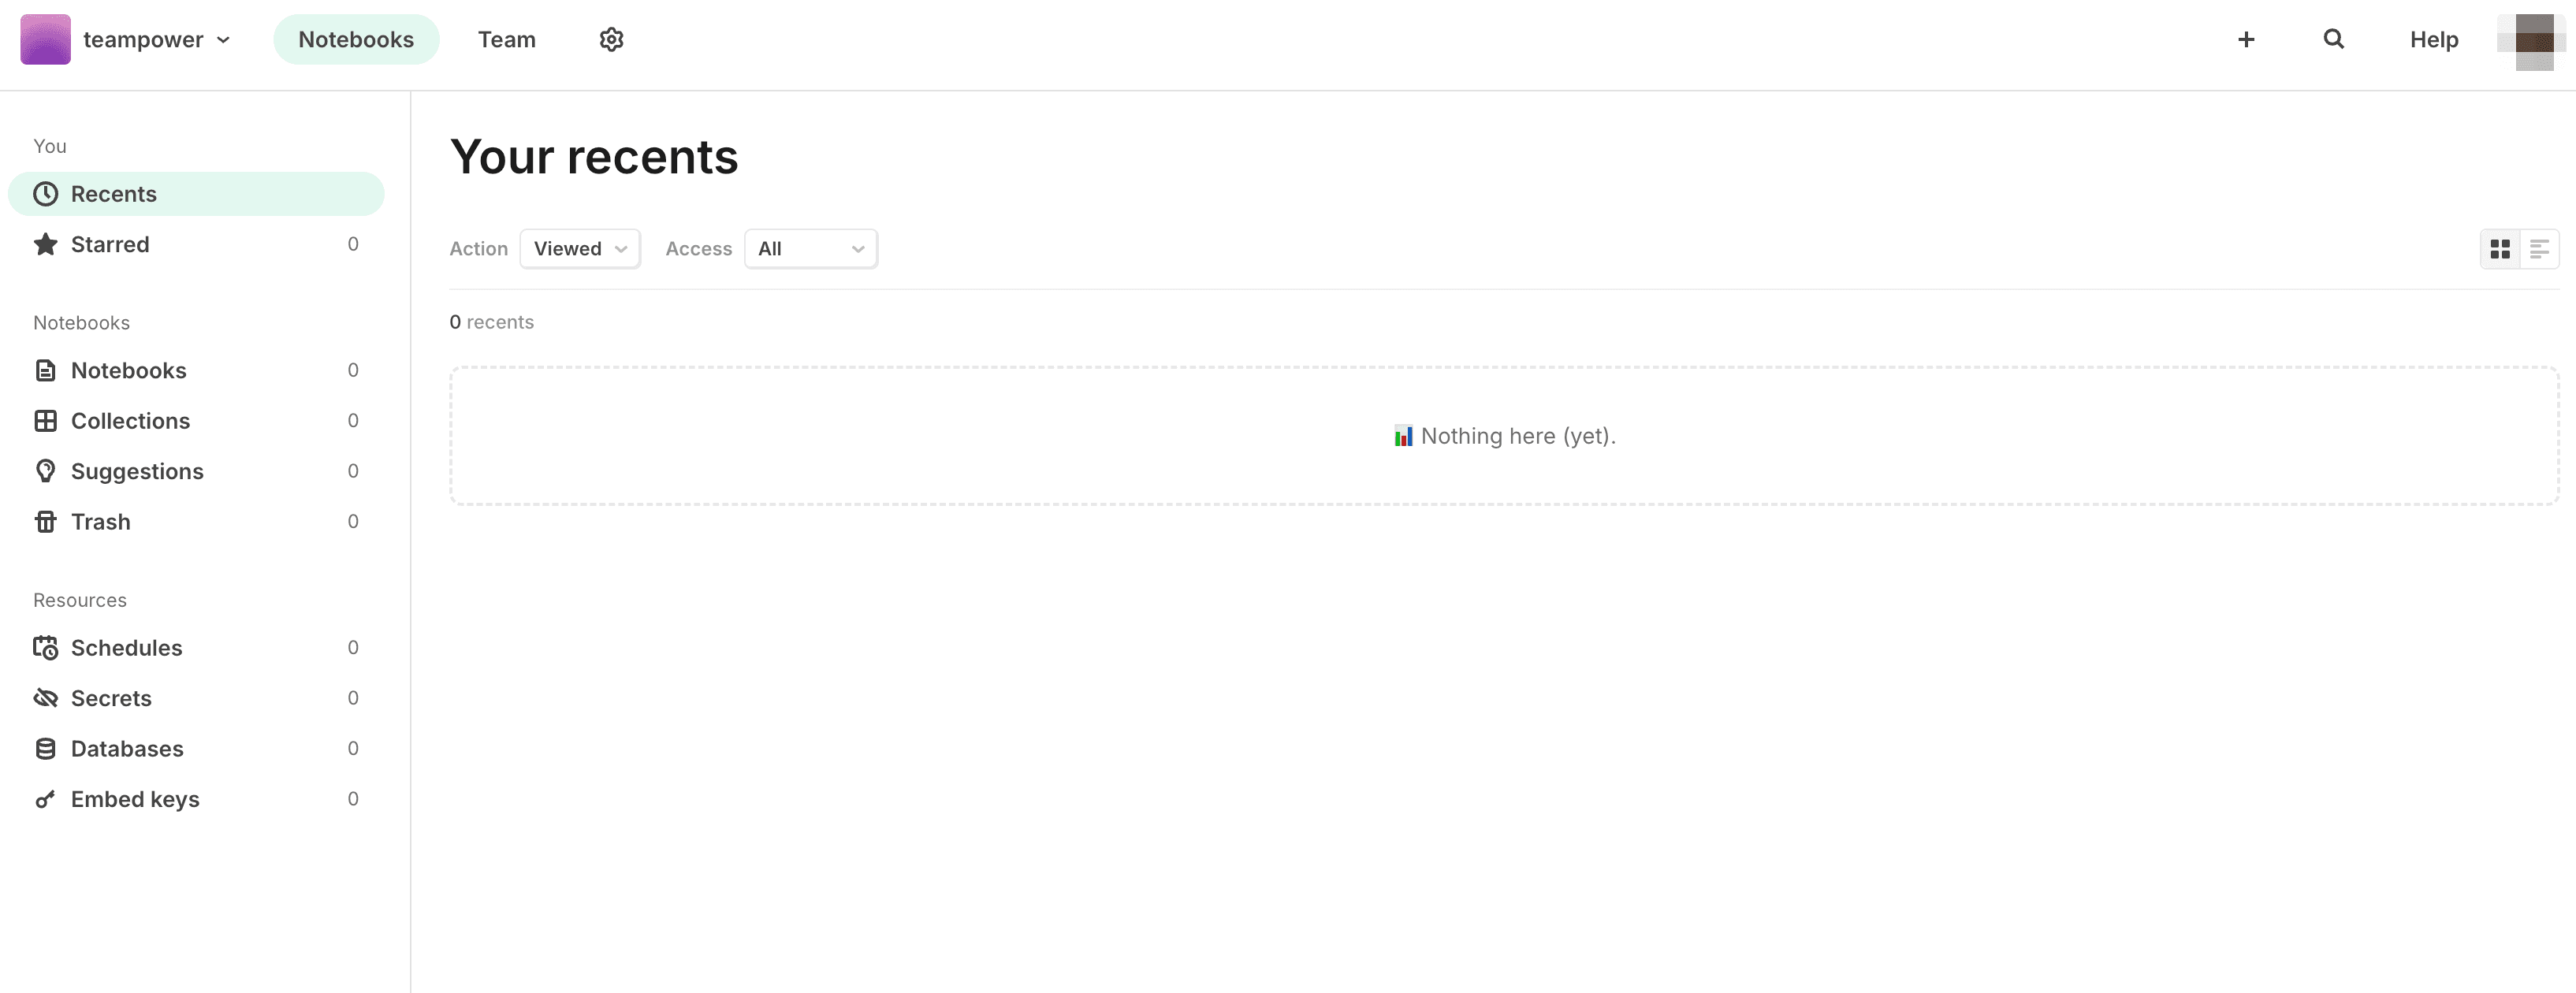
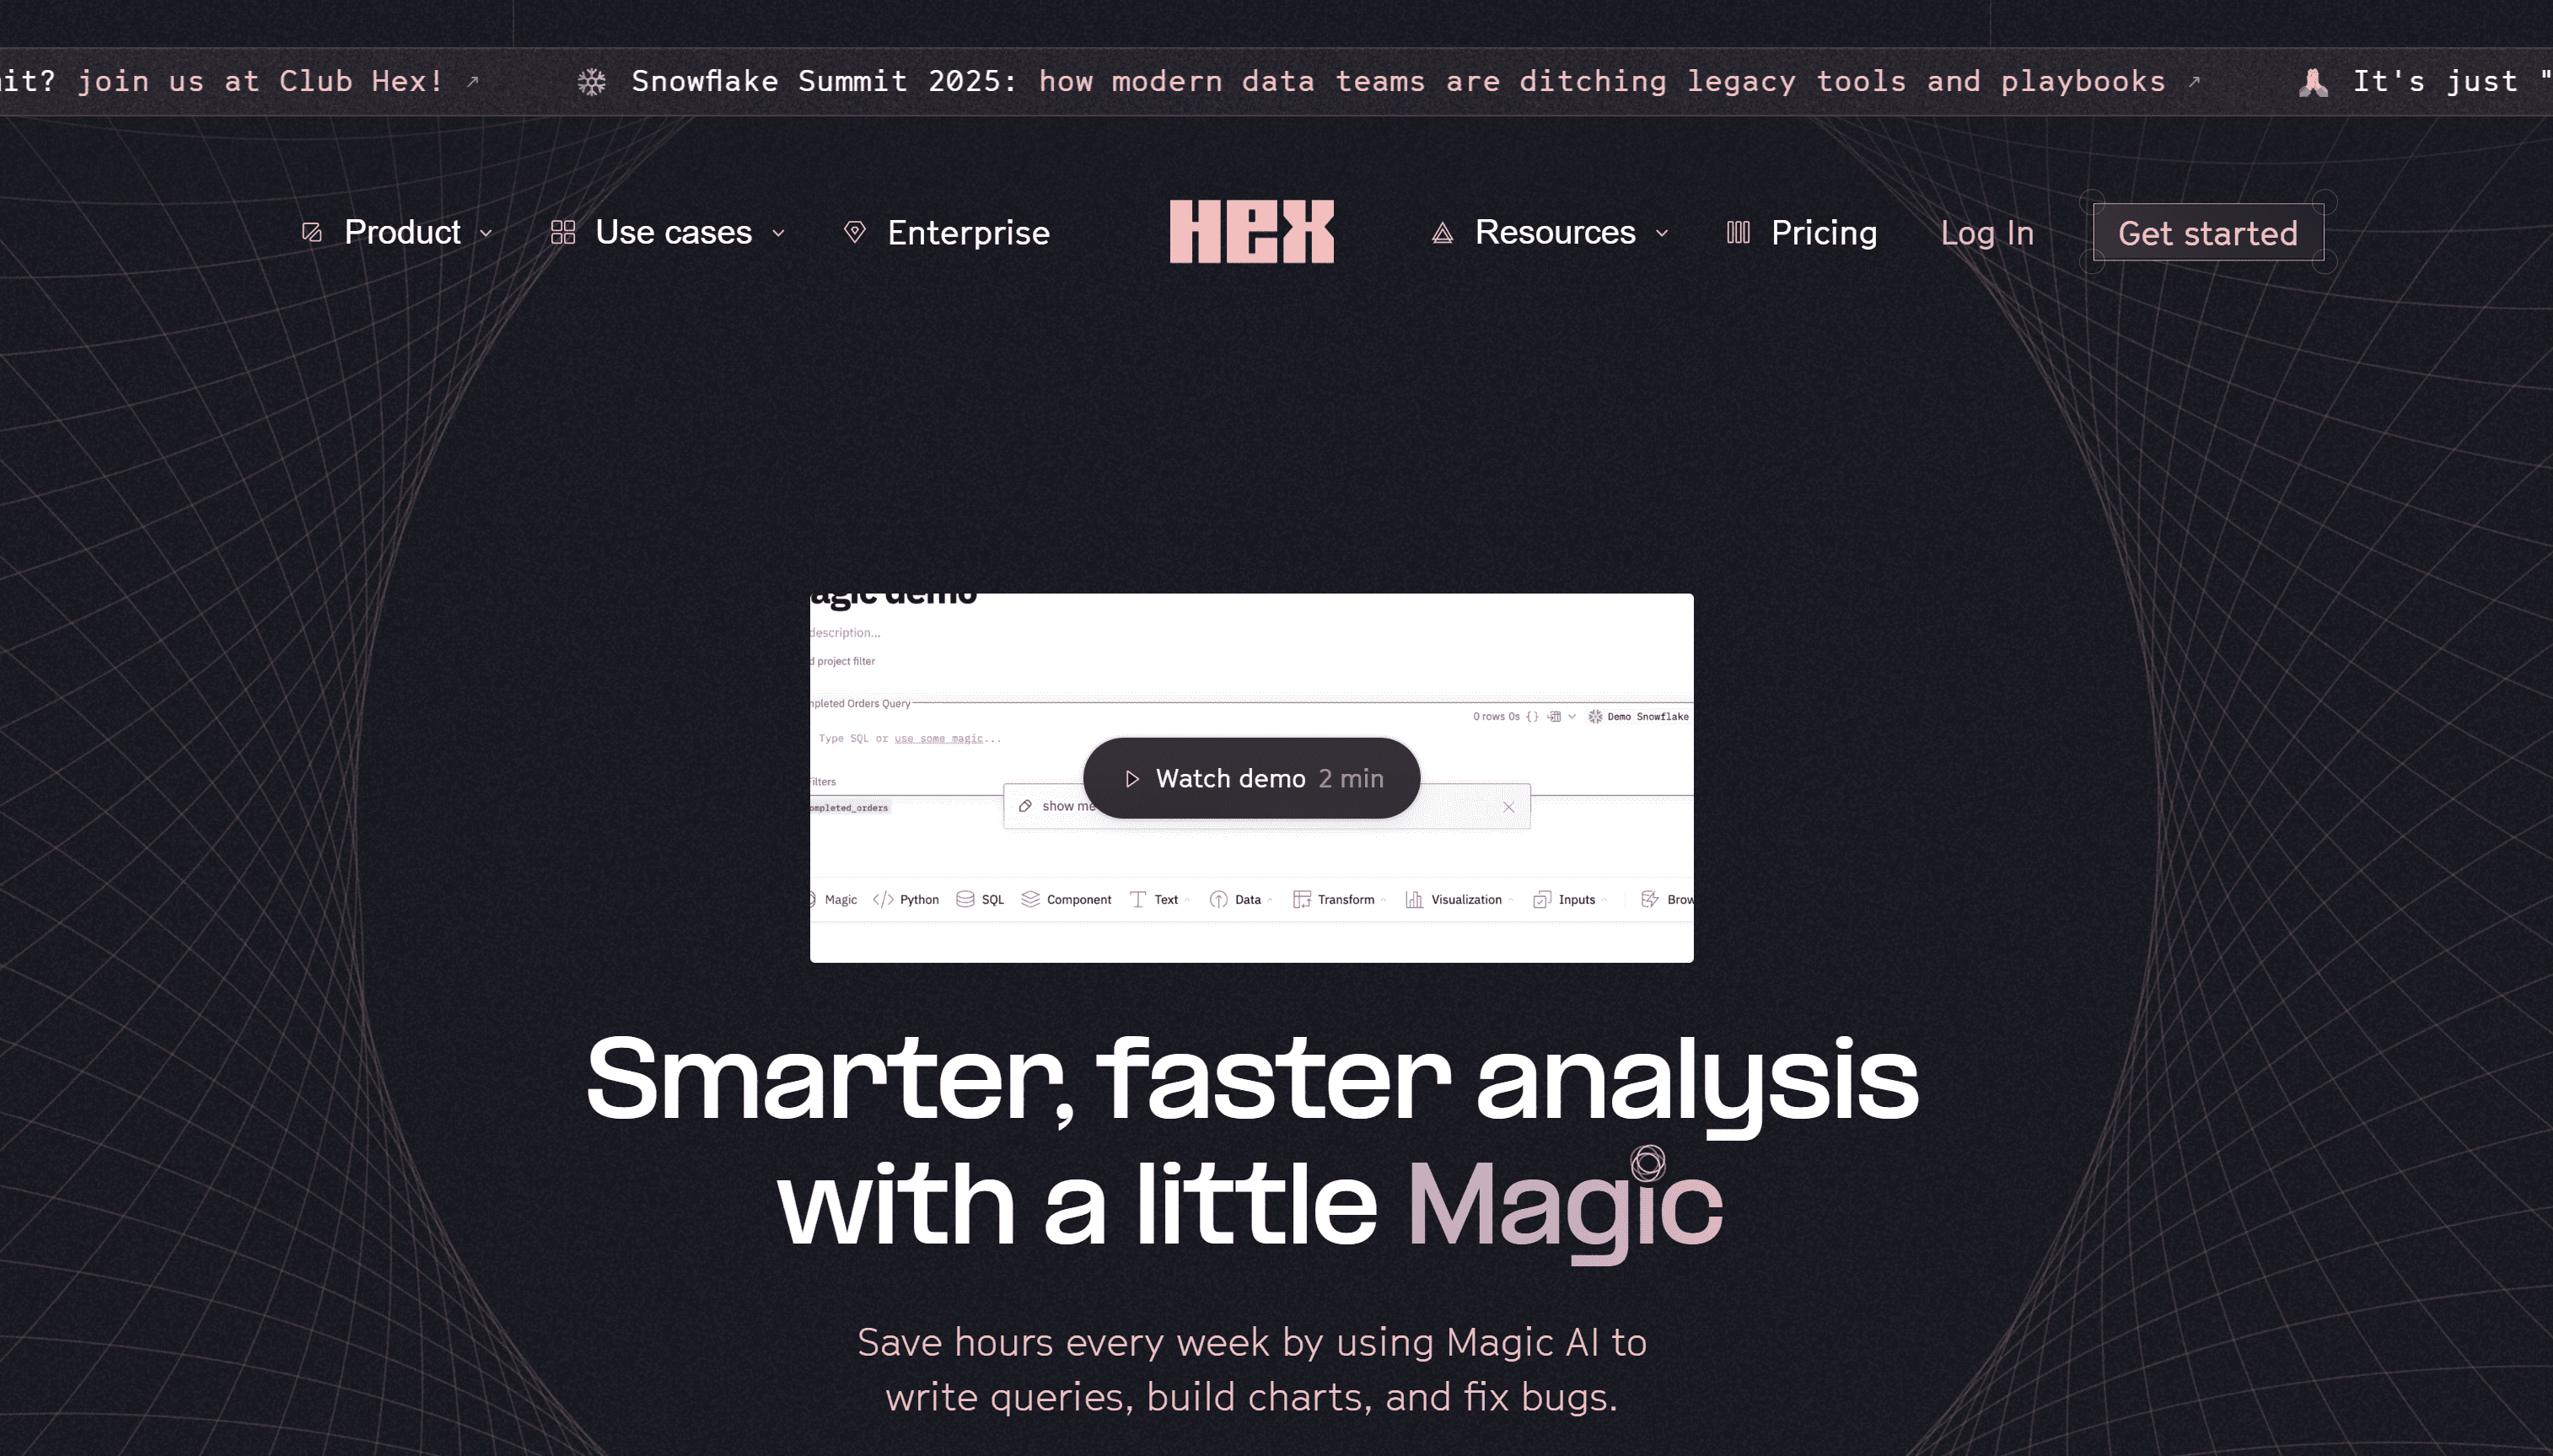
4. Hex
Hex is a collaborative data workspace that brings together SQL, Python, and AI into a single notebook-style interface. It enables teams to build data apps, automate analysis, and explore datasets through both code and natural language.
Key Features
AI-powered SQL and Python notebooks
Built-in data apps and dashboard publishing
AI “cells” for text generation, explanation, and documentation
Secure data integrations with cloud warehouses
Collaboration features for teams and stakeholders
Ideal For
Data science and analytics teams working in modern data stacks (e.g., Snowflake, BigQuery).
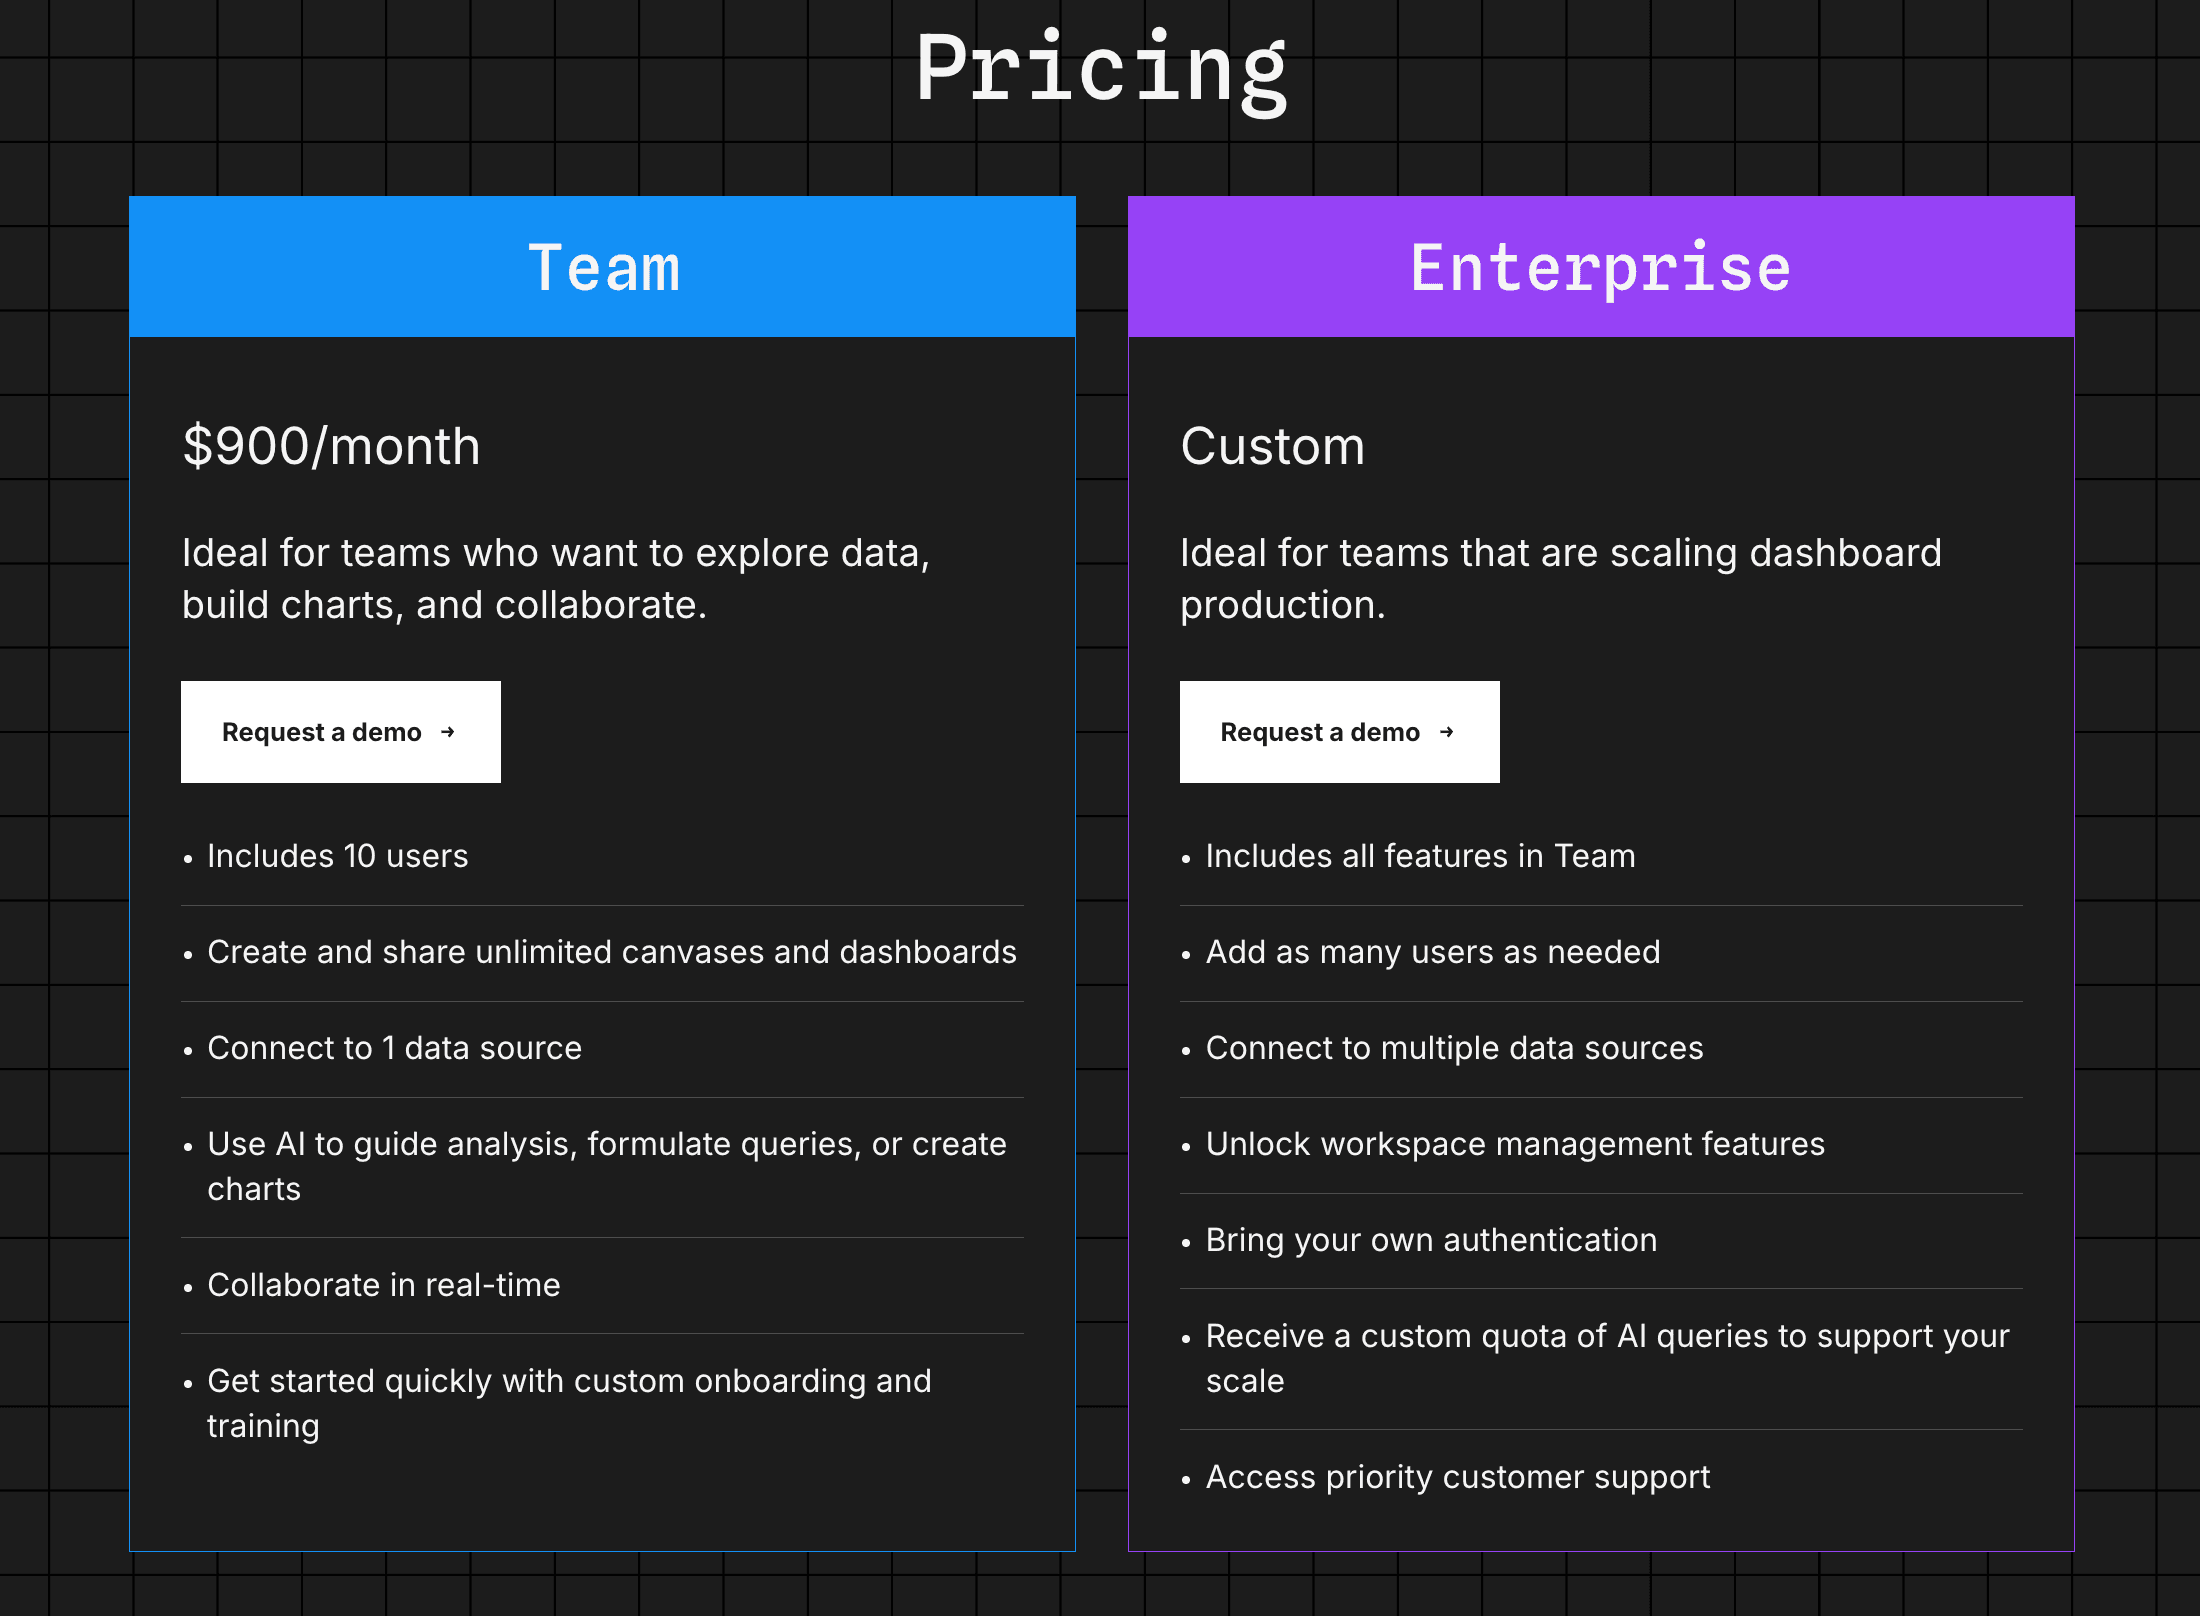
Pricing
Free for individuals; team and enterprise pricing available on request.

Why it's great in 2025
Hex has redefined the data notebook by merging code-first power with AI-driven productivity. Its AI cells reduce friction, while its publishing tools make sharing insights seamless across orgs.
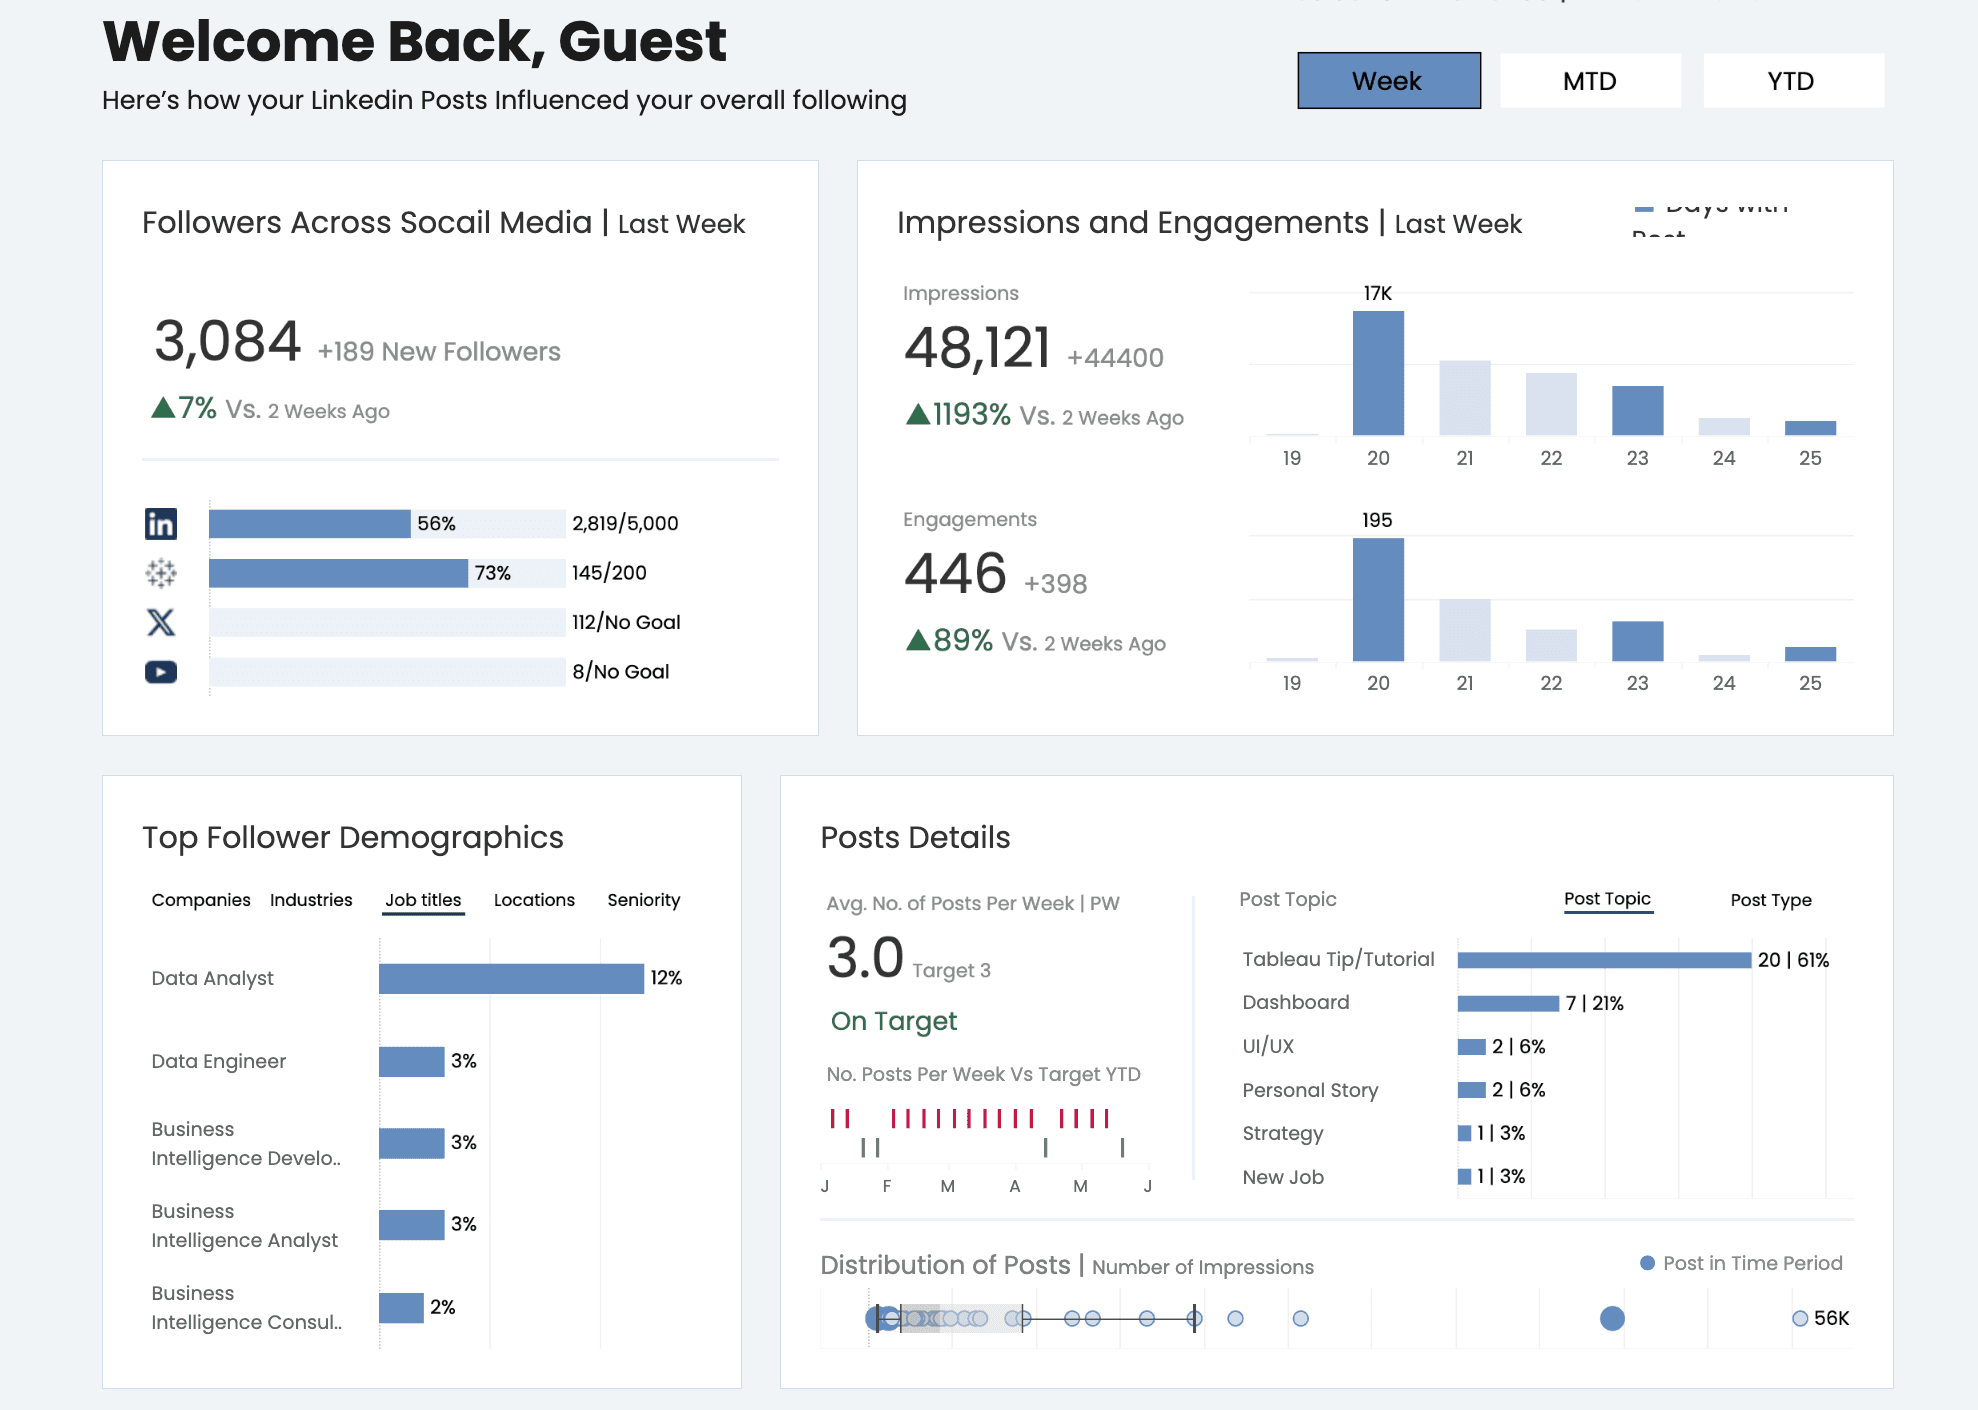
5. Tableau Pulse
Tableau Pulse is Salesforce's AI-powered enhancement to traditional BI dashboards. It proactively notifies users of significant data changes, summarizes trends in plain language, and integrates with communication tools like Slack, Teams, and email.
Key Features
Automated alerts and anomaly detection
Natural language summaries powered by Einstein AI
Deep integration with Tableau and Salesforce
Notification workflows for business events
Mobile-first and cross-platform support
Ideal For
Enterprise executives, sales ops, and real-time monitoring teams.
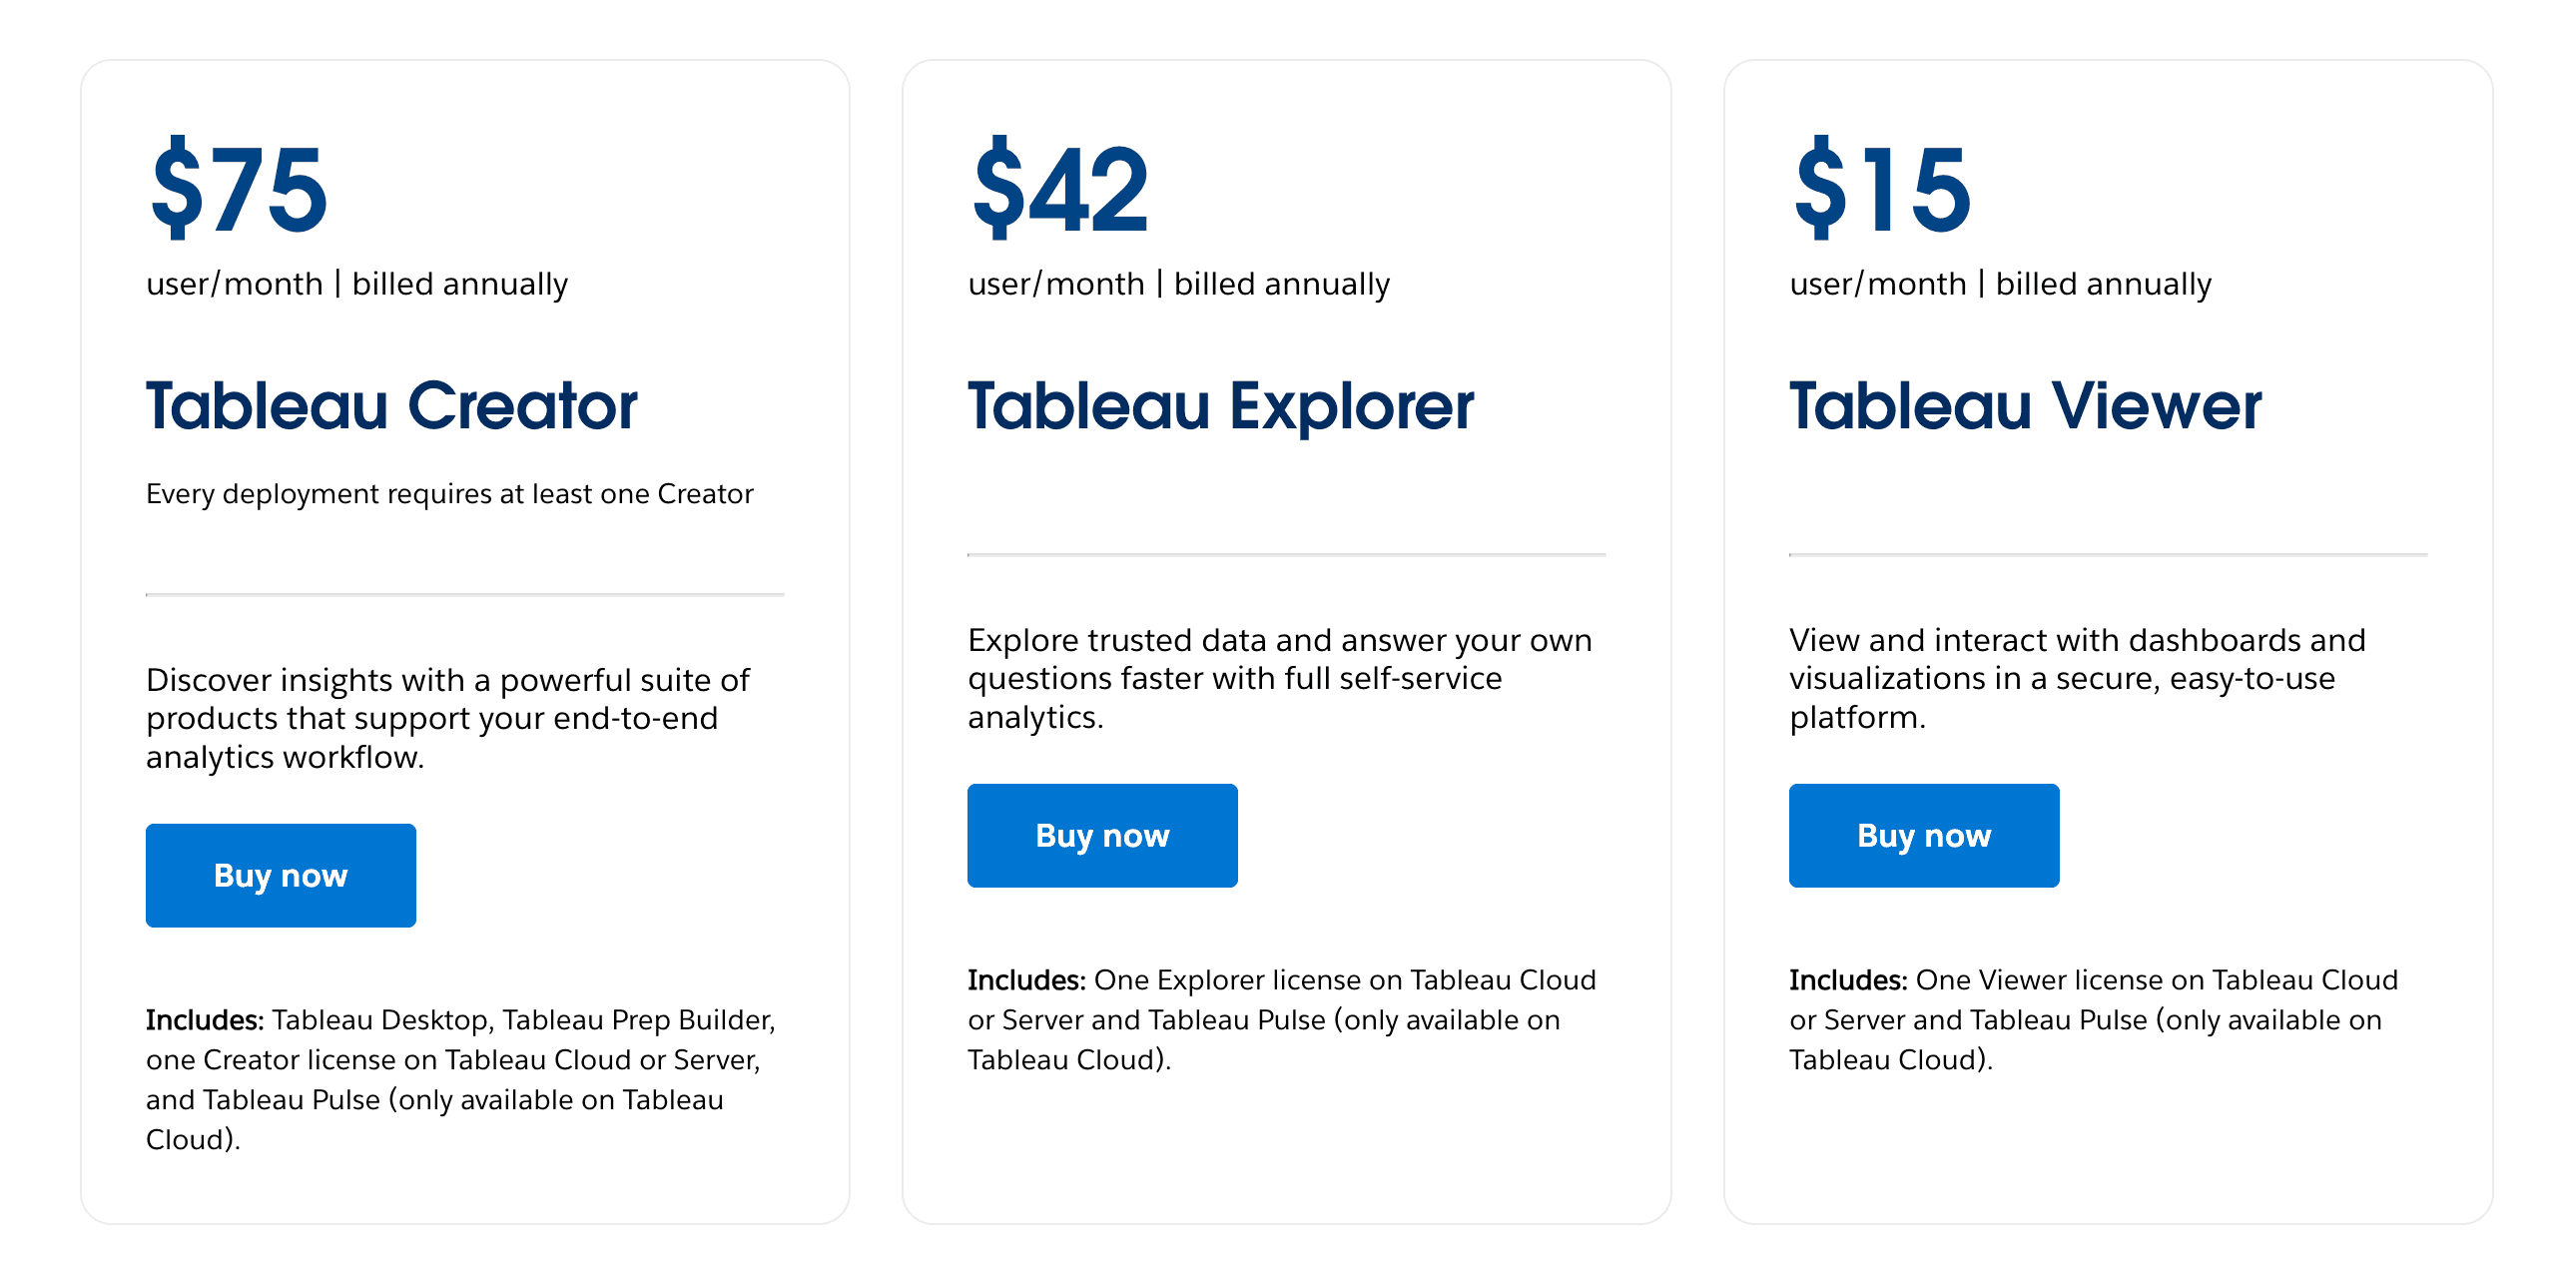
Pricing
Included in Tableau Cloud licenses; enterprise pricing based on seats and usage.
Why it's great in 2025
Pulse eliminates dashboard fatigue by bringing data to decision-makers, not the other way around. In a fast-moving world, it's an always-on companion that tells you what's changed — and why it matters — without logging in.
6. CoLoop
CoLoop is a spreadsheet-native AI copilot designed to help teams make sense of tabular data quickly. It integrates with Google Sheets and Excel, offering intelligent column operations, summaries, and insight suggestions — all in natural language.
Key Features
AI-assisted formula generation and summaries
Natural language Q&A over tables
Automated column tagging and grouping
Integrates with Google Sheets and Excel
Supports CSV uploads and browser-based workflows
Ideal For
Operations, marketing, and finance teams working in spreadsheets.
Pricing
Free tier available; paid plans from $10/month.
Why it's great in 2025
CoLoop turns spreadsheets into smart workspaces, enabling non-technical users to explore data without ever leaving the familiar grid. It's the bridge between AI and the world's most-used data tool.
Comparison Table
To help you find the right tool for your specific needs, here's a quick side-by-side comparison of the tools covered in this list:
Tool | AI-Powered | No-Code | Notebook-Based | Real-Time Alerts | Best For |
Powerdrill Bloom | ✅ | ✅ | ❌ | ✅ | Analysts, business teams |
DuckDB Stack | ❌ | ❌ | ✅ | ❌ | Engineers, scientists |
Observable | ❌ | ✅ | ✅ | ❌ | Data storytellers, devs |
Hex | ✅ | ❌ | ✅ | ❌ | Data teams, technical users |
Tableau Pulse | ✅ | ✅ | ❌ | ✅ | Executives, enterprise users |
CoLoop | ✅ | ✅ | ❌ | ❌ | Ops, finance, marketing |
How to read this table:
AI-Powered: Leverages AI/LLMs for insights or interaction.
No-Code: Can be used without writing code.
Notebook-Based: Follows a cell-based, interactive notebook model.
Real-Time Alerts: Push notifications or anomaly detection built-in.
This comparison helps map the tools to different personas and technical needs. For example, Powerdrill AI and CoLoop are great for non-technical users, while Hex and DuckDB cater to data-savvy professionals.
Conclusion
Exploring data has always been a foundational step in turning information into impact — but in 2025, the process is faster, smarter, and more accessible than ever. With AI-driven features, intuitive interfaces, and support for vast datasets, modern tools allow anyone — from analysts to executives — to ask better questions and get deeper insights.
Whether you're:
Looking for speed and control (DuckDB),
Prioritizing storytelling and design (Observable),
Enabling AI-powered insights (Powerdrill AI, CoLoop, Hex),
Or pushing alerts to your team in real time (Tableau Pulse),
…there's a tool purpose-built for your workflow.
The future of data exploration is no longer about dashboards. It's about interaction. And in 2025, these tools are at the forefront of that change.
FAQ
Q1: What is the difference between data exploration and data analysis?
Data exploration is the first step in understanding your dataset. It involves identifying trends, spotting anomalies, checking distributions, and formulating questions. Data analysis goes further to test hypotheses, validate models, and draw actionable conclusions. Exploration is about discovery, while analysis is about proof.
Q2: Are AI-powered data exploration tools only for technical users?
Not anymore. Many 2025 tools like Powerdrill AI and CoLoop are designed with no-code or natural language interfaces, enabling marketers, PMs, and operators to explore data without writing SQL or Python. At the same time, tools like Hex and DuckDB still cater to developers and data scientists with full code control.
Q3: How do LLMs improve the data exploration process?
LLMs (Large Language Models) transform the experience by enabling natural language interaction with data. They can:
Translate questions into SQL
Summarize trends in plain English
Recommend next questions
Auto-generate charts and dashboards
This reduces the technical barrier and dramatically speeds up insight discovery.
Q4: Which tool is best for teams that collaborate across roles?
Hex and Powerdrill AI are ideal for cross-functional teams. They offer a shared canvas for business and technical users to explore, comment, and publish insights. Observable is also great for visual collaboration, especially with frontend or data design teams.
Q5: What's the best free tool to get started?
DuckDB + Polars is completely free and powerful for technical users.
Powerdrill AI offers a generous free tier with AI-driven features.
Observable and Hex also provide free plans with limited private sharing.
All are great entry points depending on your skill level and use case.
Q6: How do I choose the right tool for my use case?
Consider the following:
Your technical comfort level (No-code vs code-first)
Team size and collaboration needs
Real-time vs static analysis
Data source compatibility
Use the comparison table above to guide your decision based on these dimensions.


