
Introduction
In a world where speed and intuition are becoming as important as accuracy, Vibe Data Analysis is rapidly redefining how we interact with data. No more SQL queries, dashboards built from scratch, or navigating dense analytics software. Instead, just type your intent—the vibe—and let AI do the rest.
Welcome to the future of data analysis, powered by conversational AI agents that understand not just your questions, but your intent.
What Is Vibe Data Analysis?
Vibe Data Analysis is a natural language–driven approach to exploring data. It removes the technical barrier between the user and the insight. Instead of writing scripts or configuring BI dashboards, you simply say what you want:
“Show me why sales dropped last quarter.” “Compare customer churn in 2023 vs 2024.” “What’s the biggest risk to our growth right now?”
Behind the scenes, large language models (LLMs) translate these questions into data operations: running queries, filtering results, building visualizations, and even generating narratives. What emerges is not just a chart or a number, but a story, tailored to your context.
Why AI Data Agents Matter
AI data agents are the engines of this shift. They act as intelligent intermediaries between human language and structured data. A good data agent can:
Interpret vague or high-level questions
Retrieve relevant data across different sources
Generate charts, dashboards, or summaries
Ask follow-up questions for clarification
Learn from interaction history
The best ones feel less like tools and more like collaborators—always on, always ready.
Let’s explore some of the top AI data agents enabling Vibe Data Analysis today.
Here are our top 10 picks, carefully selected by our team after thorough review.
1. Powerdrill Bloom
Powerdrill Bloom is an AI-powered visual canvas that transforms the way you explore and understand your data. Just upload your spreadsheet or file—Bloom's intelligent agent team will analyze, clean, visualize, and guide you through insights without needing any prep or formulas. It even helps you turn exploration results into presentation-ready slides in one click.

Key Features
AI-Driven Data Exploration: Bloom’s agents automatically analyze your data and offer three smart exploration paths to help you uncover insights faster.
Canvas-Based Experience: Dive into a distraction-free visual space where charts, text summaries, and follow-up questions emerge organically.
Auto-Generated Visualizations: Get meaningful charts across multiple types—bar, line, pie, and more—without lifting a finger.
Insight Summarization in Plain English: Bloom translates data into clear insights you can understand and act on, no technical jargon required.
One-Click PPT Generation: Turn your exploration journey into a shareable presentation instantly—ideal for reporting and storytelling.
Best For
Business analysts seeking fast, AI-assisted insights
Data teams looking to automate exploration and reporting
Professionals needing to turn data into presentations effortlessly
Non-technical users who want to analyze spreadsheets without coding
Anyone exploring trends, anomalies, or comparisons visually
2. Exa.ai
Exa.ai bridges the gap between internal analytics and external intelligence. It doesn’t just analyze your data — it enriches it with insights from the web, research papers, news articles, and even competitive benchmarks. Ask it “What are emerging market trends in our category based on customer data and industry sentiment?” and it will deliver a holistic answer combining structured and unstructured sources.

Key Features
Combines enterprise data with web-scale search
Cites sources (PDFs, websites, data) with traceability
Supports long-form reasoning across datasets
Ideal for strategic research and market teams
Best For
Content marketers and SEO teams seeking high-quality, factual web content
Researchers and analysts looking for fast, reliable web-scale information
AI developers needing precise, up-to-date external knowledge grounding
Product teams building intelligent search, RAG, or retrieval-augmented agents
Anyone who wants Google-scale search capabilities without the noise or ads
3. DataSutra
Data Sutra specializes in interpreting layered intent. If you ask “Compare Q1 performance across business units, factoring in currency fluctuations and marketing spend”, it doesn’t get confused — it gets to work. Built with a deep reasoning layer, it connects disparate sources and produces nuanced insights, often with commentary to guide decision-making.

Key Features
Layered Intent Understanding: Handles complex, multi-factor questions with precision—no need to oversimplify your queries.
Deep Reasoning Engine: Connects scattered data sources and applies contextual logic to deliver nuanced, actionable insights.
Smart Clarifying Dialogue: Asks follow-up questions to refine scope and ensure analytical accuracy.
Enterprise-Ready Flexibility
Designed to operate in fragmented, large-scale data environments with inconsistent or siloed inputs.Scheduled Insight Feeds: Keeps stakeholders aligned with automatic, periodic delivery of tailored insights and commentary.
Best For
Strategy and operations teams dealing with messy or multi-dimensional data
Executives who need high-level synthesis without getting lost in raw data
Enterprise users working across multiple departments or data systems
Analysts seeking more than just numbers—insights with context and decision support
Anyone who wants clarity from complexity, especially in ambiguous or layered business questions
4. Lightdash Copilot
Lightdash Copilot is an AI-native assistant built directly into your BI workflow. It helps you explore metrics, generate charts, and uncover insights within your dbt-defined data model—all through natural language. No SQL, no guesswork—just ask and get instant answers, visualizations, or even actionable questions to go deeper.

Key Features
Ask in Natural Language: Skip the SQL. Copilot understands your intent and translates it into accurate queries across your dbt metrics.
Built into the BI Experience: Copilot lives inside Lightdash, enhancing the tools you already use—no extra setup or switching tabs.
Smart Chart Suggestions: Automatically visualizes your query results with contextually relevant charts, ready for analysis or sharing.
Understands dbt Semantics: Deeply aware of your dbt model, so it respects definitions, metrics, and relationships—no misinterpretation.
Conversational Exploration: Copilot guides your analysis with smart follow-up questions to help you dig deeper, spot anomalies, or compare results.
Best For
Data teams using dbt and Lightdash who want to reduce manual querying
Business users looking to self-serve insights from trusted, modeled data
Analysts seeking to speed up exploration and chart creation
Organizations aiming to democratize data access without compromising accuracy
Anyone who wants AI support right where their BI happens
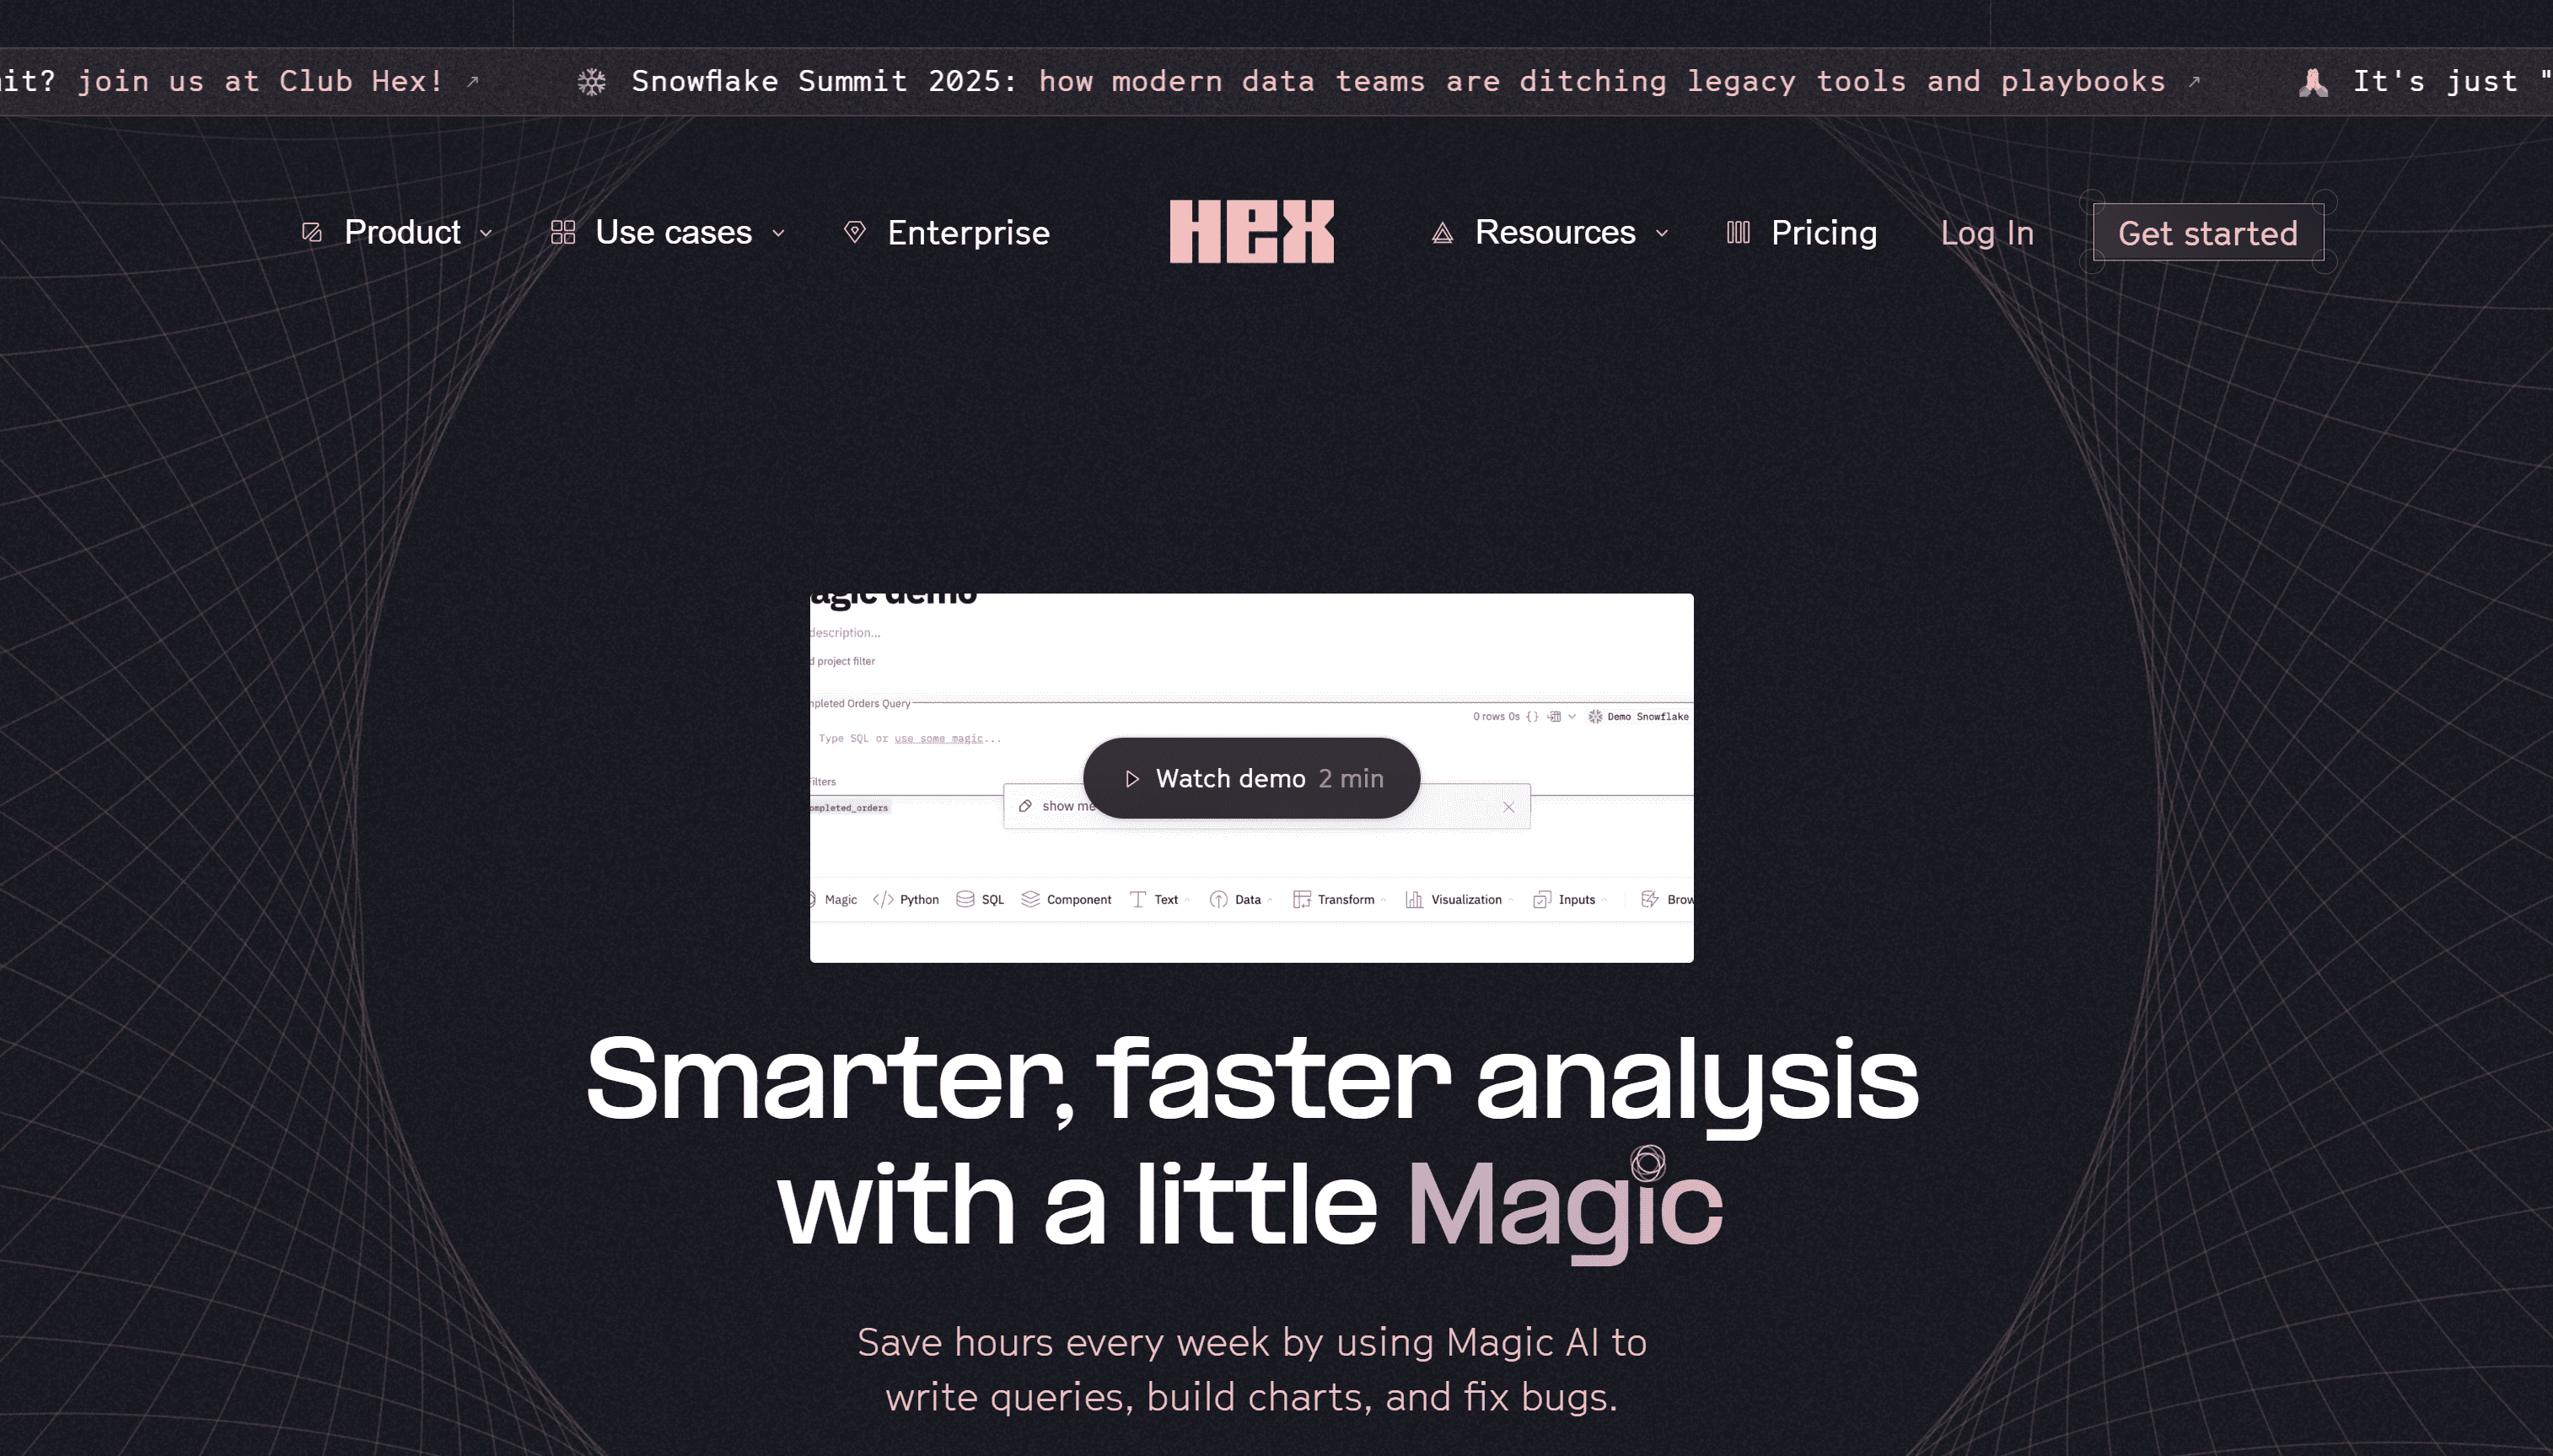
5. Hex Magic AI
Hex Magic AI brings generative intelligence into the heart of your analytics workflow. Whether you're writing SQL, building visualizations, or explaining results, Magic AI helps you move faster and think deeper—with natural language, contextual awareness, and smart suggestions that keep your analysis flowing.
Key Features
AI-Powered SQL Generation: Describe what you need in plain English, and Magic AI writes the query instantly—no syntax blocks.
Natural Language Cell Creation: Insert chart cells, markdown explanations, or data transformation steps just by asking.
Context-Aware Suggestions: Understands your project’s variables, data sources, and prior steps to deliver accurate, helpful outputs.
Explain Code & Results: Generate clear explanations of complex code and outputs, making insights more accessible to all stakeholders.
Accelerated Notebook Building: Streamline your notebook creation process with AI that anticipates your next move.
Best For
Data scientists and analysts working in Hex notebooks
Teams looking to speed up exploratory analysis and storytelling
Non-technical collaborators who need help understanding code and results
Fast-moving product or growth teams requiring data-backed answers
Anyone who wants to analyze faster without sacrificing depth or accuracy
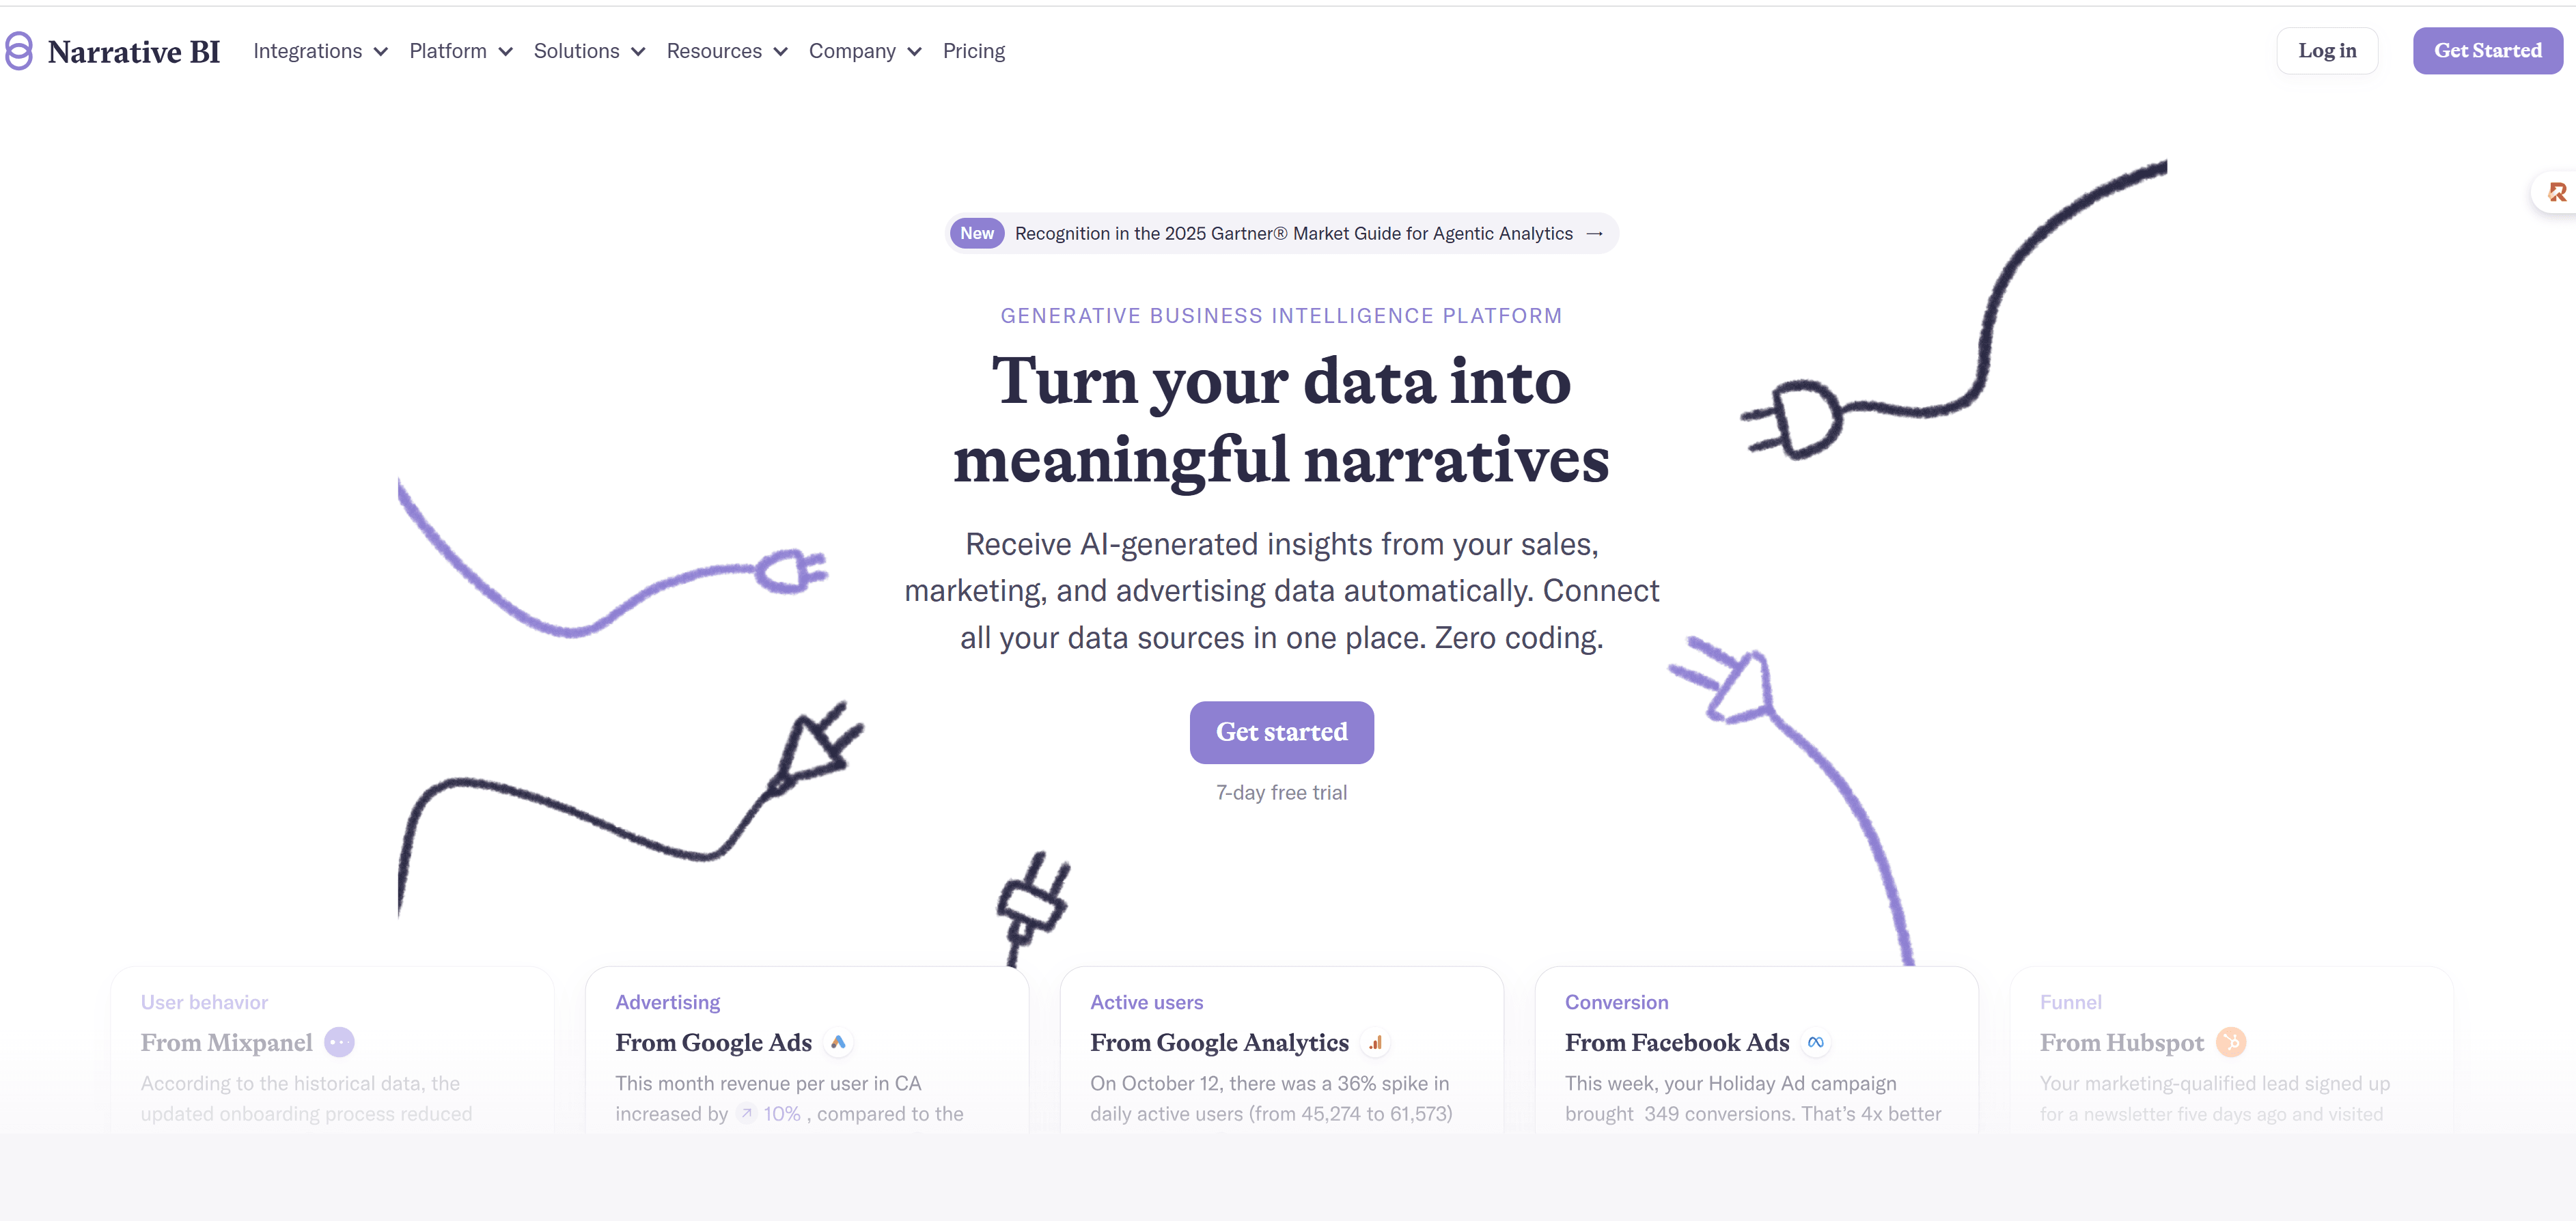
6. Narrative BI
Narrative BI transforms raw metrics into clear, actionable stories—automatically. By connecting to your analytics tools, it monitors your KPIs, detects anomalies or trends, and delivers insights in natural language, so your team always knows what’s happening and why—without digging through dashboards.
Key Features
Automated Insight Generation: Continuously analyzes your data and delivers timely, plain-English narratives about changes, trends, and anomalies.
No-Code Setup: Connects directly to tools like GA4, HubSpot, or Mixpanel—no engineering required.
KPI Monitoring with Context: Tracks key metrics and explains not just what changed, but what likely caused it.
Email & Slack Alerts: Get insight summaries where your team works—no need to open a dashboard.
Customizable Narratives: Tailor what gets tracked, how it's explained, and who receives the insights.
Best For
Growth and marketing teams tracking engagement, conversion, or retention
Product managers who want automated updates on user behavior
Business teams who need insights without relying on data analysts
Startups and SMBs without a dedicated BI team
Anyone who prefers readable, actionable summaries over digging into charts
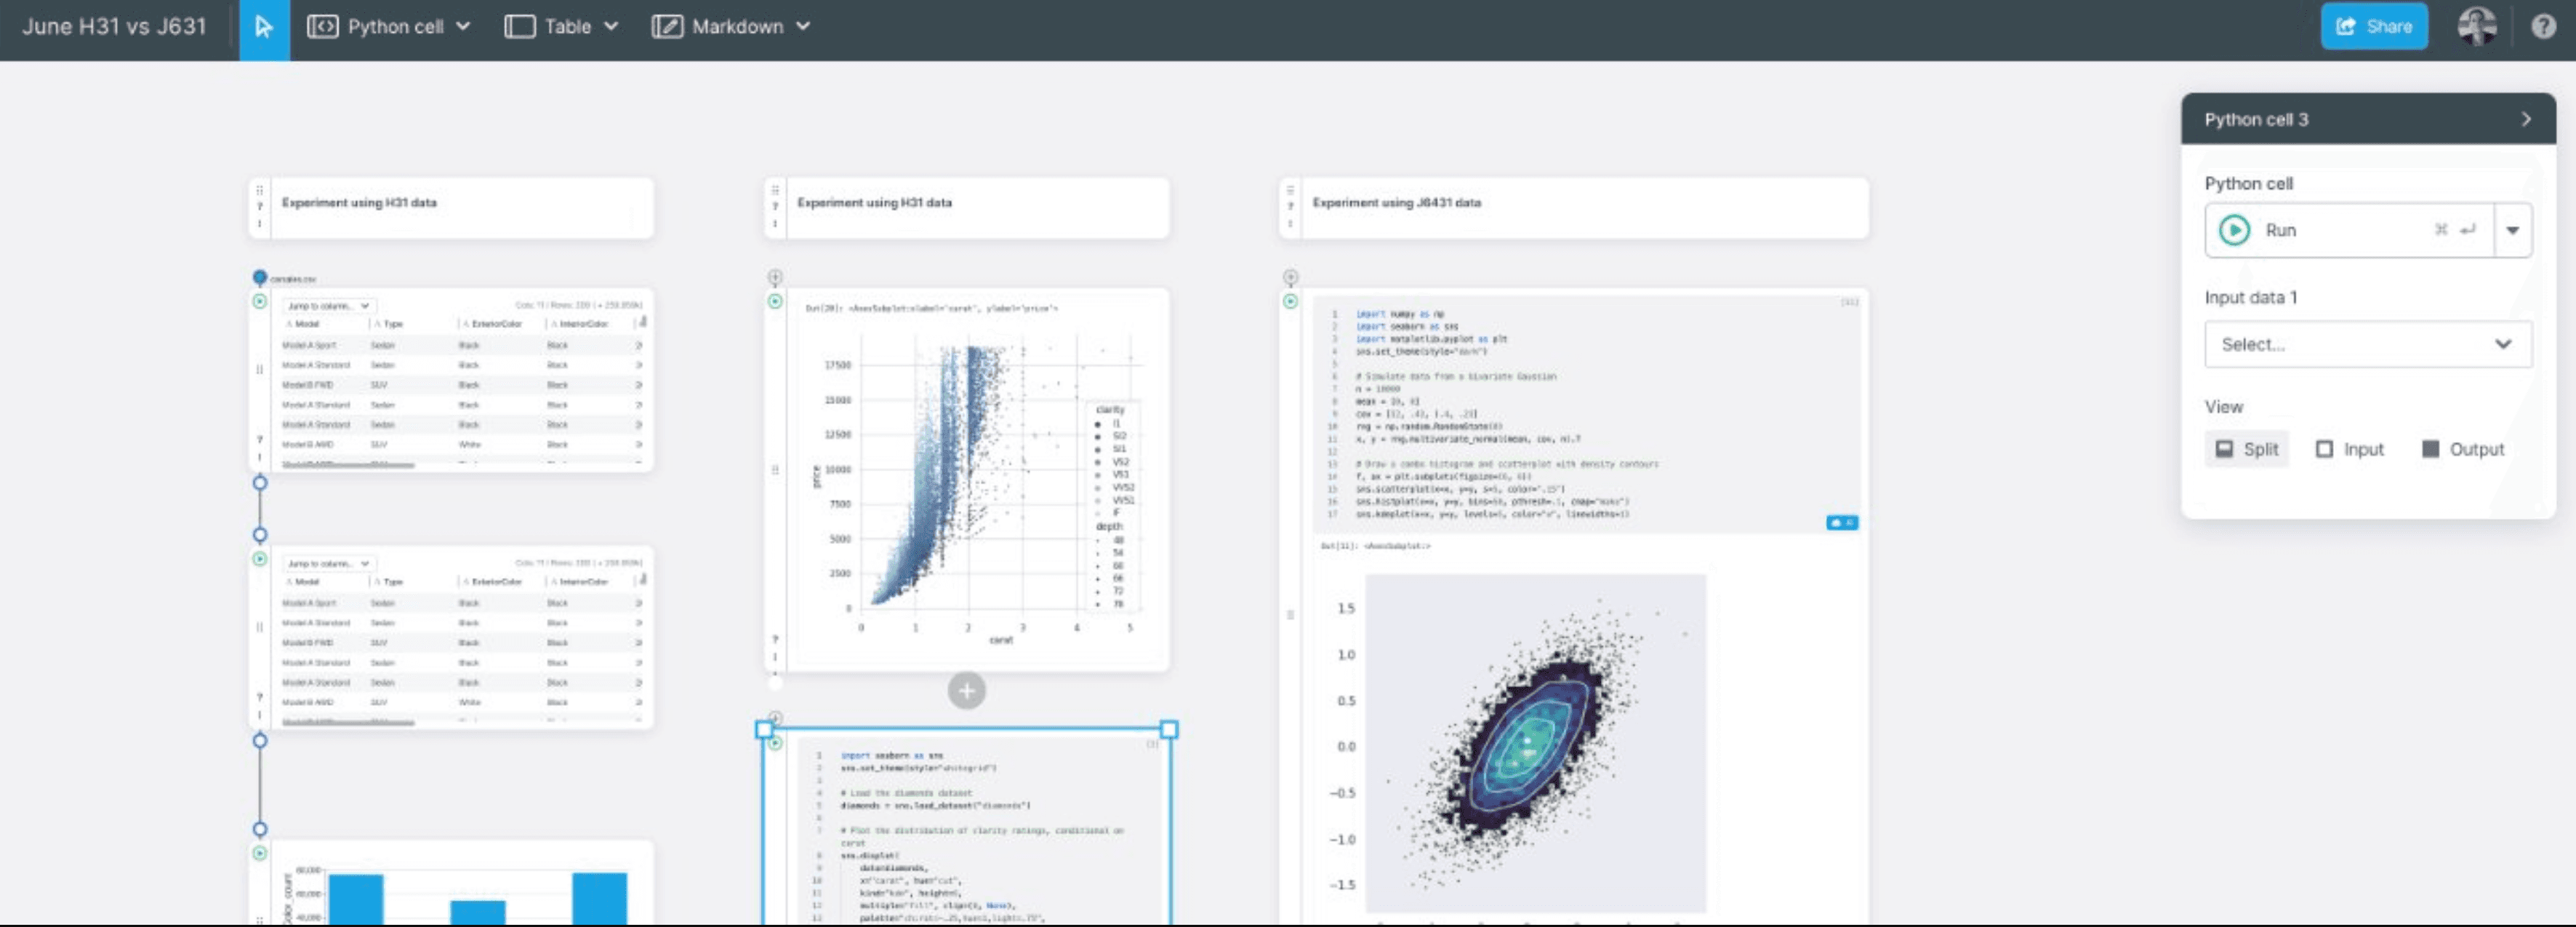
7. Einblick AI
Einblick AI combines the power of visual data workflows with conversational AI to help you explore, analyze, and share insights effortlessly. Just ask questions in natural language—Einblick understands your intent, builds the logic, and delivers answers through interactive charts, tables, and visual workflows you can tweak and share in real time.
Key Features
Conversational Data Analysis: Ask questions naturally—Einblick interprets your intent and runs the right analysis instantly.
Visual Workflow Canvas: Drag-and-drop interface lets you map out data transformations, visualizations, and models in a collaborative canvas.
AI Auto-Completion & Suggestions: Accelerate your work with smart code suggestions, auto-charting, and AI-assisted transformations.
Multi-Modal Support: Combine SQL, Python, visual blocks, and AI chat in one flexible workspace.
Collaborative by Design: Share interactive canvases with teammates and make decisions together—live or async.
Best For
Data teams combining code and no-code workflows
Analysts and PMs looking for flexible, visual data exploration
Cross-functional teams needing a collaborative analytics workspace
Organizations seeking to blend AI assistance with manual control
Anyone who wants fast, interpretable insights without jumping between tools
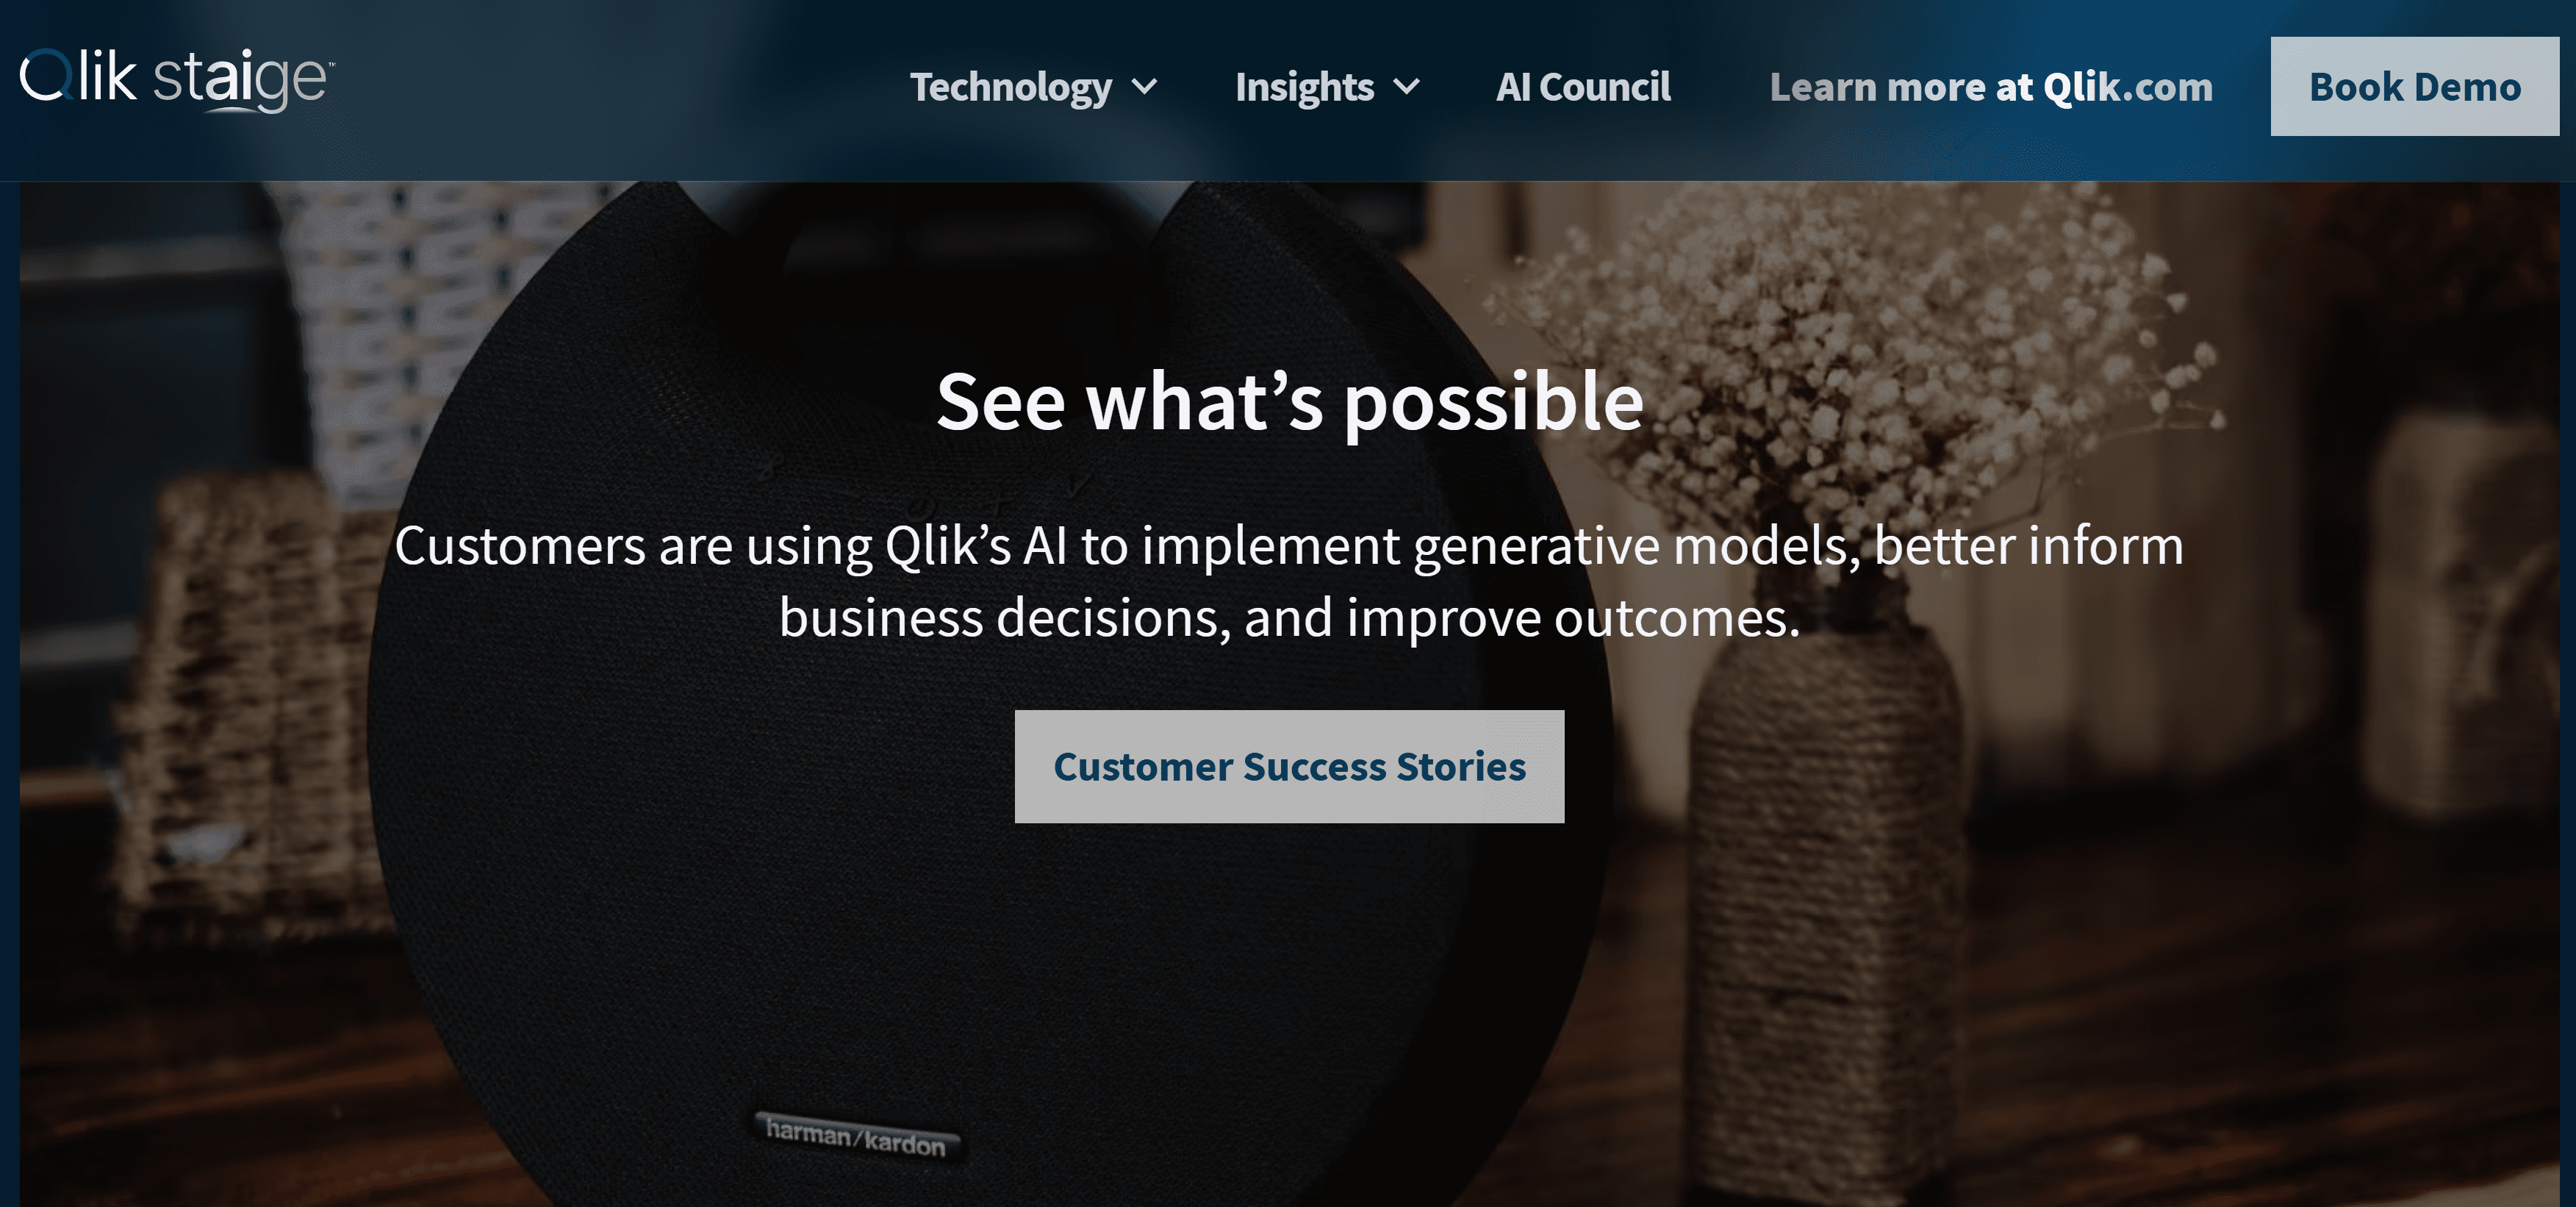
8. Qlik Staige
Qlik Staige is Qlik’s AI innovation suite designed to bring generative intelligence into every corner of the modern data stack. From automated insight generation to AI-assisted analytics and decision-making, Staige empowers organizations to activate their data with context-aware, trustworthy AI—seamlessly integrated into existing Qlik workflows.
Key Features
Auto-Generated Insights: Identify anomalies, trends, and key drivers automatically—no manual digging required.
Natural Language Interaction: Ask questions conversationally and get accurate, explainable results with full data lineage.
Integrated Across Qlik Platform: Works within Qlik Sense and Qlik Cloud to deliver consistent, governed AI experiences.
AI-Driven Forecasting & Planning: Leverage predictive models to simulate outcomes, assess risks, and guide strategic planning.
Governed & Transparent AI: Built-in safeguards ensure AI outputs are traceable, reliable, and aligned with enterprise governance policies.
Best For
Enterprise BI teams seeking scalable AI integration
Business leaders who want decision-ready insights without waiting on analysts
Organizations prioritizing data trust, compliance, and explainability
Existing Qlik users ready to augment their workflows with AI
Anyone needing governed, secure, and embedded AI analytics at scale
9. ThoughtSpot
ThoughtSpot makes data exploration as easy as using a search bar. Designed with business users in mind, it lets anyone ask questions in natural language and get instant, interactive answers—backed by real-time data. With built-in generative AI, ThoughtSpot goes beyond charts to provide contextual narratives, recommendations, and follow-up insights.

Key Features
Search-Based Analytics: Type your question like a Google search—ThoughtSpot translates it into live queries and returns accurate charts instantly.
Live Query on Cloud Data: Connects directly to cloud warehouses (Snowflake, BigQuery, Databricks, etc.) to ensure up-to-the-minute results.
Generative AI Insight Narratives: Augments visualizations with plain-English summaries, trend explanations, and proactive recommendations.
Auto-Exploration & Drill-Down: Easily pivot, slice, or drill into any chart to explore the “why” behind your data with just a click.
Embed & Extend: Integrate ThoughtSpot into your apps, workflows, or customer-facing platforms for seamless insight delivery.
Best For
Business users who want instant answers without SQL
Data teams enabling self-serve BI across the org
Product and growth teams tracking performance in real-time
Cloud-native companies using modern data warehouses
Enterprises looking to embed AI-powered insights into workflows and applications
10. Polytomic
Polytomic syncs data from your data warehouse to operational systems like Salesforce, HubSpot, and internal tools—without writing code. Keep your go-to-market teams, support reps, and business users always up to date with accurate, live data from Snowflake, BigQuery, Postgres, and more.
Key Features
Reverse ETL Made Easy: Sync warehouse data to CRMs, marketing platforms, and internal apps with just a few clicks—no engineering required.
Real-Time & Incremental Updates: Keep downstream tools always fresh with live or scheduled syncs that scale with your data.
No-Code UI with SQL Flexibility: Point-and-click setup for non-technical users, plus full SQL support for custom logic.
Data Lineage & Monitoring: Built-in tools to track sync status, diagnose issues, and ensure data accuracy across systems.
Secure & Scalable Architecture: Designed for enterprise needs with robust access controls and high-volume support.
Best For
RevOps and marketing teams needing fresh customer data in CRM or engagement tools
Data teams looking to operationalize analytics without building custom pipelines
B2B SaaS companies syncing product usage data into GTM workflows
Organizations bridging the gap between analytics and action
Anyone who wants to activate warehouse data in real time, without waiting on engineering
Conclusion
Vibe Data Analysis isn’t just a feature. It’s a mindset shift—from structured querying to intuitive exploration. The tools leading this shift are doing more than parsing language; they’re learning how we think.
As data becomes more abundant and decision cycles get shorter, the ability to ask smarter questions faster is a superpower. AI data agents are the new co-pilots on that journey.
Ready to catch the vibe?


