
Introduction
In today's fast-paced digital world, data alone isn't enough to capture attention—you need stories that people can understand and visuals that bring insights to life. That's where infographics come in. They transform raw numbers into compelling narratives, making complex information easy to digest and share across presentations, reports, and social media.
But creating infographics the traditional way can be time-consuming. You need to clean data, design visuals, choose the right charts, and make sure everything looks professional. This often requires both technical and design skills, which many teams simply don’t have the time or resources for.
Enter AI infographic generators. These tools combine data analysis, visualization, and storytelling into one seamless process. With just a few clicks, you can upload a spreadsheet, import a PDF, or even enter a simple topic, and the AI will automatically explore your data, generate charts like pie graphs, line plots, scatter diagrams, and heatmaps, and assemble them into polished infographics. Some even go a step further, surfacing actionable insights that help you make smarter decisions.
In this article, we'll explore the top 10 AI infographic generators in 2025—comparing their features, strengths, and best use cases.
What Is an AI Infographic Generator?
An AI infographic generator is a tool that leverages artificial intelligence to transform raw data or ideas into clear, visually appealing infographics—without requiring users to have advanced design or technical skills. Unlike traditional design software, which often demands hours of manual effort, AI-driven tools streamline the entire process by combining data analysis, chart creation, and storytelling into one automated workflow.
At its core, an AI infographic generator does three things:
Data Exploration and Analysis
It automatically examines datasets—whether they come from spreadsheets, reports, or user-input topics—and identifies the most important insights worth highlighting.Visualization and Design
Instead of leaving you to manually choose chart types or arrange layouts, the AI generates professional visuals such as pie charts, line graphs, scatter plots, and heatmaps, and integrates them into a cohesive infographic.Narrative Building
The best tools go beyond visualization. They connect the dots between numbers, highlight trends, and even produce actionable insights that suggest next steps—helping you not only present information but also drive decisions.
Because of these capabilities, AI infographic generators are being used across industries—from marketers creating shareable content, to analysts presenting findings, to educators turning lessons into engaging visuals. They save time, reduce the need for specialized skills, and ensure your data tells a story that resonates with your audience.
Key Features to Look for in AI Infographic Generators
Ease of Use – The best tools let you generate infographics without prompts or design skills, saving time instantly.
Flexible Data Input Options – Support for Excel, CSV, PDF, or even topic input ensures you can start from any source.
Rich Visualization Variety – Multiple chart types like pie, line, scatter, and heatmaps help you tell the right story.
Built-in Storytelling – AI organizes insights into clear narratives, turning raw data into meaningful communication.
Export and Sharing Flexibility – Customize what to include and share polished infographics across any platform.
Actionable Insights – Go beyond visuals with AI-generated recommendations that inspire smarter decisions.
Top 10 AI Infographic Generators
1. Powerdrill Bloom
Powerdrill Bloom is a next-generation AI infographic generator that turns raw data or simple topics into compelling visual stories. Users can upload Excel, CSV, or PDF files—or just type in a topic—and Bloom automatically explores, analyzes, and visualizes the information. With strong storytelling capabilities and built-in actionable insights, Bloom helps you move from data to decisions in just a few clicks.
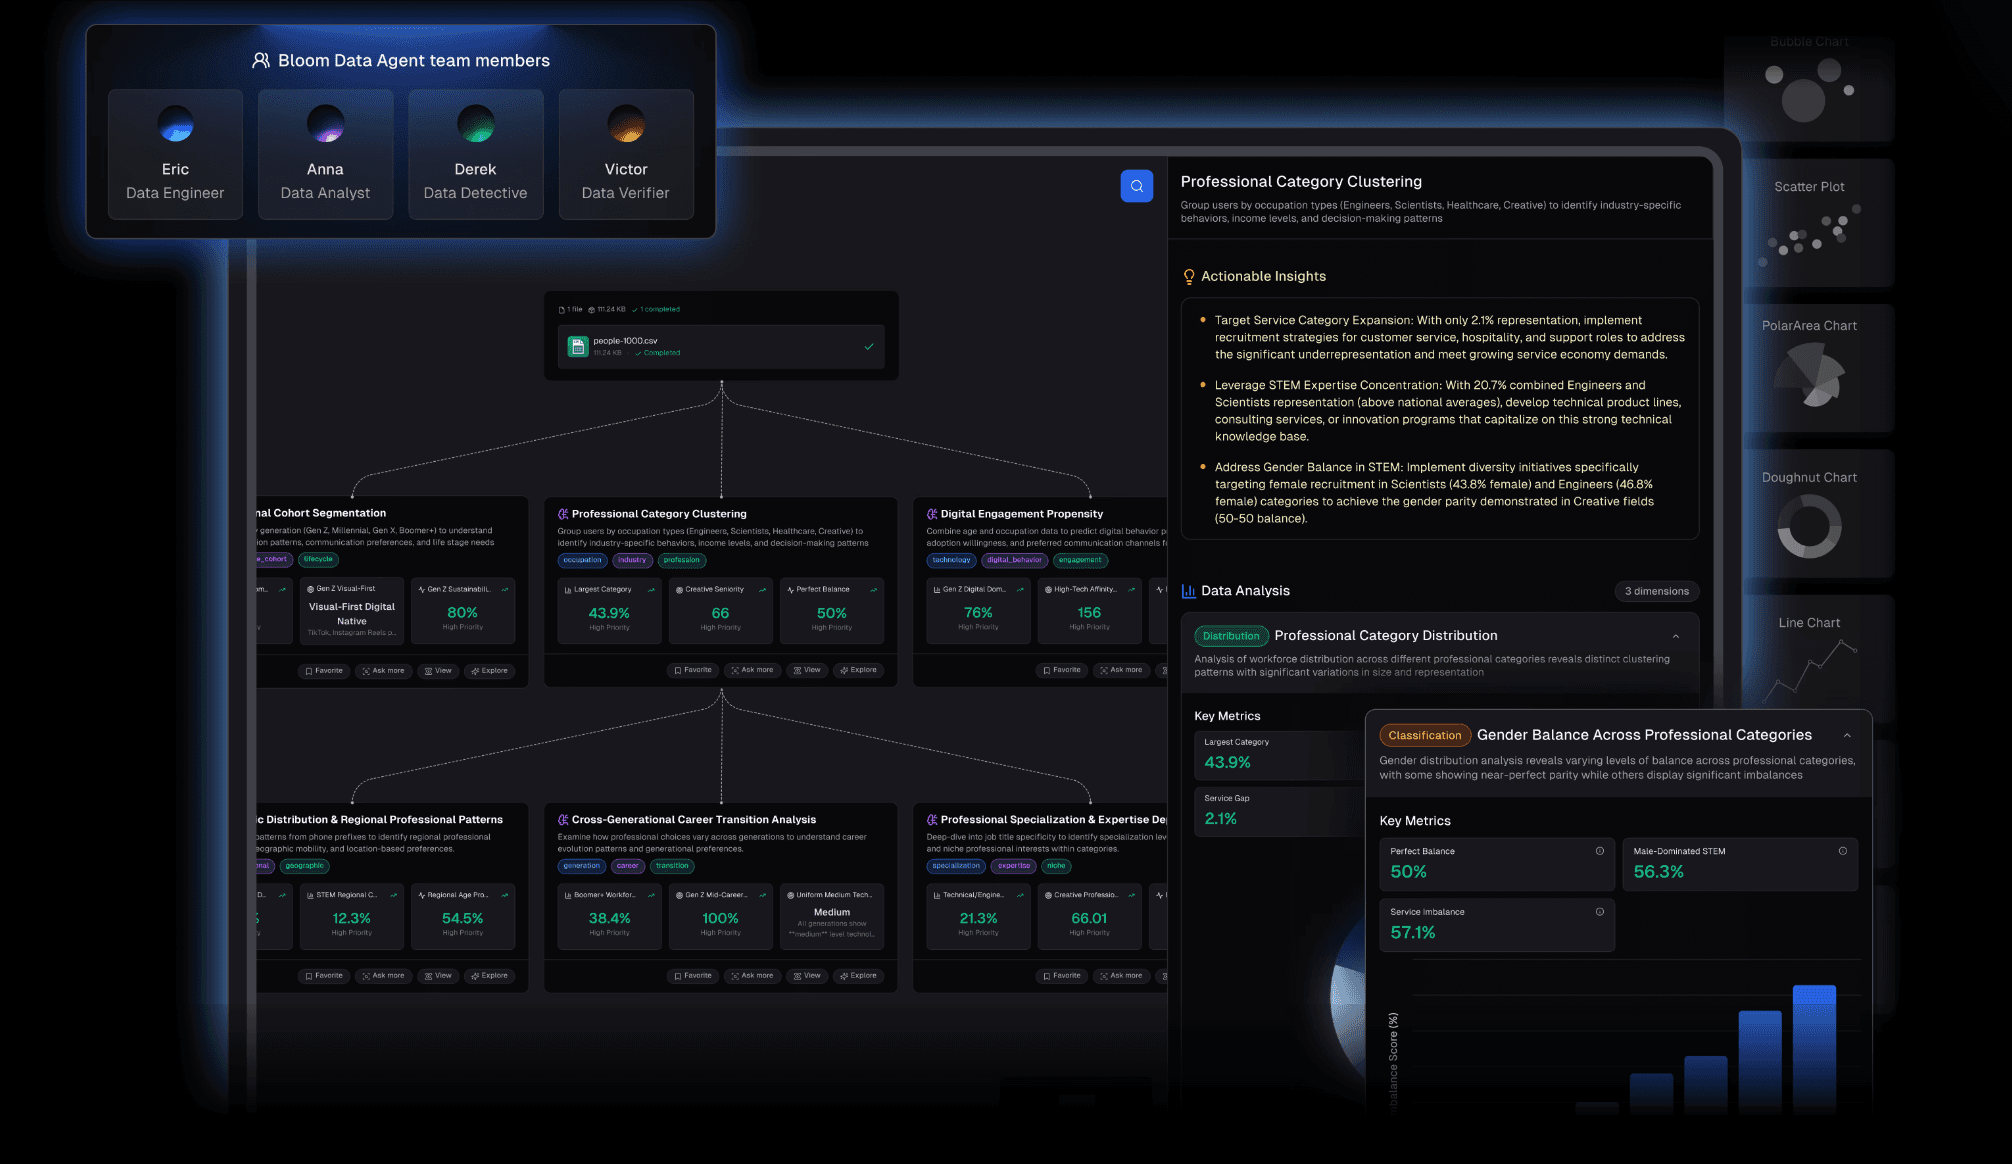
Key Features
Supports multiple data inputs: Excel, CSV, PDF, or topic-based generation
Wide chart variety including pie charts, line graphs, scatter plots, and heatmaps
Automated storytelling that highlights trends and connects insights
One-click export of professional infographics with customizable options
Actionable insights that inspire business decisions, not just visuals
Best For
Businesses, data analysts, marketers, and educators who need fast, professional infographics with insights that guide action.
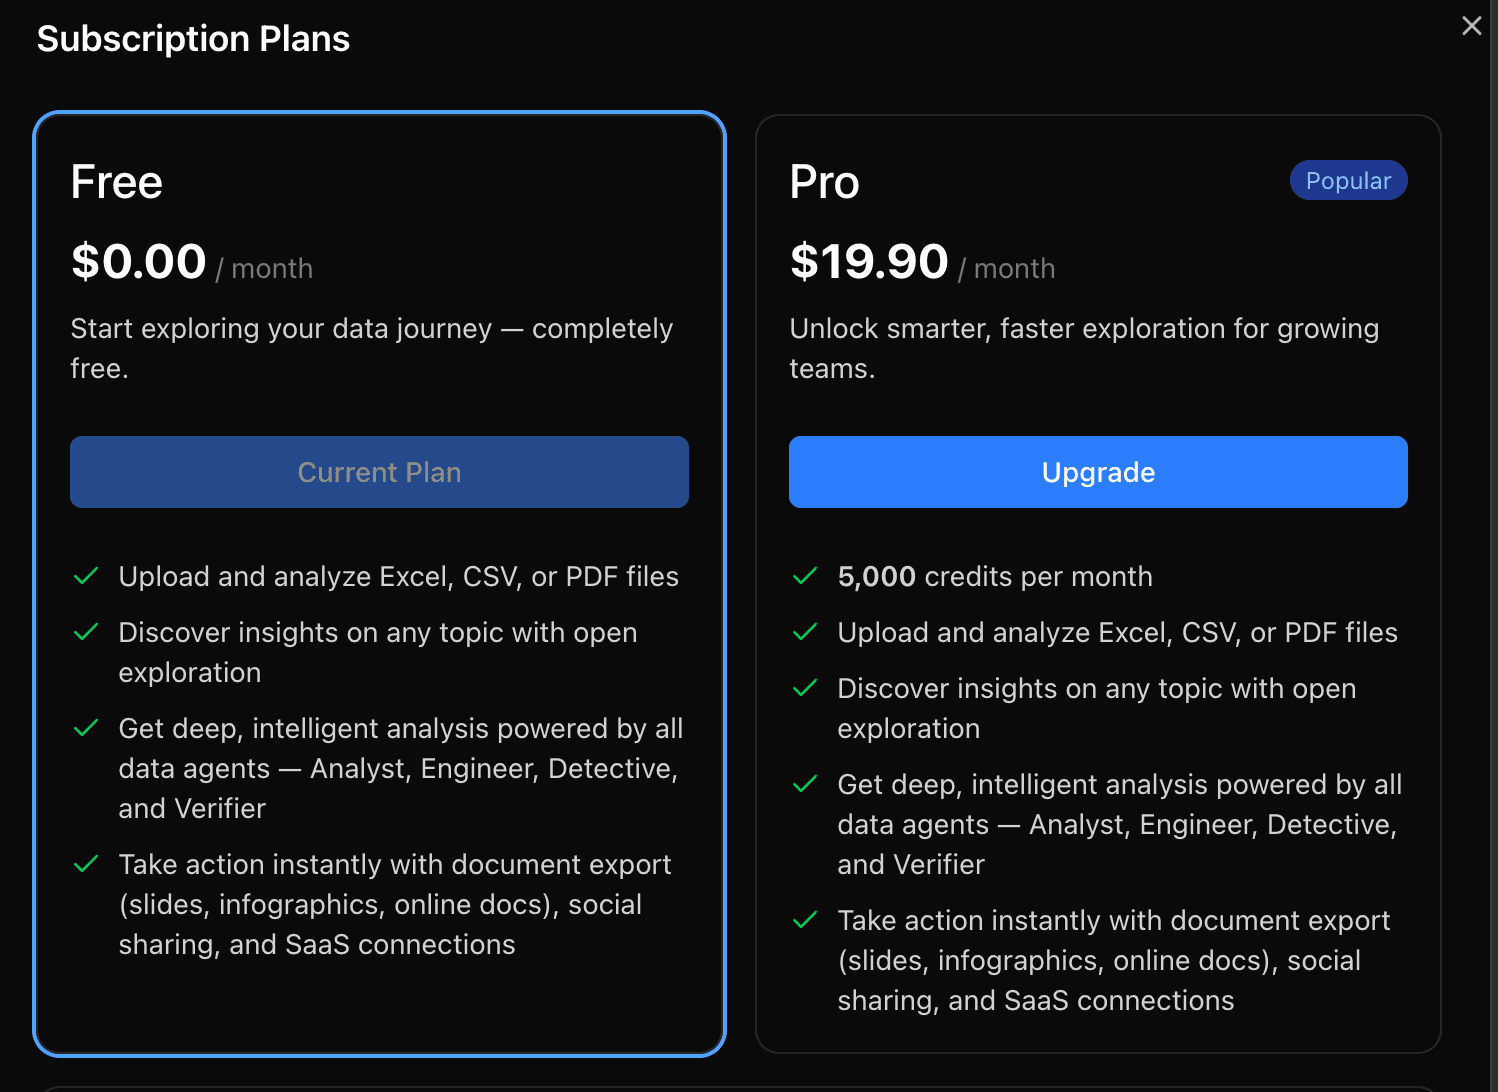
Pricing
Powerdrill Bloom offers simple, usage-based pricing with a Free plan to get started and a Pro plan for advanced AI exploration and higher productivity.
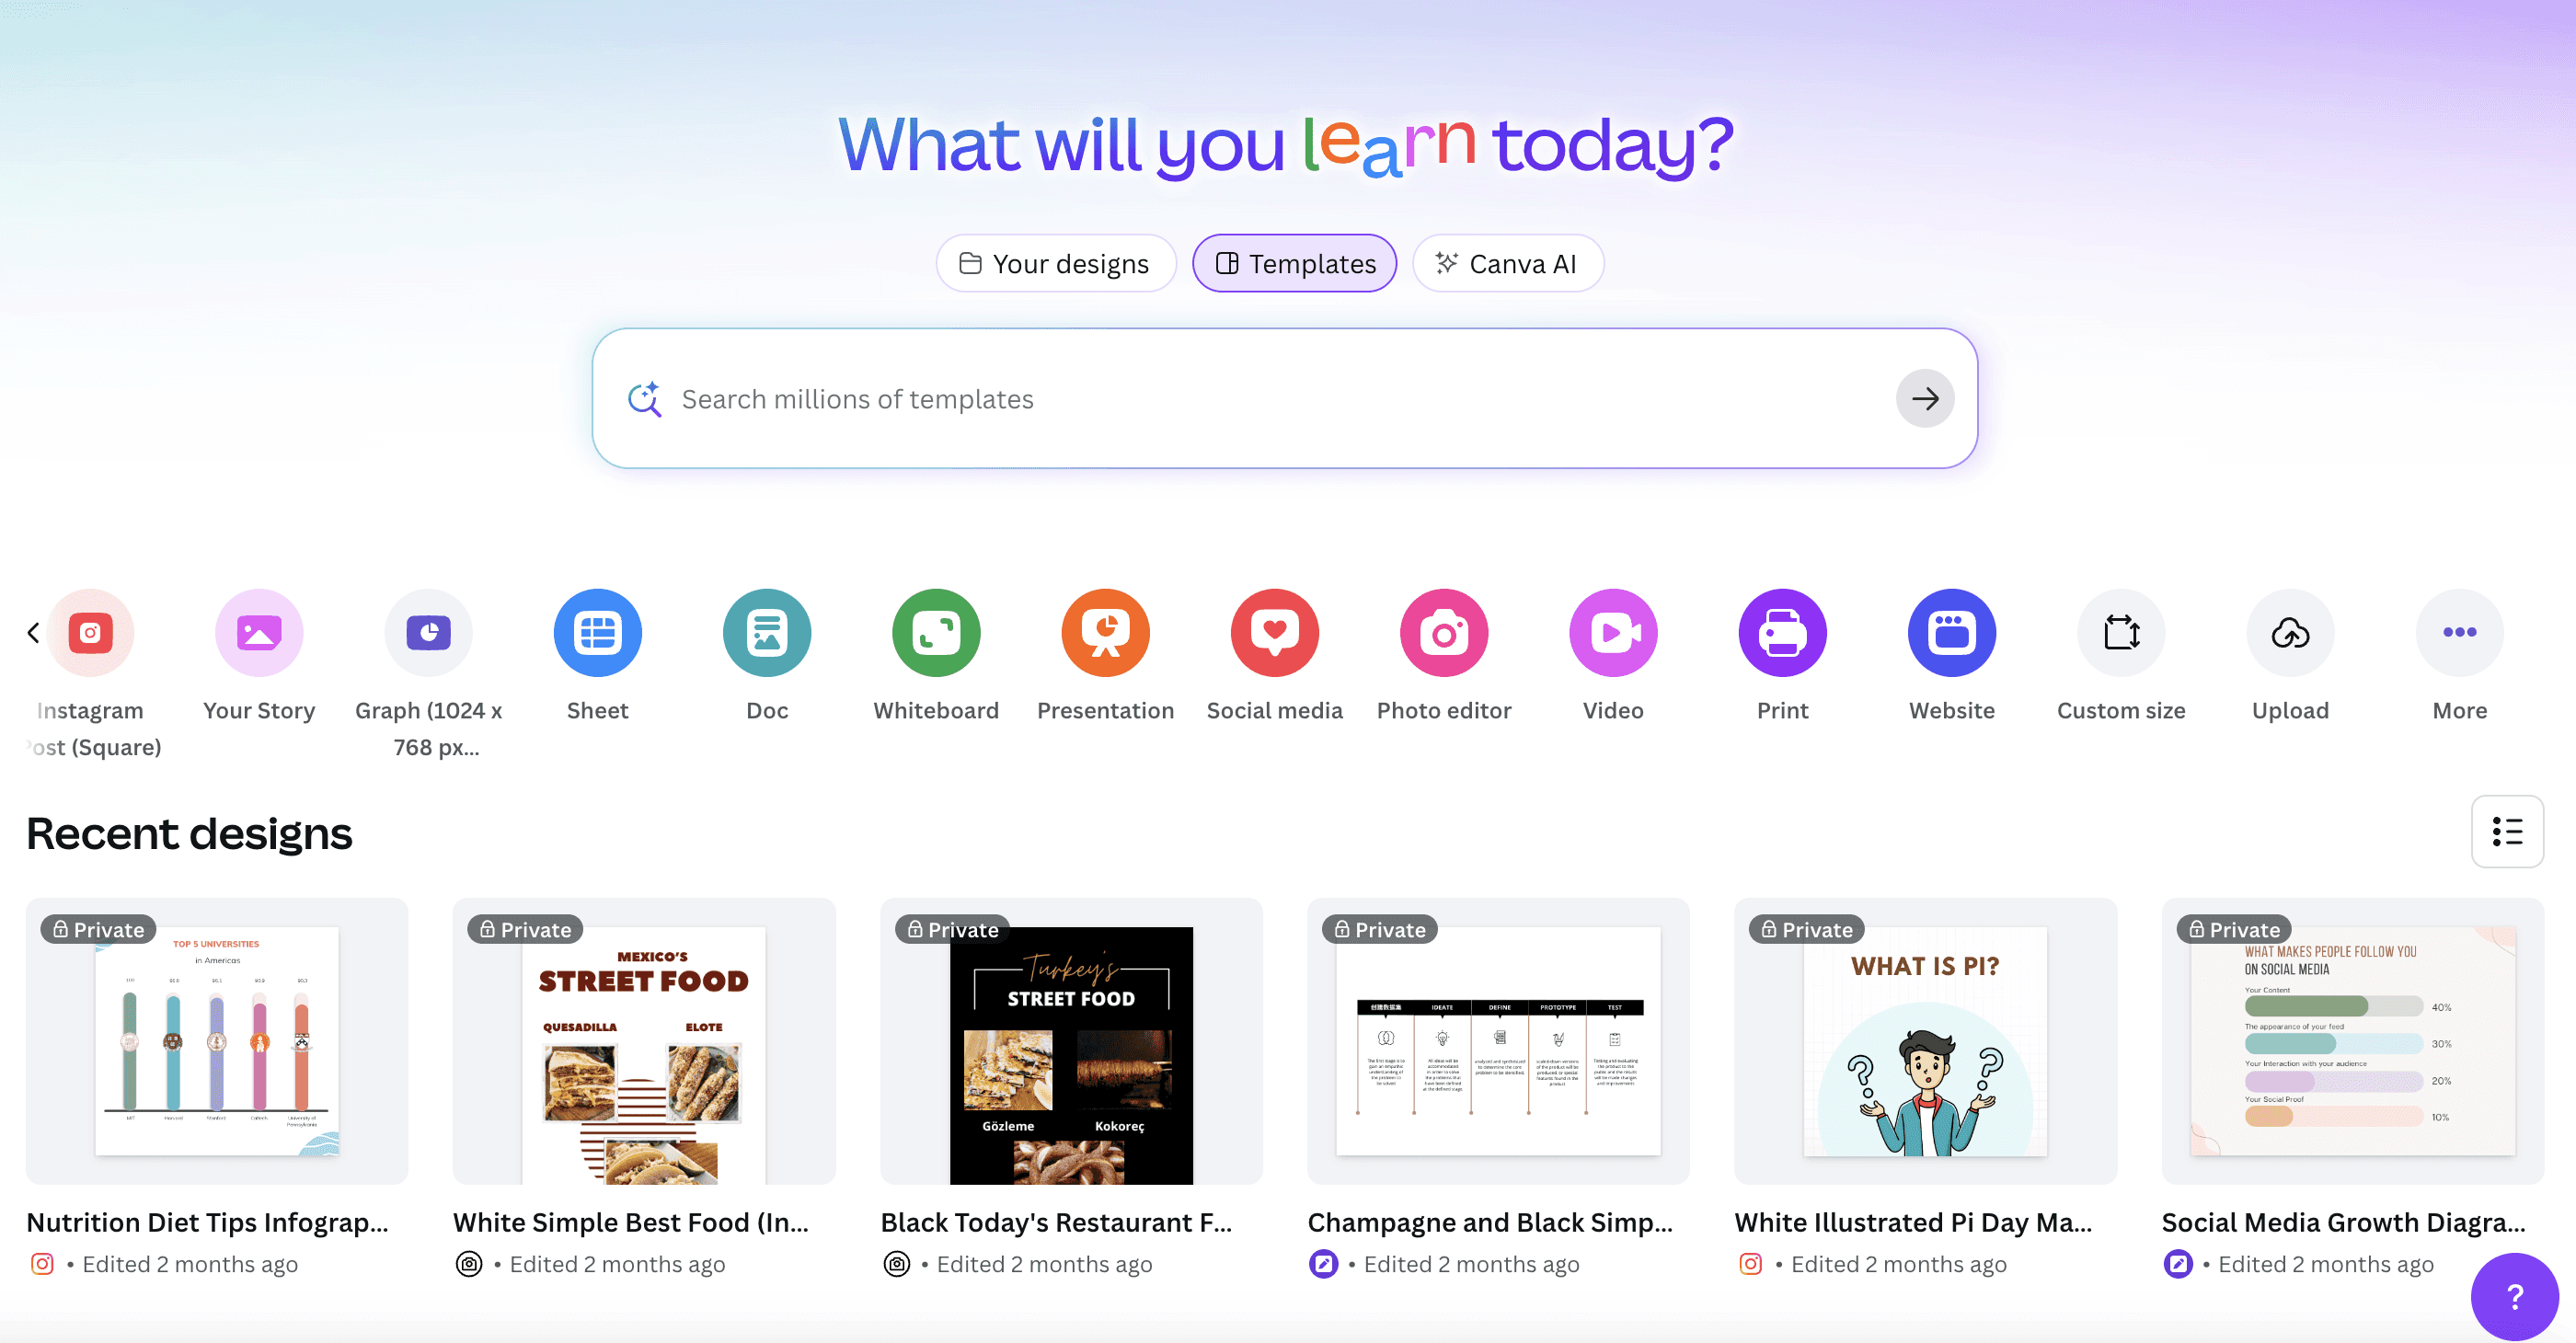
2. Canva (with AI Support)
Canva is one of the most popular online design platforms, and its infographic maker has recently integrated AI features. While it’s primarily a design-first tool, the AI support helps users auto-generate layouts, suggest design elements, and speed up the creative process. It’s best suited for those who want polished visuals with full creative control.
Key Features
Drag-and-drop editor with thousands of infographic templates
AI-powered design suggestions and auto-layout adjustments
Extensive media library including icons, photos, and illustrations
Collaboration features for teams to co-edit in real time
Easy export for presentations, social media, or print
Best For
Marketers, content creators, and educators who prioritize design flexibility and aesthetics over deep data analysis.
Pricing
Free plan with limited templates; Pro subscription starts at around $12.99/month for advanced features and assets.
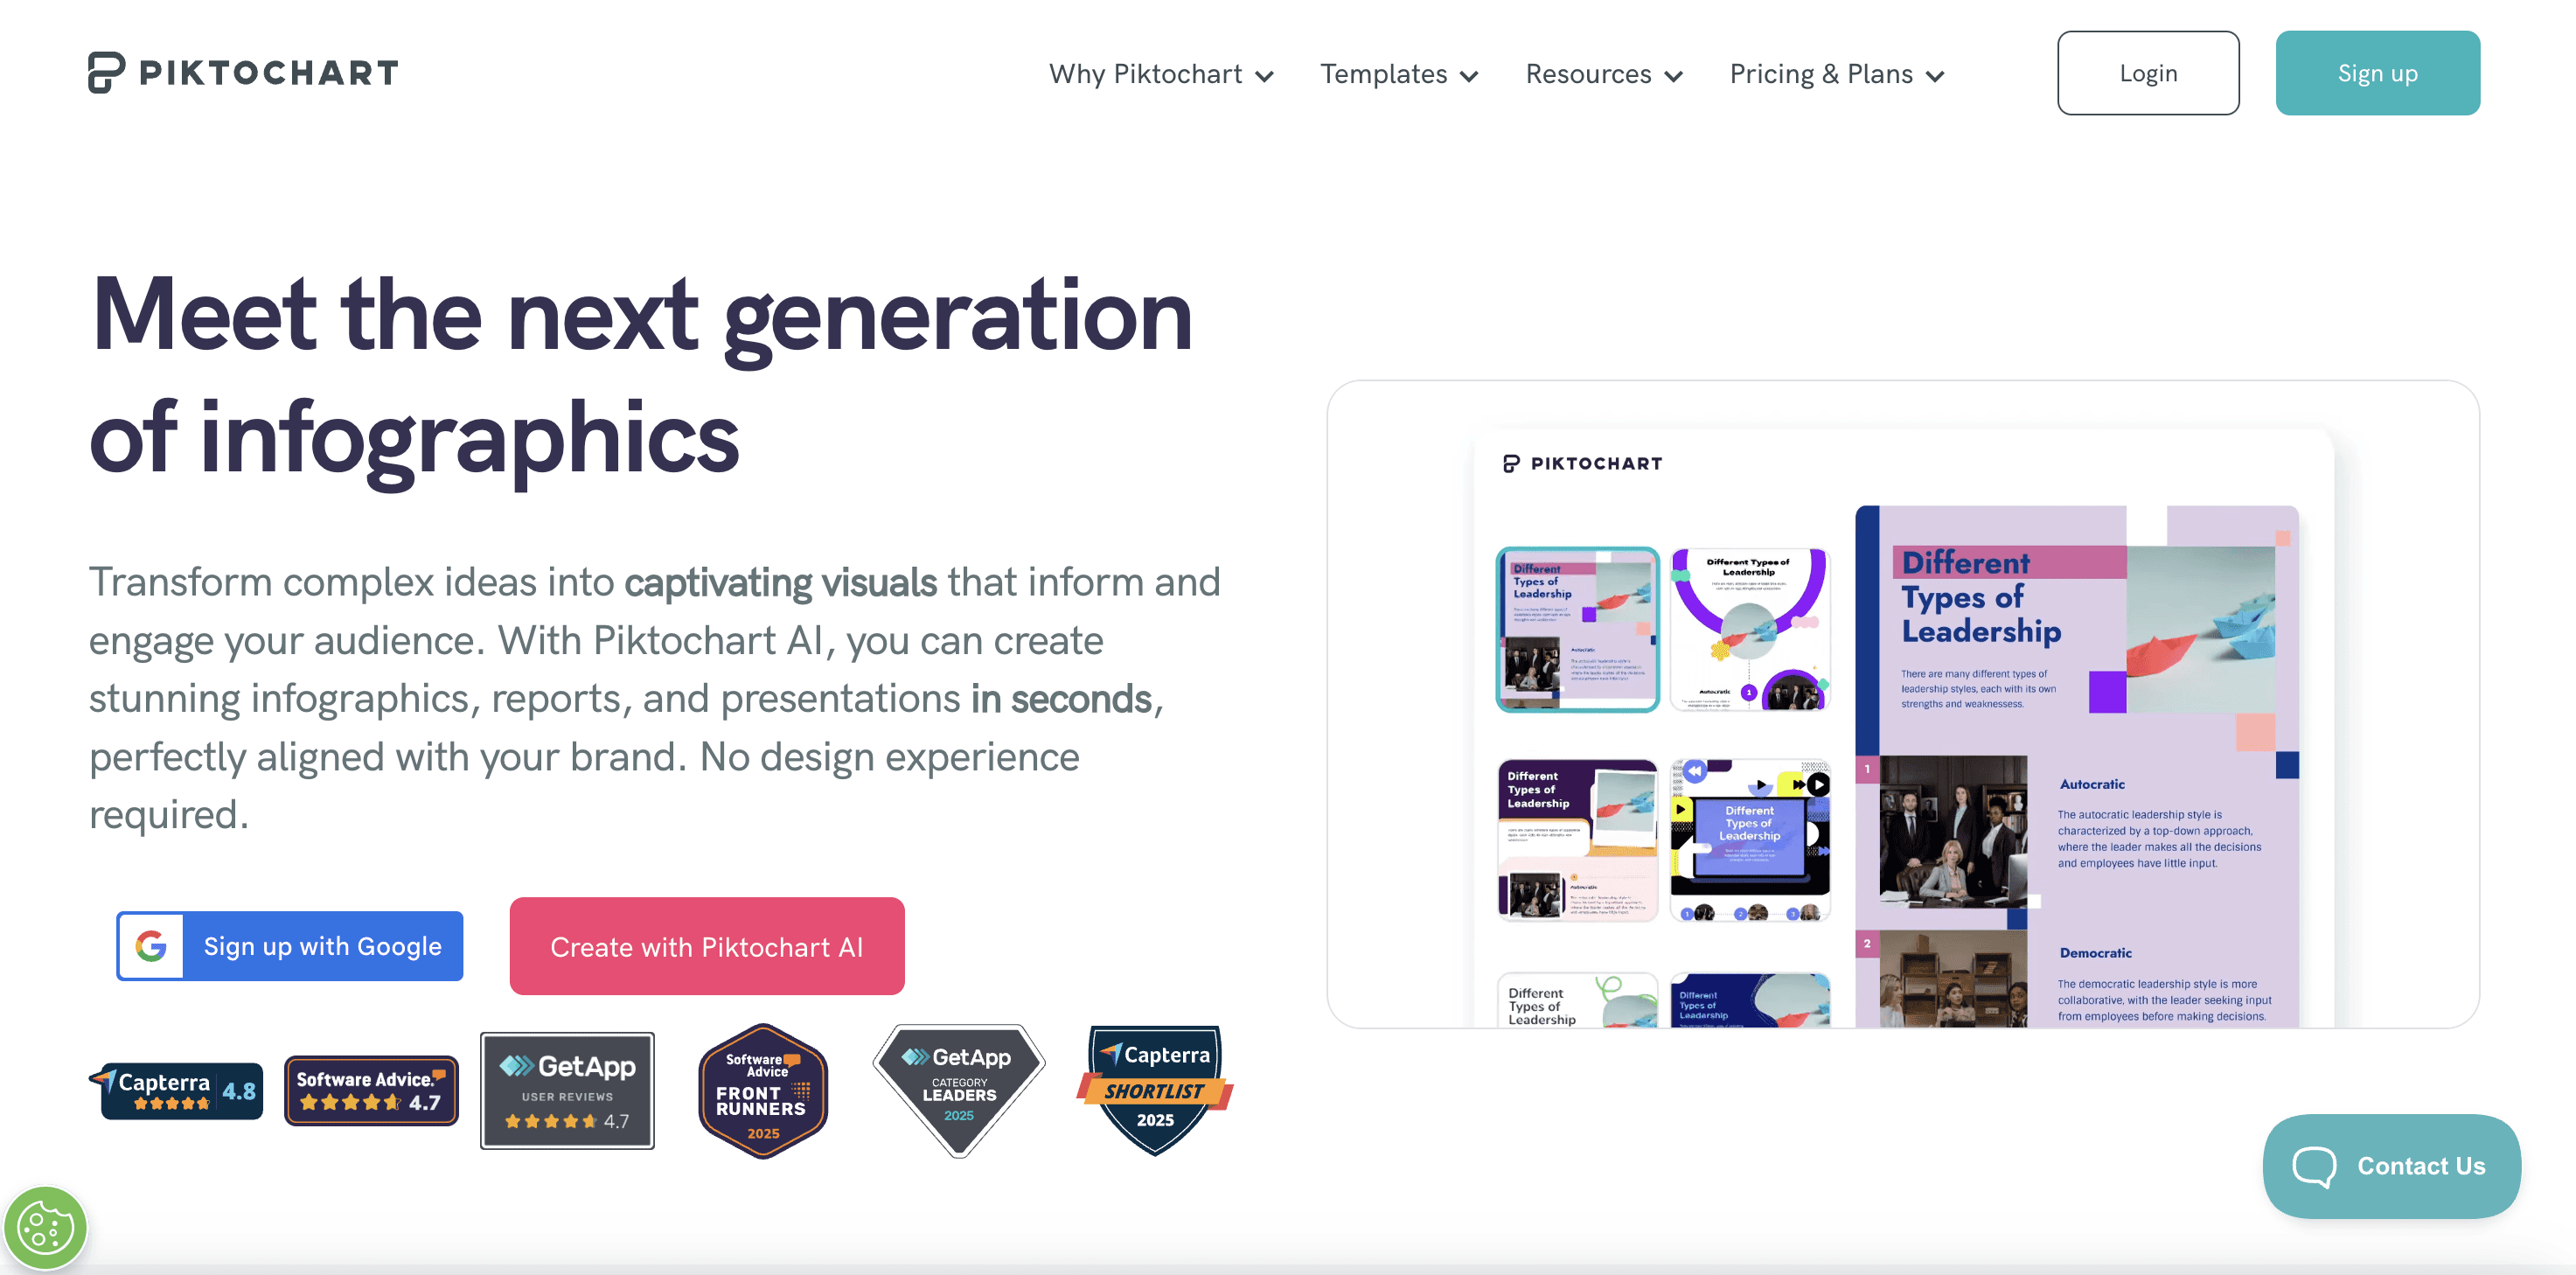
3. Piktochart
Piktochart is a well-established infographic and presentation tool that makes visual communication simple. Unlike Canva, it leans more toward data-driven visuals, with built-in chart tools and templates designed for business reporting and storytelling. It’s a good balance between usability and analytical capability.
Key Features
Ready-made templates tailored for infographics, reports, and presentations
Built-in chart and graph tools for quick data visualization
Drag-and-drop interface with easy customization
Brand kit features for consistent design across teams
Export options for PDF, PNG, and presentations
Best For
Business professionals, educators, and small teams looking for a user-friendly tool to turn data into clear and engaging visuals.
Pricing
Free version with basic features; Pro plan starts at $14/month with advanced templates and export options.
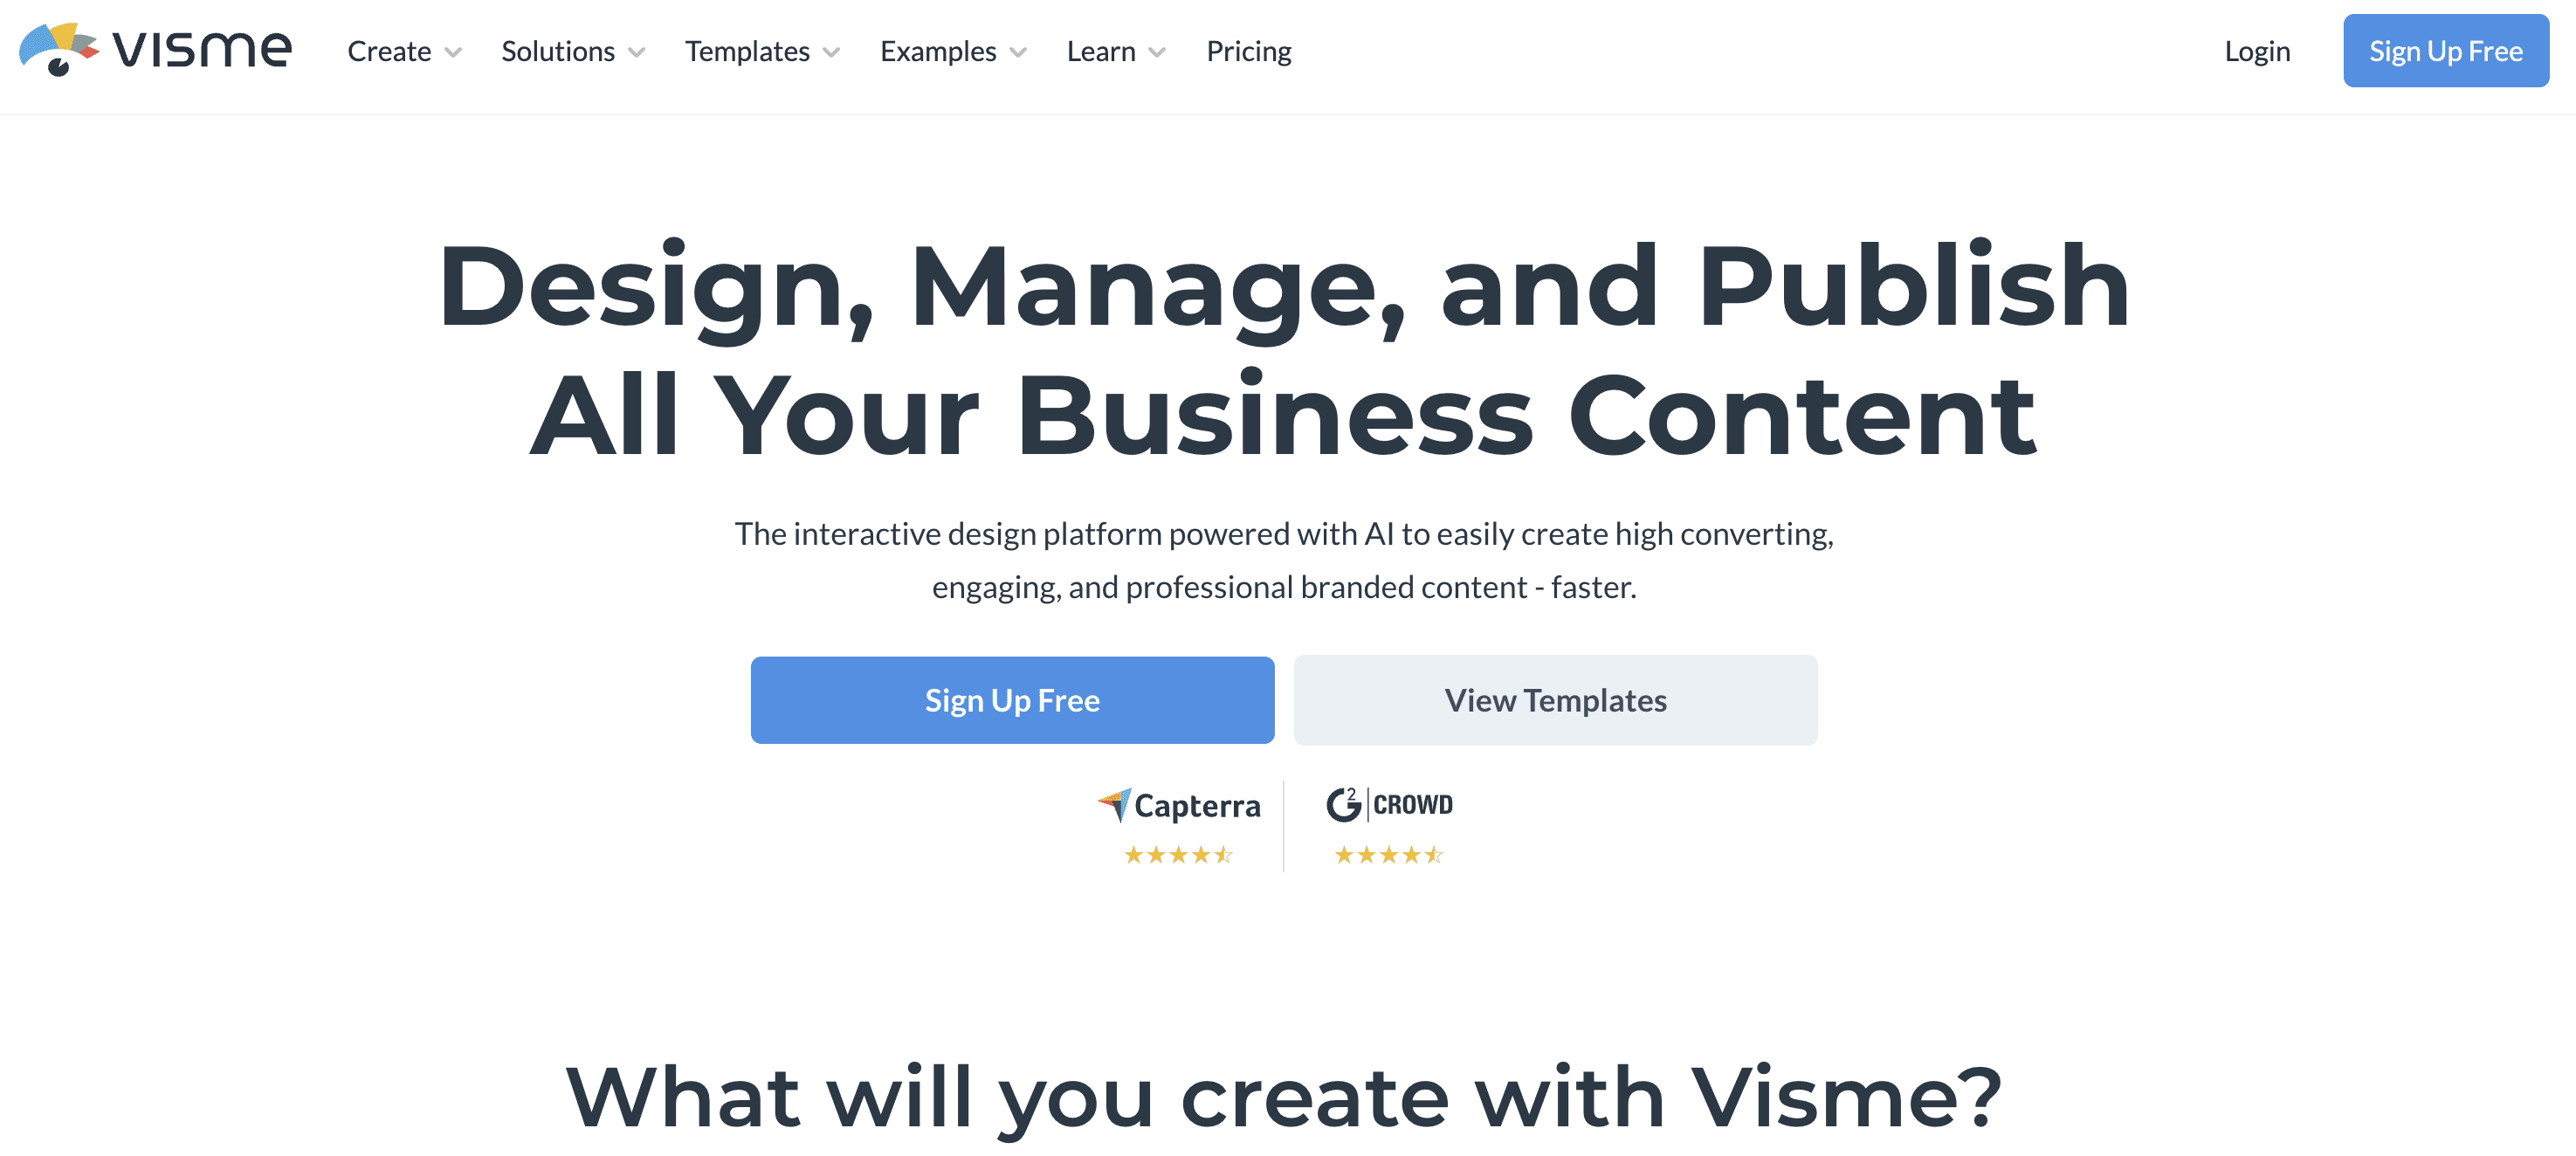
4. Visme
Visme is a versatile design and presentation platform that combines infographic creation, interactive content, and data visualization. It’s more advanced than many design-first tools, offering strong branding features and the ability to create highly interactive visuals for both online and offline use.
Key Features
Wide library of infographic and presentation templates
Data visualization widgets including charts, maps, and diagrams
Interactivity options like clickable elements, hover effects, and animations
Brand kit management for consistent colors, fonts, and logos
Collaboration tools for teams to design and review together
Best For
Marketing teams, enterprises, and educators who need professional, interactive infographics and branded visual content.
Pricing
Free plan available with limited templates; paid plans start at around $12.25/month for individuals and higher tiers for teams.
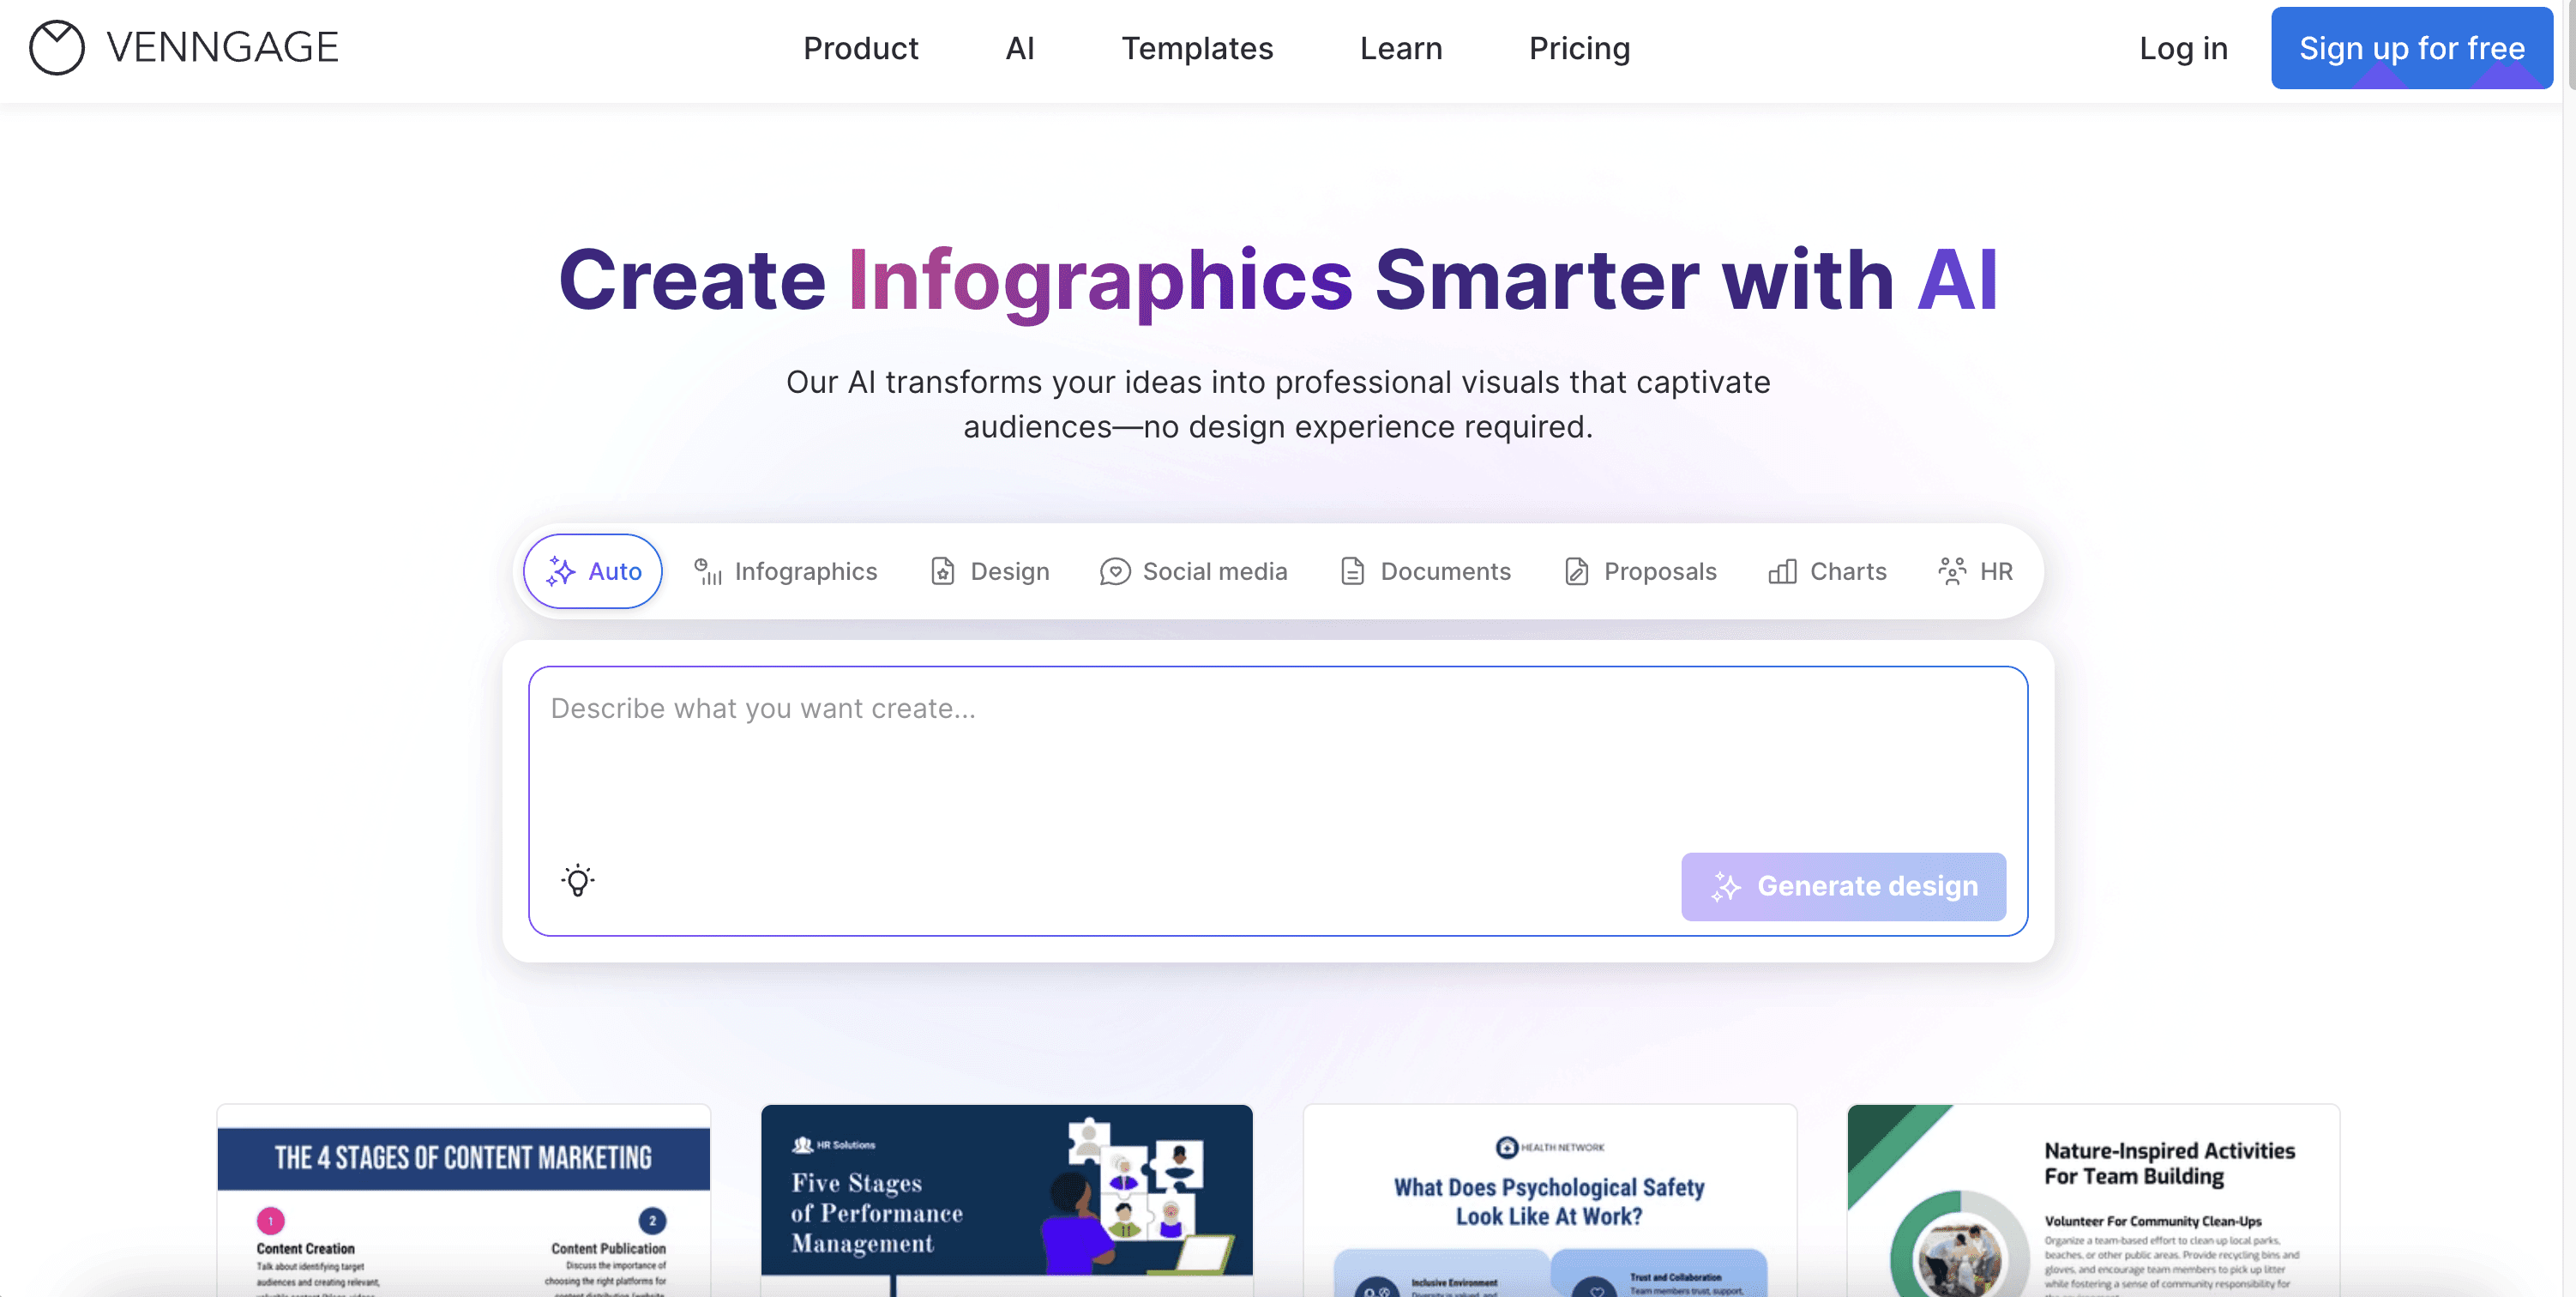
5. Venngage
Venngage is an infographic-focused platform designed to help non-designers create professional visuals quickly. With a strong emphasis on templates and customization, it’s widely used for business reports, marketing materials, and communication assets. Its intuitive editor makes it especially accessible for beginners.
Key Features
Large collection of infographic templates tailored for business use cases
Easy drag-and-drop editor with customizable charts and icons
Branding features to apply company logos, fonts, and color schemes
Collaboration and commenting tools for team projects
Export in multiple formats including PNG, PDF, and interactive links
Best For
Business professionals, marketers, and educators who want simple, customizable infographics without advanced design skills.
Pricing
Free version with limited templates; paid plans start at around $10/month, with premium features available in higher tiers.
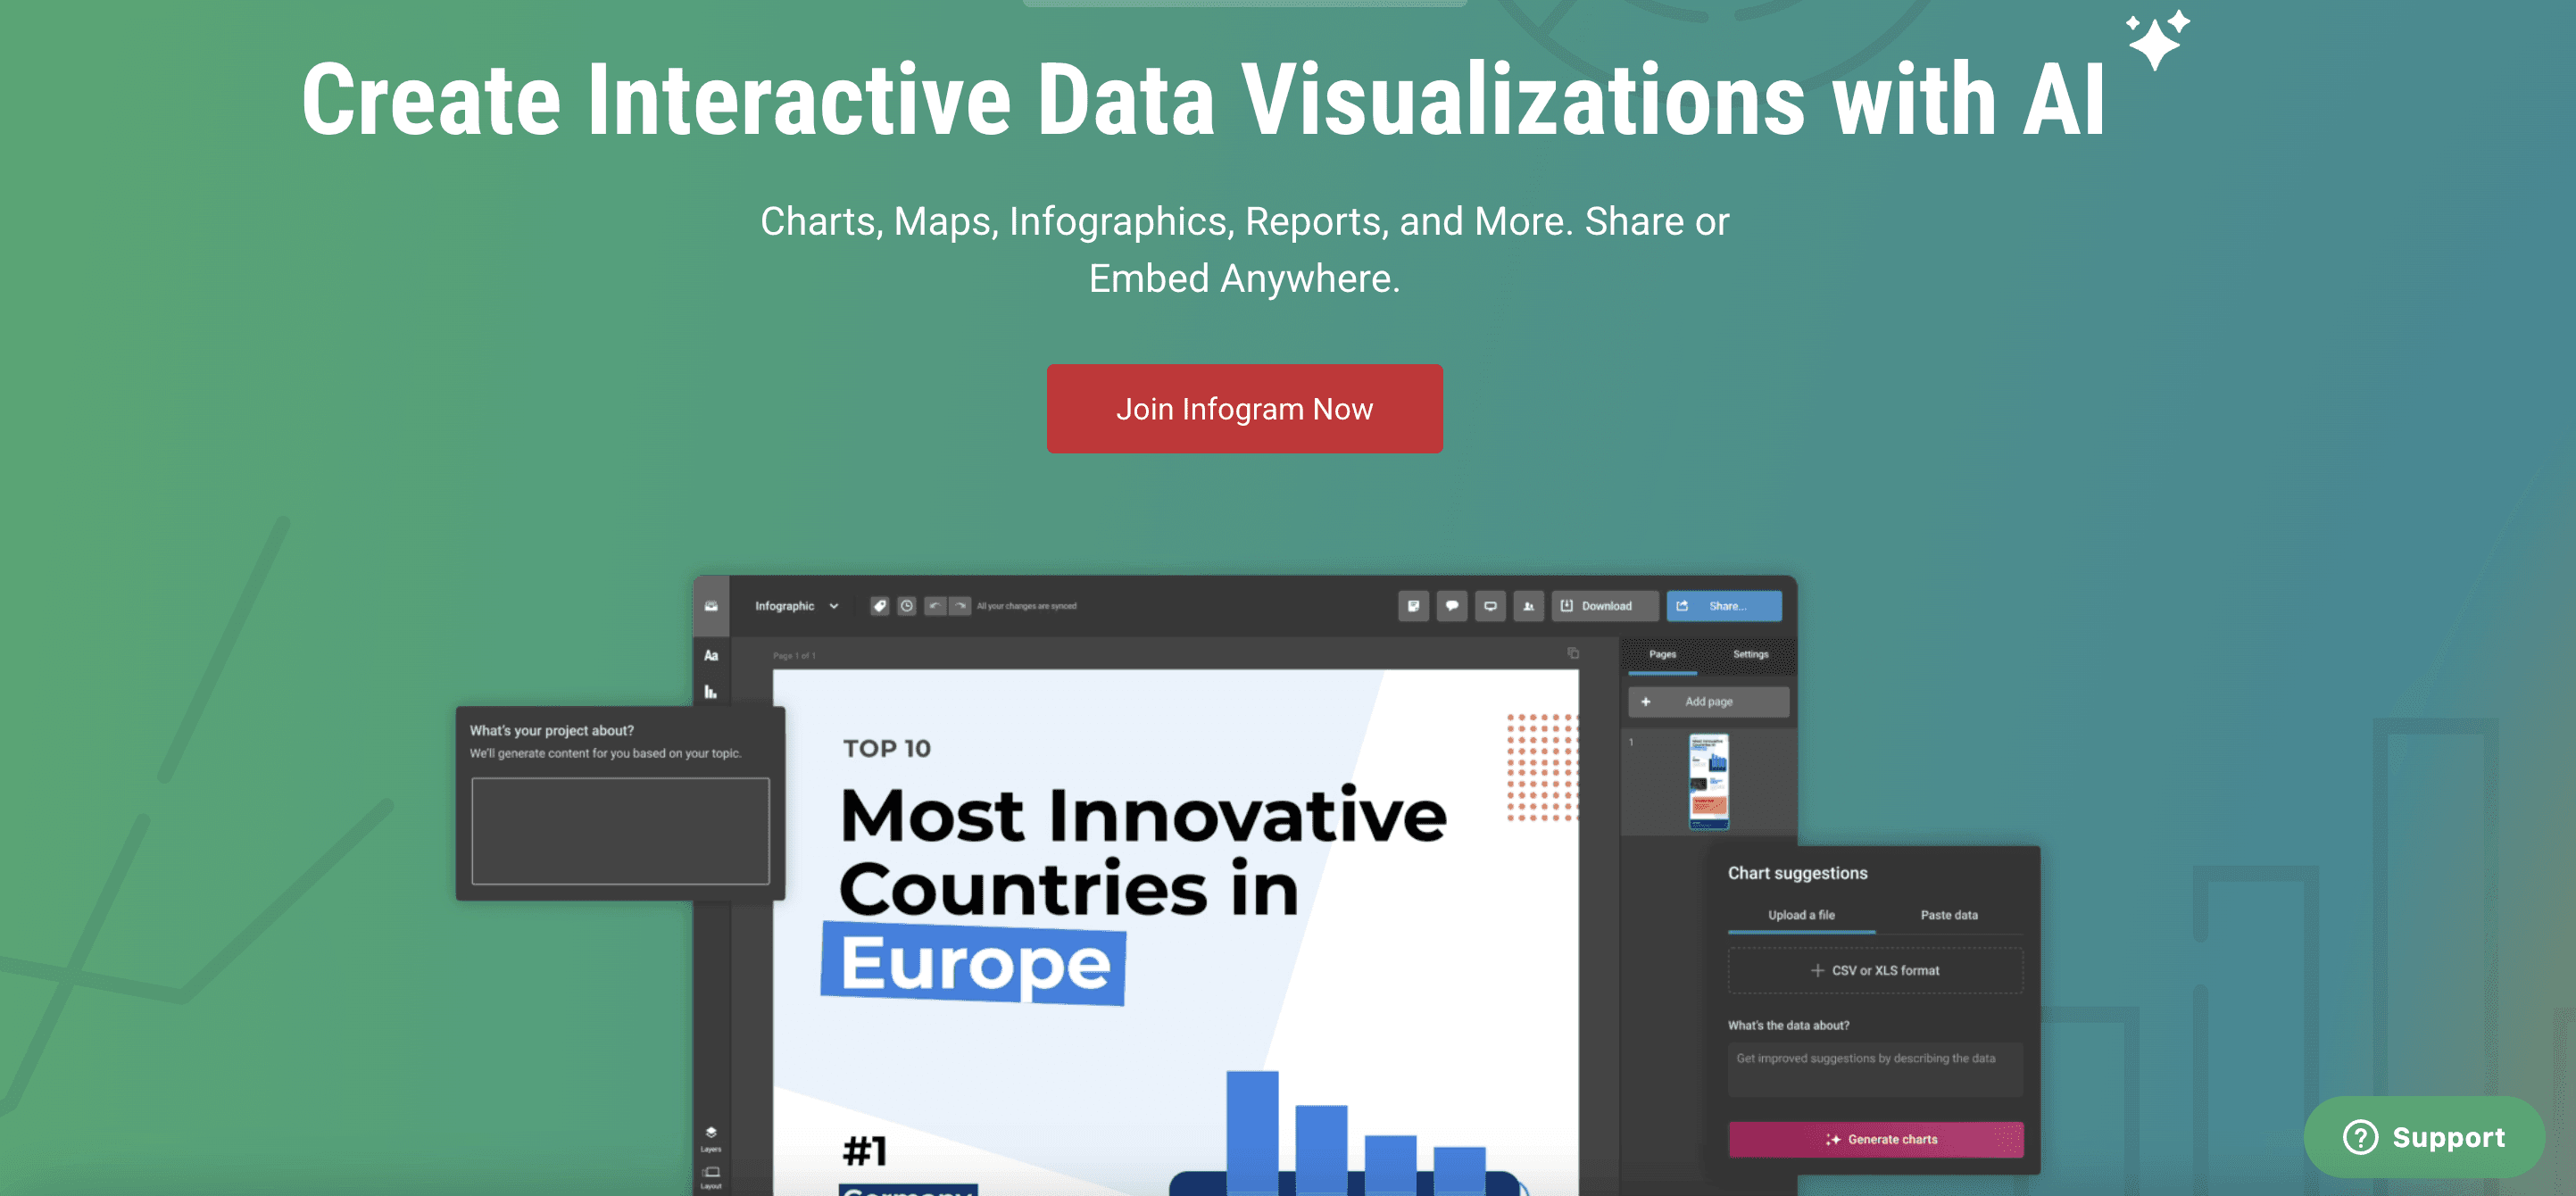
6. Infogram
Infogram is a data visualization and infographic tool built for professionals who want to turn complex datasets into engaging visuals. It emphasizes charting and analytics features, making it a strong choice for reports, dashboards, and data-heavy presentations.
Key Features
Wide range of charts, maps, and data widgets for in-depth visualization
Real-time data import from Excel, Google Sheets, and cloud integrations
Interactive features such as tooltips and clickable elements
Drag-and-drop editor with infographic and dashboard templates
Easy sharing via links, embeds, or export to PNG/PDF formats
Best For
Data analysts, journalists, and business teams who need to communicate complex information clearly with charts and interactive visuals.
Pricing
Free plan with basic charts; paid plans start at around $19/month with more templates, branding, and advanced export options.
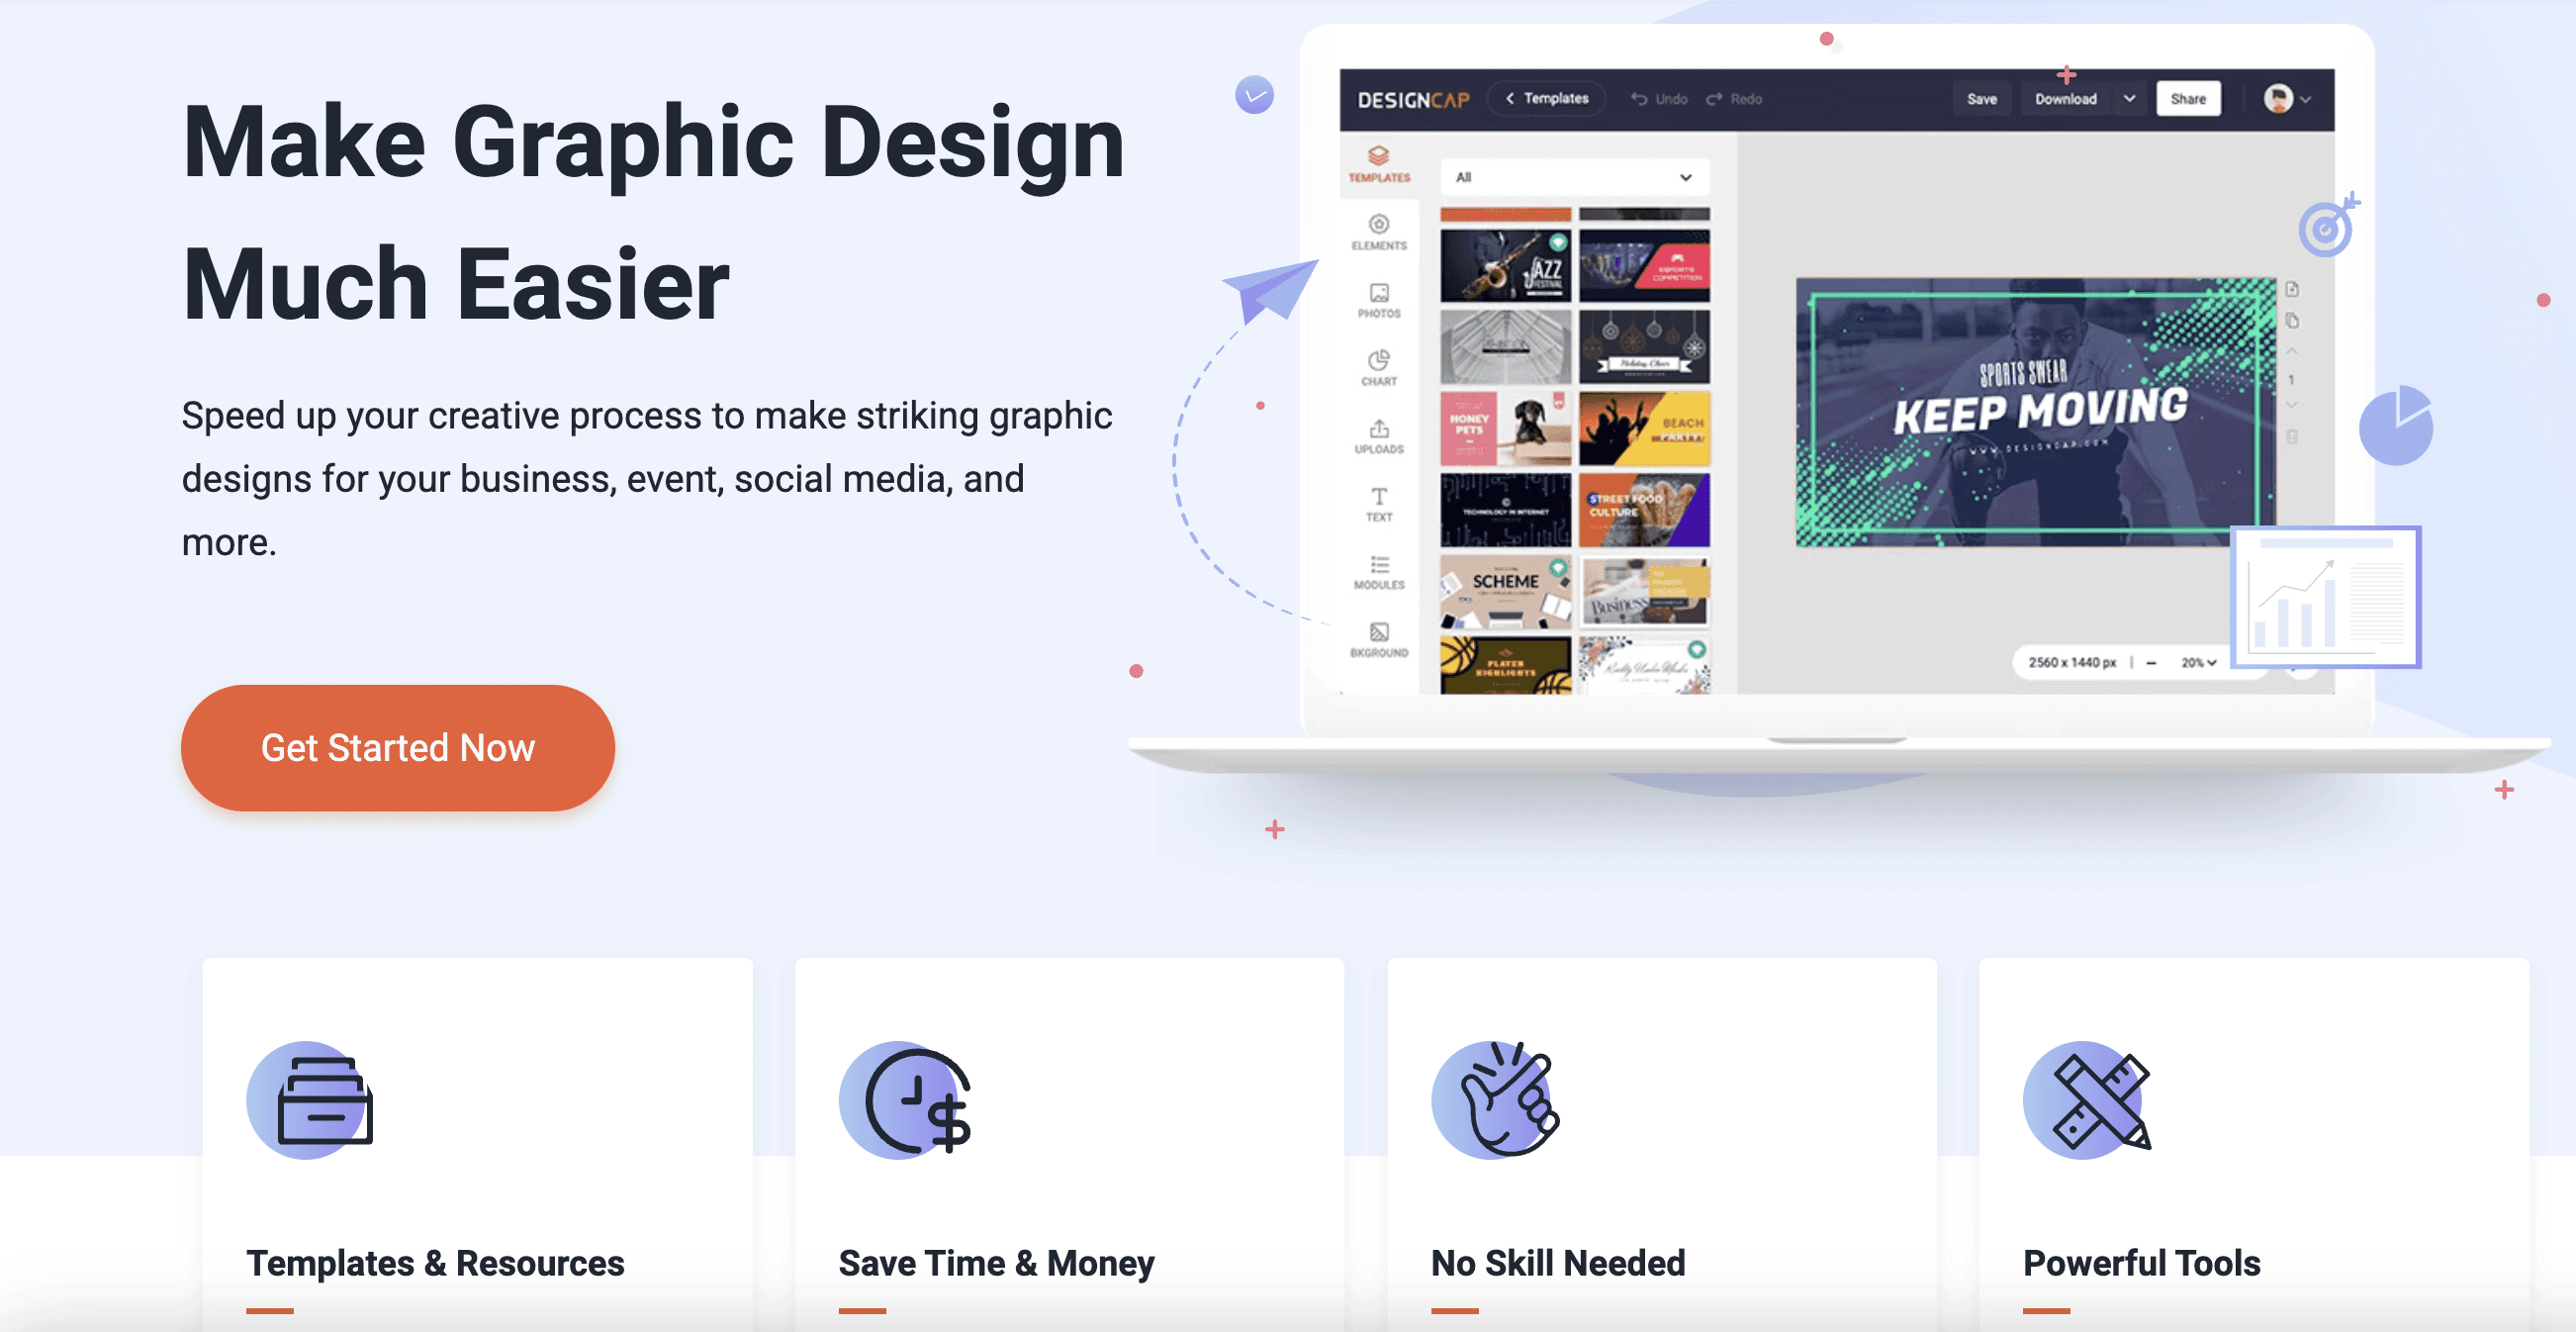
7. DesignCap
DesignCap is a lightweight, web-based infographic and graphic design tool that focuses on simplicity and speed. It provides a broad selection of ready-made templates, making it ideal for users who want to create clean visuals quickly without a steep learning curve.
Key Features
Hundreds of infographic, report, and presentation templates
Built-in chart tools for simple data visualization
Customizable elements including icons, fonts, and background images
Easy-to-use drag-and-drop interface suitable for beginners
Export options for high-quality images and PDFs
Best For
Small businesses, educators, and individuals who need quick infographic creation without complex features.
Pricing
Free version with limited features; paid plans start at around $4.99/month, offering full access to templates and advanced export options.
8. Adobe Express (AI Features)
Adobe Express, formerly Adobe Spark, is Adobe’s lightweight design tool that integrates AI-powered features to simplify content creation. It brings Adobe’s design credibility to a user-friendly platform, making infographic creation accessible to non-designers while still offering professional-quality results.
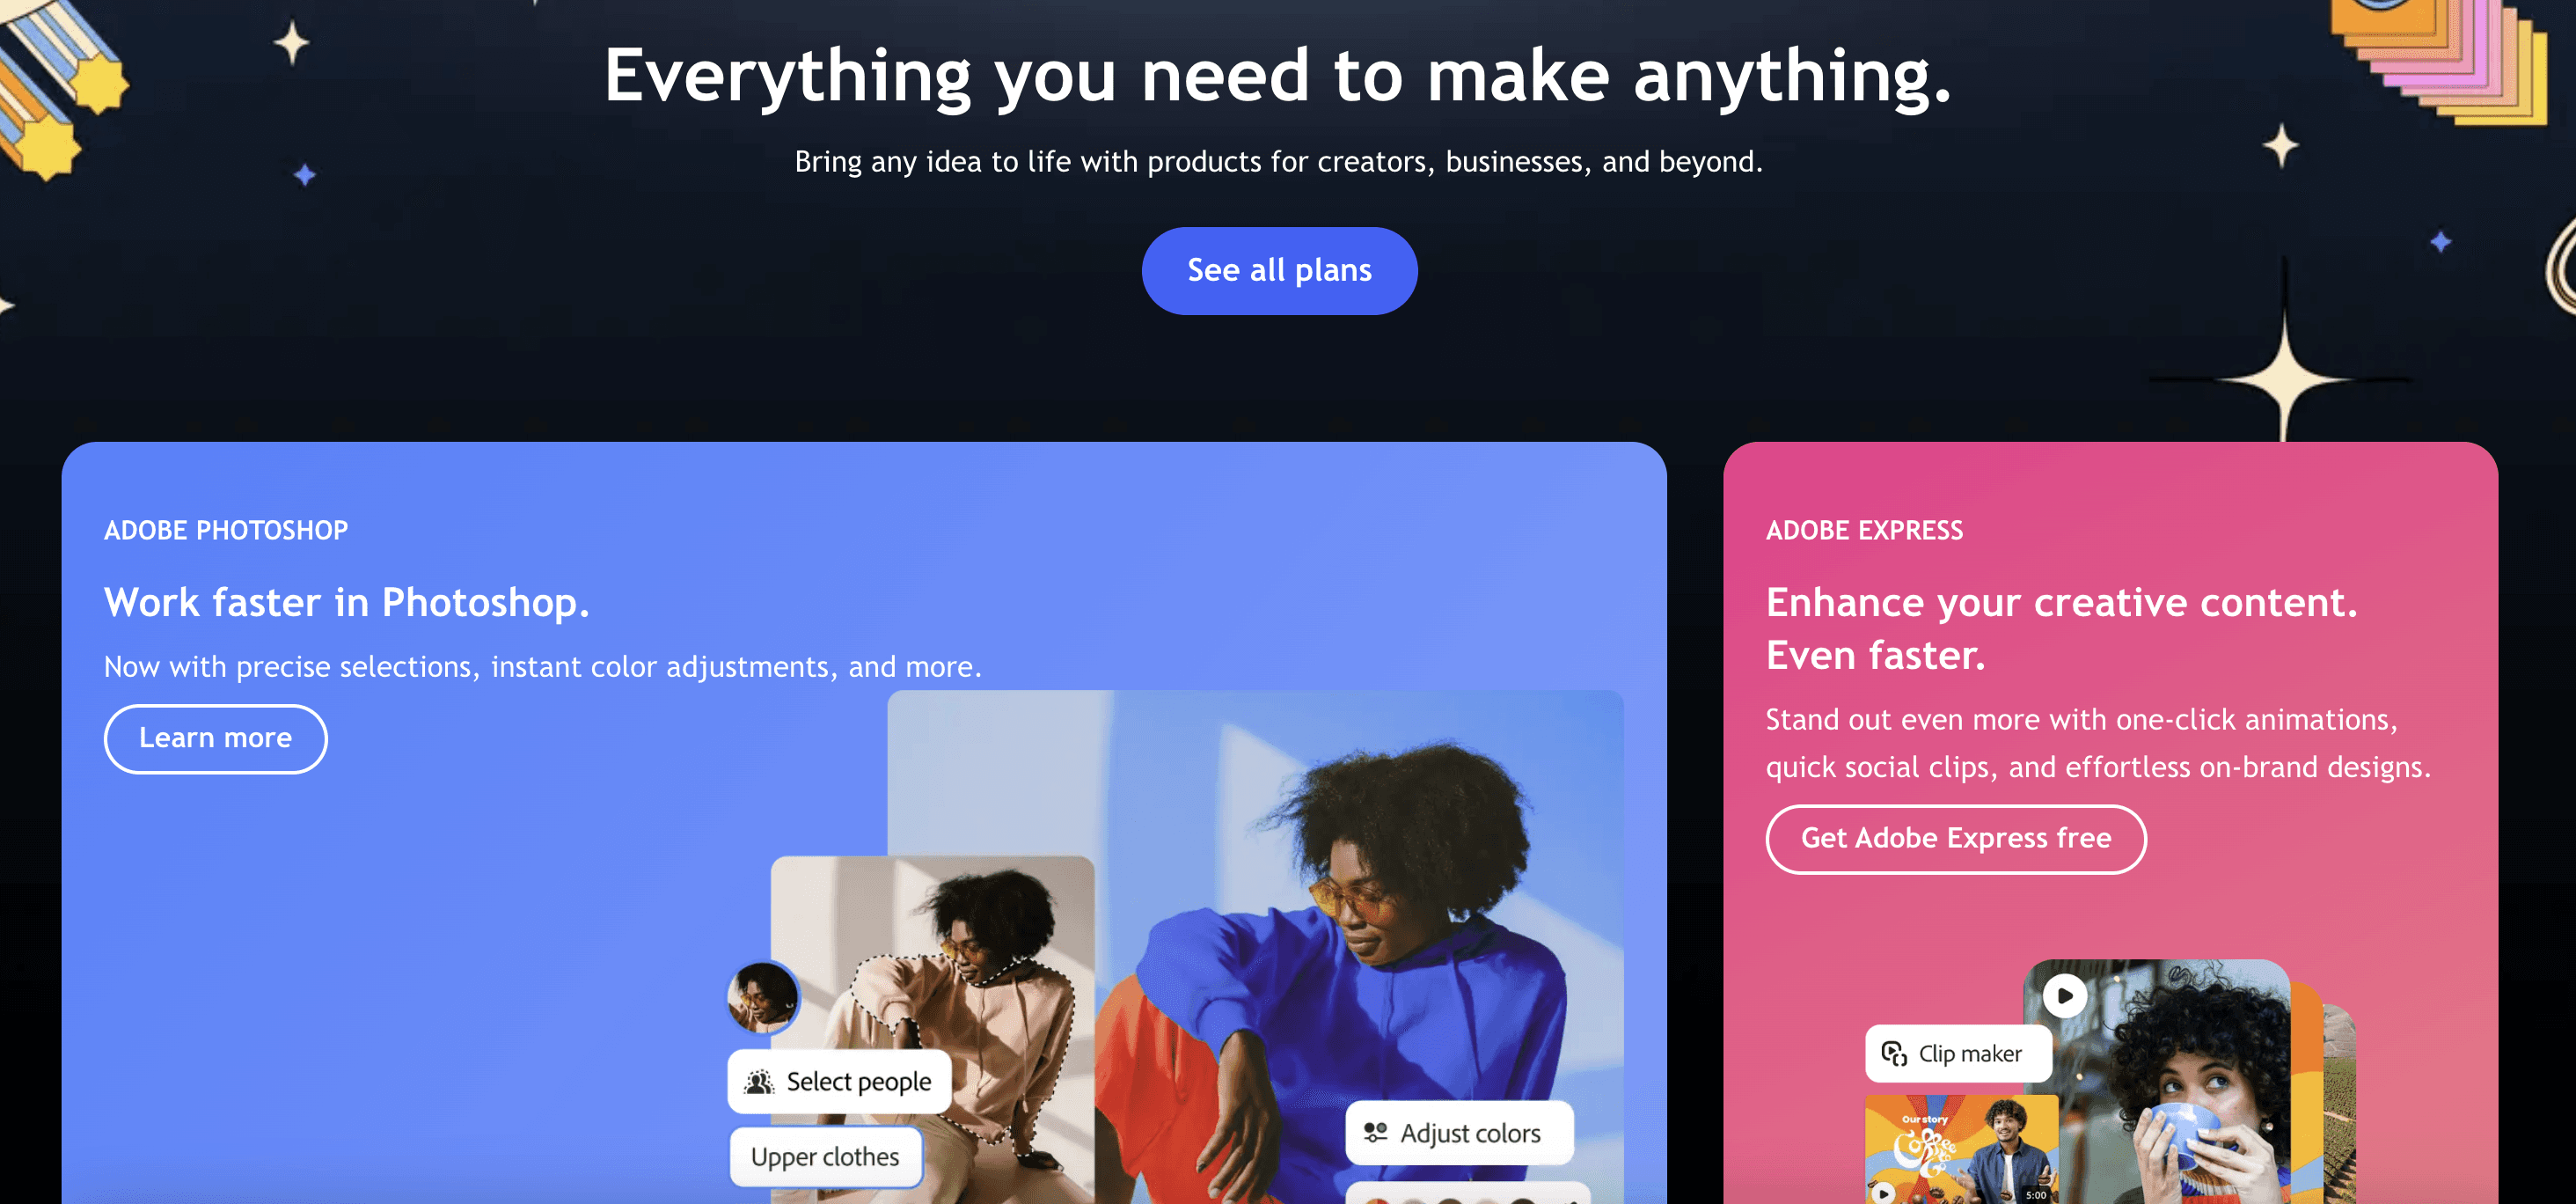
Key Features
AI-assisted design templates for infographics, posters, and social media content
Integration with Adobe Stock for access to millions of photos, icons, and graphics
Brand kit for applying company colors, fonts, and logos consistently
Cross-device support with seamless syncing across desktop and mobile
Easy export for web, social media, or print-ready formats
Best For
Creative professionals, marketers, and small teams who want Adobe-quality visuals with an easier learning curve than Photoshop or Illustrator.
Pricing
Free plan available with core features; Premium plan starts at around $9.99/month, offering expanded assets and branding tools.
9. 2slides
2slides is a modern AI presentation agent that transforms user input into structured, visually consistent slides. It distinguishes itself by offering both a web-based interface for casual users and developer-focused tools, such as an API and MCP (Model Context Protocol) Server, for integrating slide generation directly into custom AI workflows and applications.
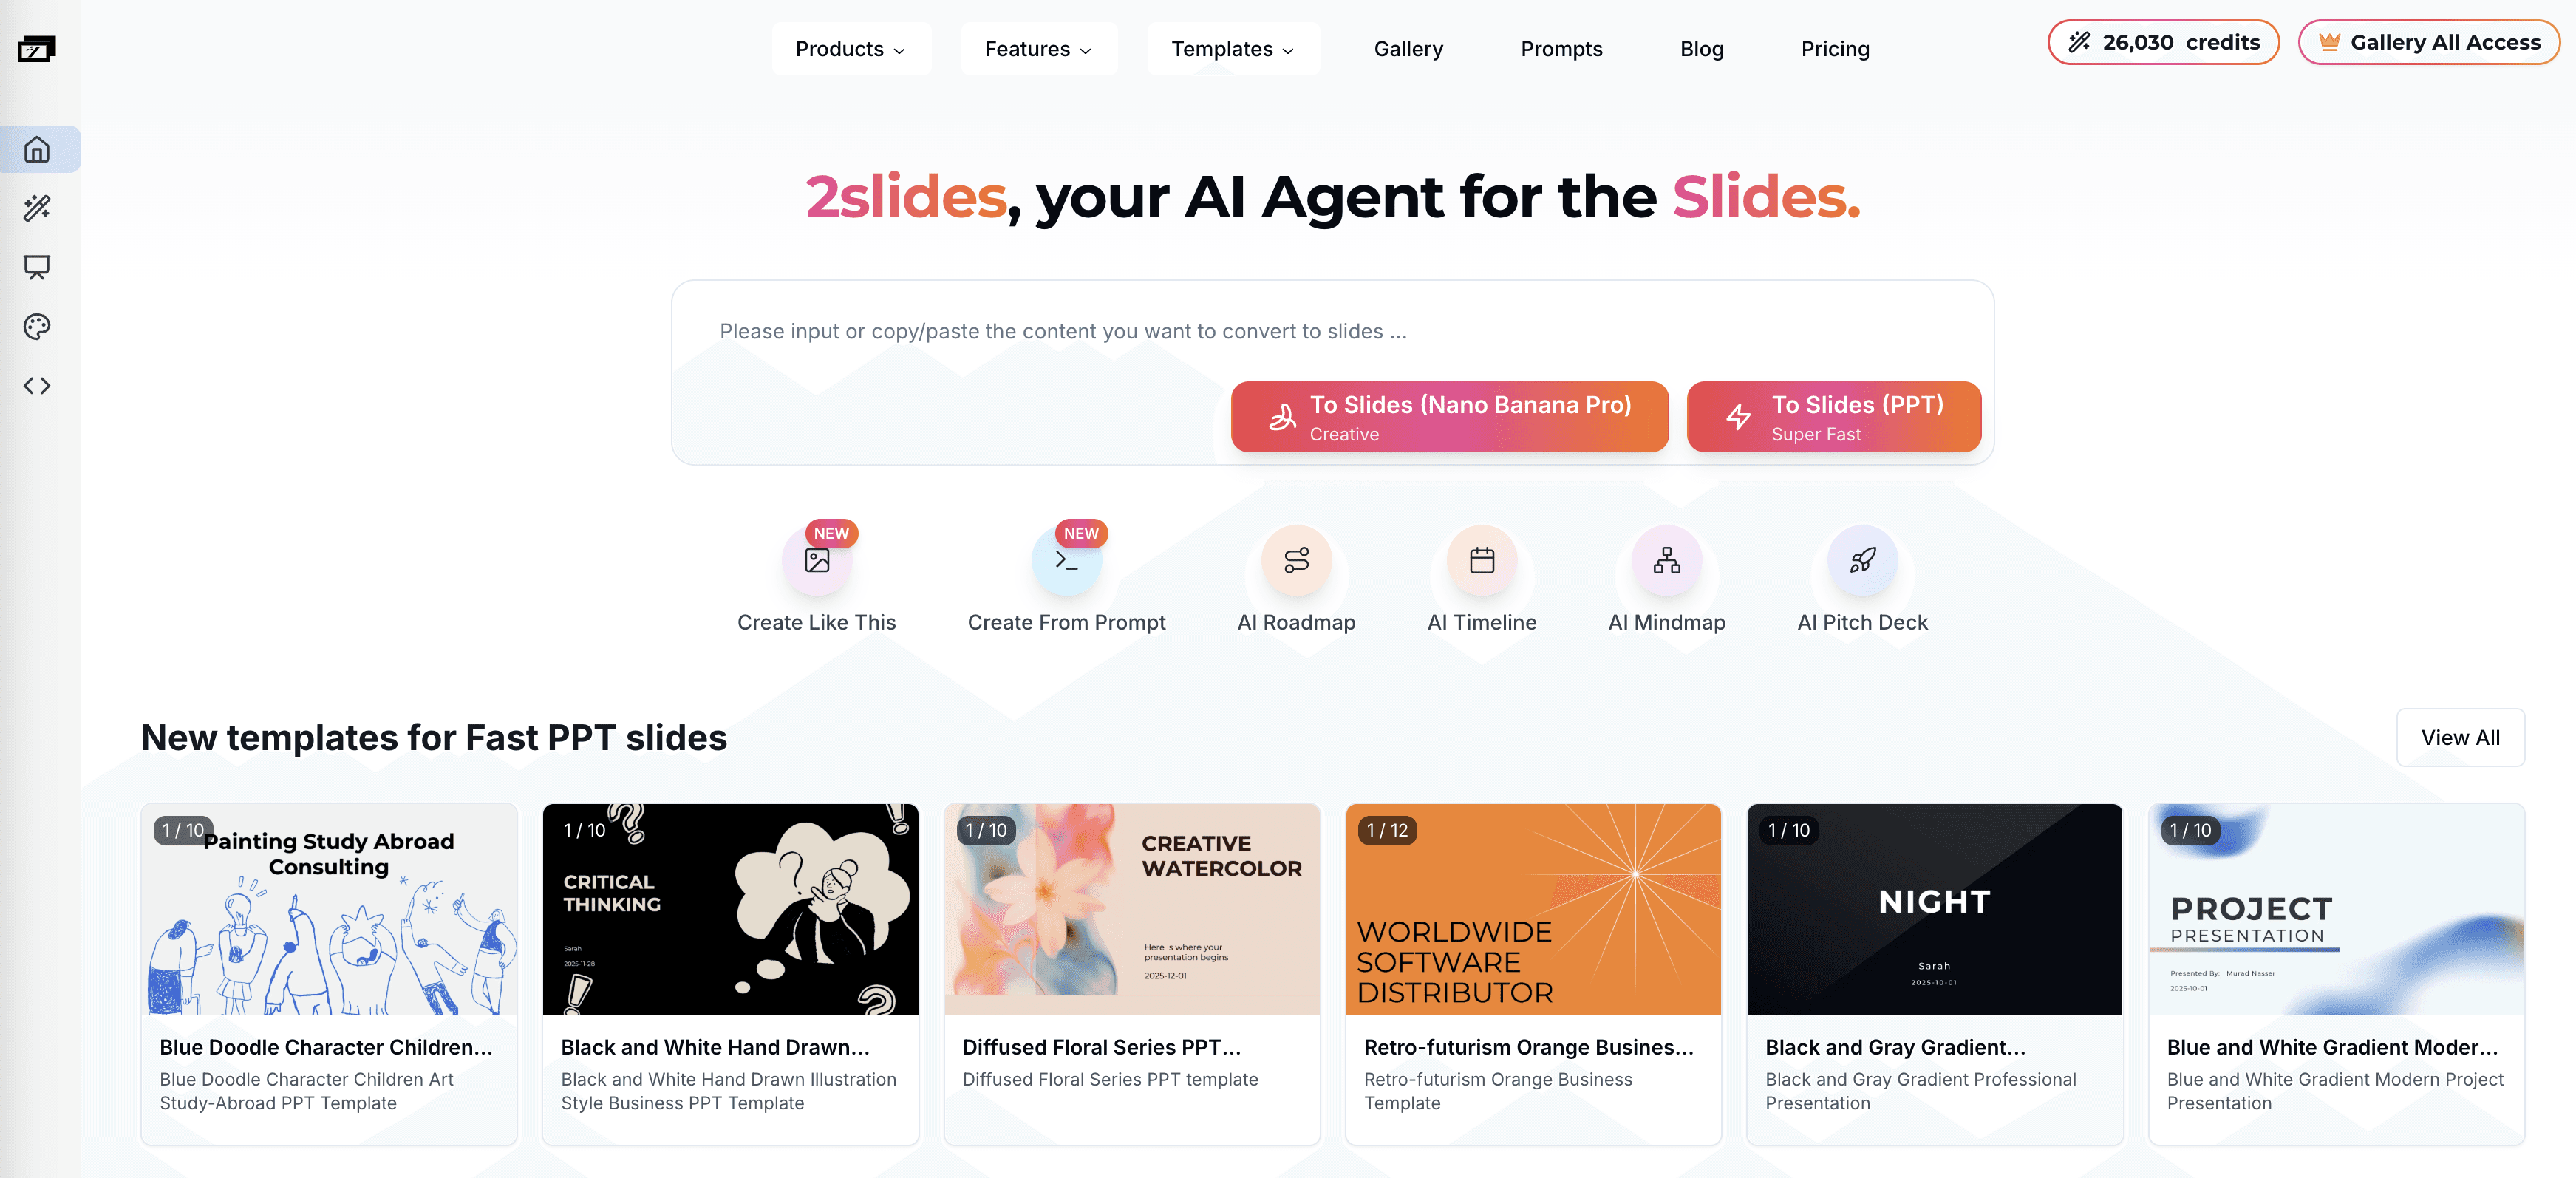
Key Features
Dual Generation Engines:
Fast PPT Slides: This engine is optimized for speed and focuses on structured business reports, roadmaps, and timelines.
Nano Banana Pro: Powered by Google Gemini, this engine focuses on creative visual storytelling and richer compositions.
Professional Templates: A library of templates is available for pitch decks, infographics, mind maps, and roadmaps.
Developer Integration: A robust API and MCP server are featured for building AI agents that can generate presentations programmatically.
Multi-Format Export: Slides can be exported as PowerPoint (.pptx) files and converted to PDF or images.
Multilingual Support: The platform can generate content in multiple languages.
Best For
Entrepreneurs & startups, consultants, AI developers, business Leaders who want to quickly get world-class design slides from content.
Pricing
Free credits when registered; credits package starting from $5.
10. Mind the Graph
Mind the Graph is a specialized infographic tool designed for scientists, researchers, and educators. It focuses on transforming complex scientific concepts into clear, visually appealing graphics that are easy to understand and share.
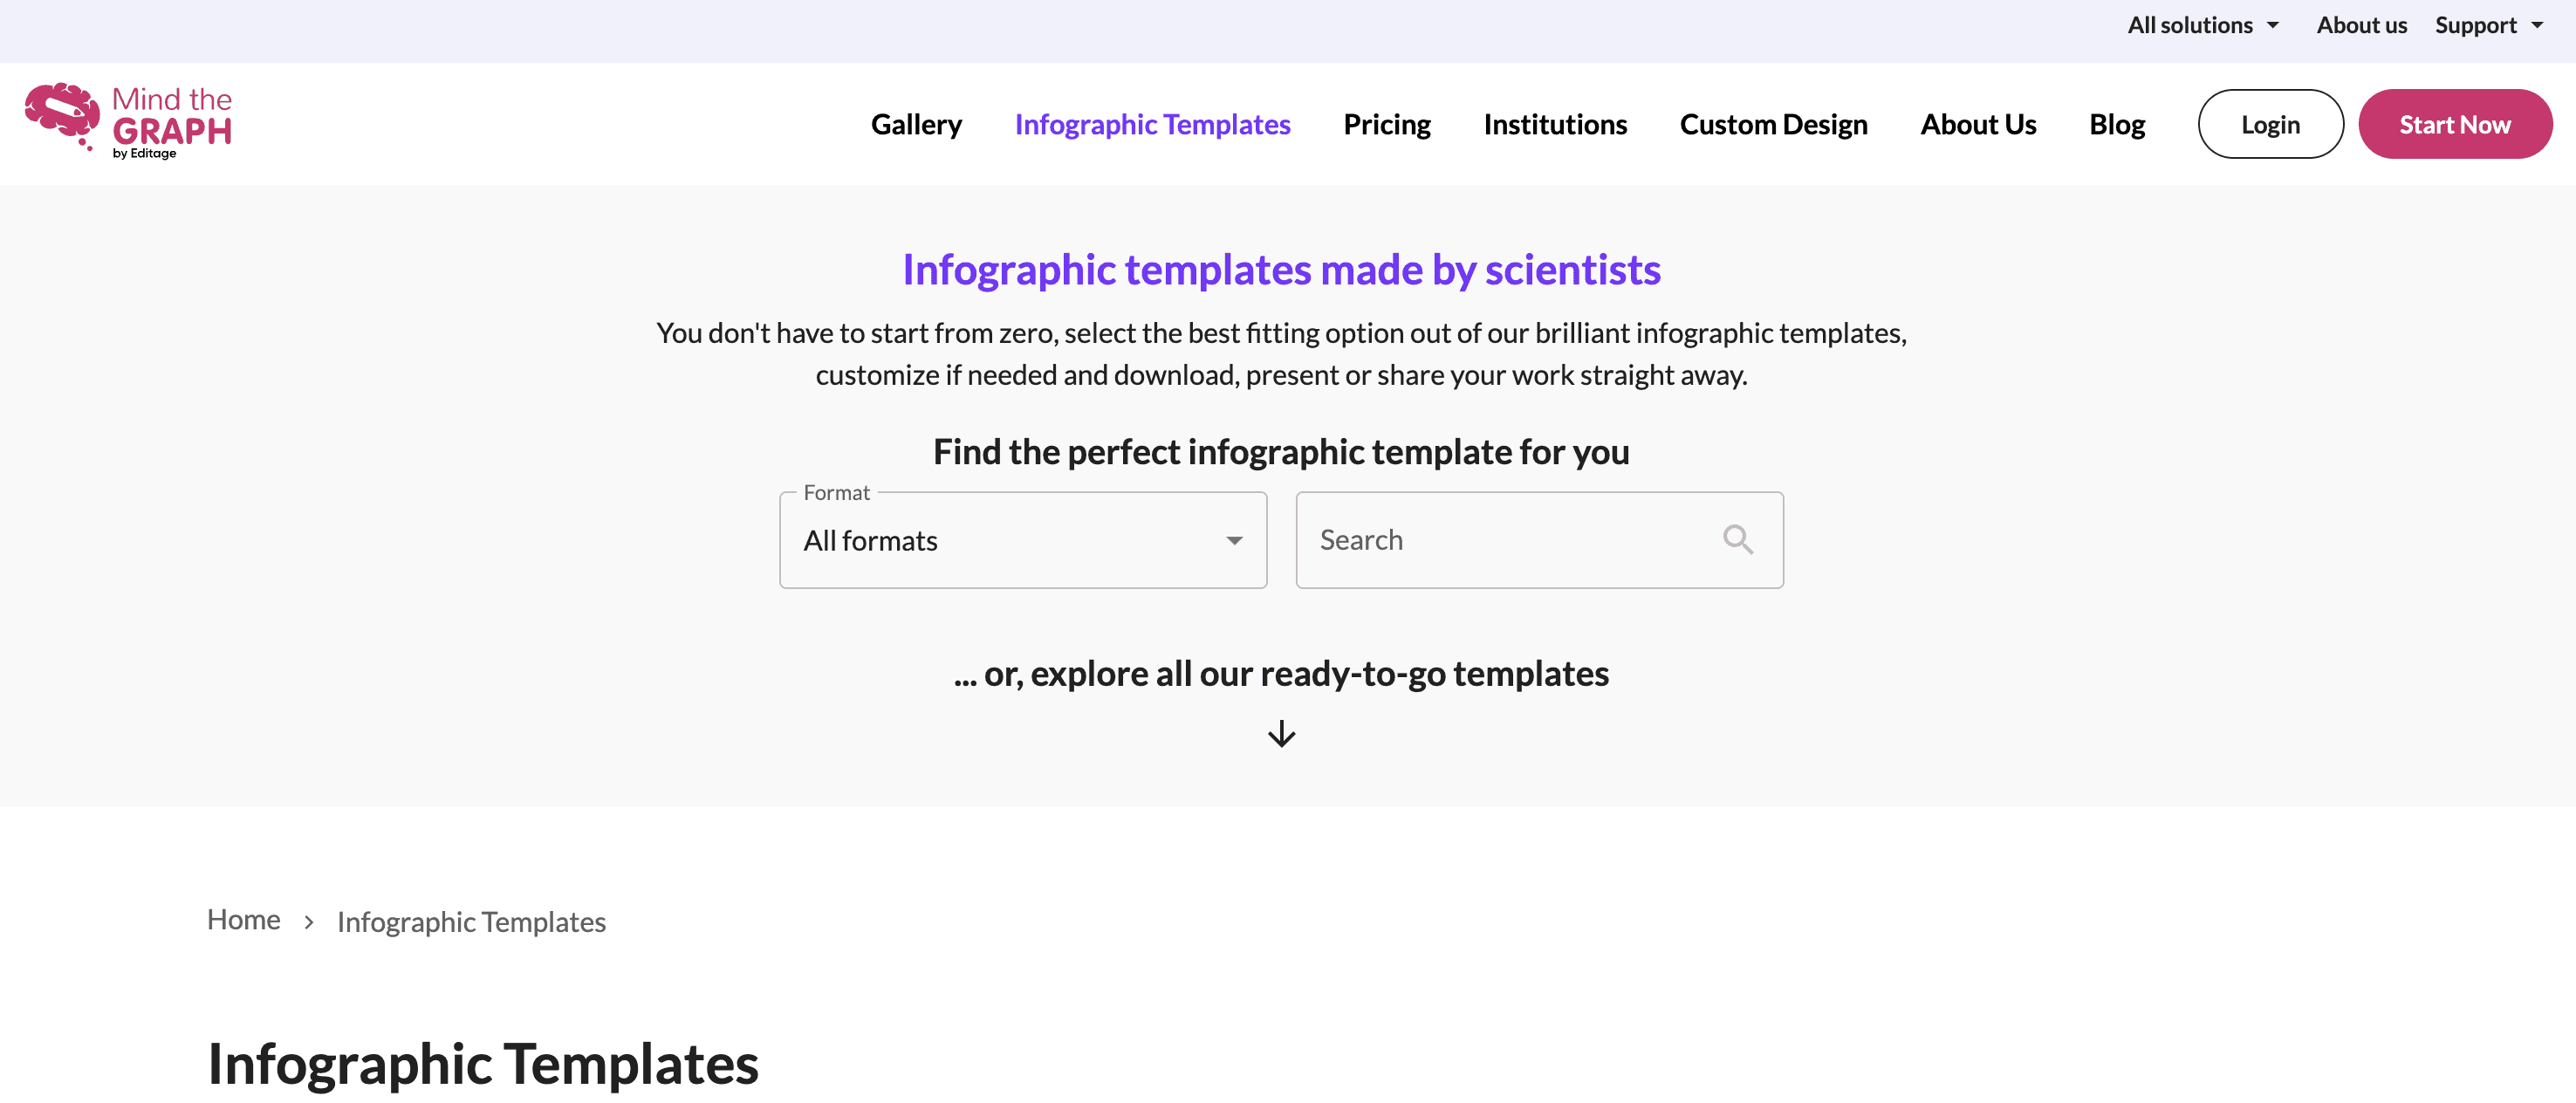
Key Features
Extensive library of scientific illustrations and icons across multiple disciplines
Templates tailored for research posters, presentations, and publications
Drag-and-drop editor for customizing layouts and visuals
Collaboration features for academic teams and research groups
High-resolution export options suitable for journals and conferences
Best For
Researchers, educators, and students who need professional, science-focused infographics for academic communication.
Pricing
Free plan with limited access to illustrations; paid plans start at around $9/month for full library access and advanced features.
Comparison Table of the 10 Tools
Tool | Data Input Support | Chart Variety | Storytelling & Insights | Ease of Use | Pricing |
Powerdrill Bloom | Excel, CSV, PDF, Topic | Pie, Line, Scatter, Heatmap | ✅ Automated storytelling + actionable insights | ⭐ No prompts needed | Free; Pro $19.90/mo |
Canva | Manual input, design-only | Limited (basic charts) | ❌ Design-focused | Easy | Free; Pro $12.99/mo |
Piktochart | Manual data entry, Excel | Basic charts and graphs | ❌ Limited | Easy | Free; Pro $14/mo |
Visme | Manual input, integrations | Wide (charts, maps, interactive) | ❌ Focus on visuals | Moderate | Free; Paid from $12.25/mo |
Venngage | Manual input, simple data | Basic charts and icons | ❌ Template-driven | Easy | Free; Paid from $10/mo |
Infogram | Excel, Google Sheets, APIs | Wide (charts, maps, interactive) | ❌ Focus on visualization | Moderate | Free; Paid from $19/mo |
DesignCap | Manual input | Basic charts | ❌ Template-driven | Very Easy | Free; Paid from $4.99/mo |
Adobe Express | Manual input, design-only | Limited (design-oriented graphics) | ❌ Visual-first | Easy | Free; Premium $9.99/mo |
2slides | Manual input | Wide (all kinds of visual graphs generated by AI) | ❌ AI slides generation | Very Easy | Free; Credits based |
Mind the Graph | Manual input | Specialized scientific illustrations | ❌ Research visuals only | Easy | Free; Paid from $9/mo |
Conclusion
AI infographic generators are reshaping the way individuals and organizations communicate data. From quick design tools like Canva and 2slides to business-focused platforms like Infogram and Visme, the options in 2025 are diverse and powerful. Yet most of these tools stop at visualization—they help you make data look good, but they don’t necessarily help your audience understand the deeper story or take meaningful action.
This is where Powerdrill Bloom sets itself apart. By combining multi-format data input, automated analysis, diverse chart types, storytelling capabilities, and actionable insights, Bloom transforms raw information into compelling visual narratives that drive smarter decisions. And with one-click export options, you can instantly share polished infographics tailored to your needs—all without writing a single prompt.
If you’re ready to go beyond visuals and start telling data-driven stories that inspire action, now is the perfect time to try Bloom. Try Powerdrill Bloom today to convert your ideas or files into well-structured and engaging AI infographics.


