How to Calculate Standard Deviation in Excel with Powerdrill
Flora
Jan 10, 2025
Introduction
Standard deviation is a vital statistic in data analysis, helping you understand the spread or dispersion of your data. Whether you're working with financial data, survey results, or any other dataset, knowing how to calculate standard deviation can provide valuable insights. While Excel offers manual methods for calculating this value, Powerdrill AI streamlines the process, allowing you to get results in just a few clicks. In this guide, we will walk you through how to calculate standard deviation in Excel with Powerdrill AI.
Understanding Standard Deviation in Excel
What is Standard Deviation?
Standard deviation is a measure of how much individual data points in a dataset differ from the mean (average). In simpler terms, it shows the amount of variation or dispersion in a set of values. A high standard deviation means the data points are spread out over a wide range of values, while a low standard deviation indicates that the data points are clustered closely around the mean.
Popular Tools for Calculating Standard Deviation
There are several ways to calculate standard deviation in Excel:
Excel's Built-in Functions: You can use Excel’s STDEV.P (for population) or STDEV.S (for sample) functions to manually calculate standard deviation by selecting a range of cells.
Powerdrill AI: Powerdrill simplifies the entire process by automatically analyzing your dataset and calculating the standard deviation without the need for manual formulas. This approach is faster, more efficient, and capable of handling large datasets with ease.
Step-by-Step Guide to Calculate Standard Deviation with Powerdrill
Step 1: Uploading Your Excel File

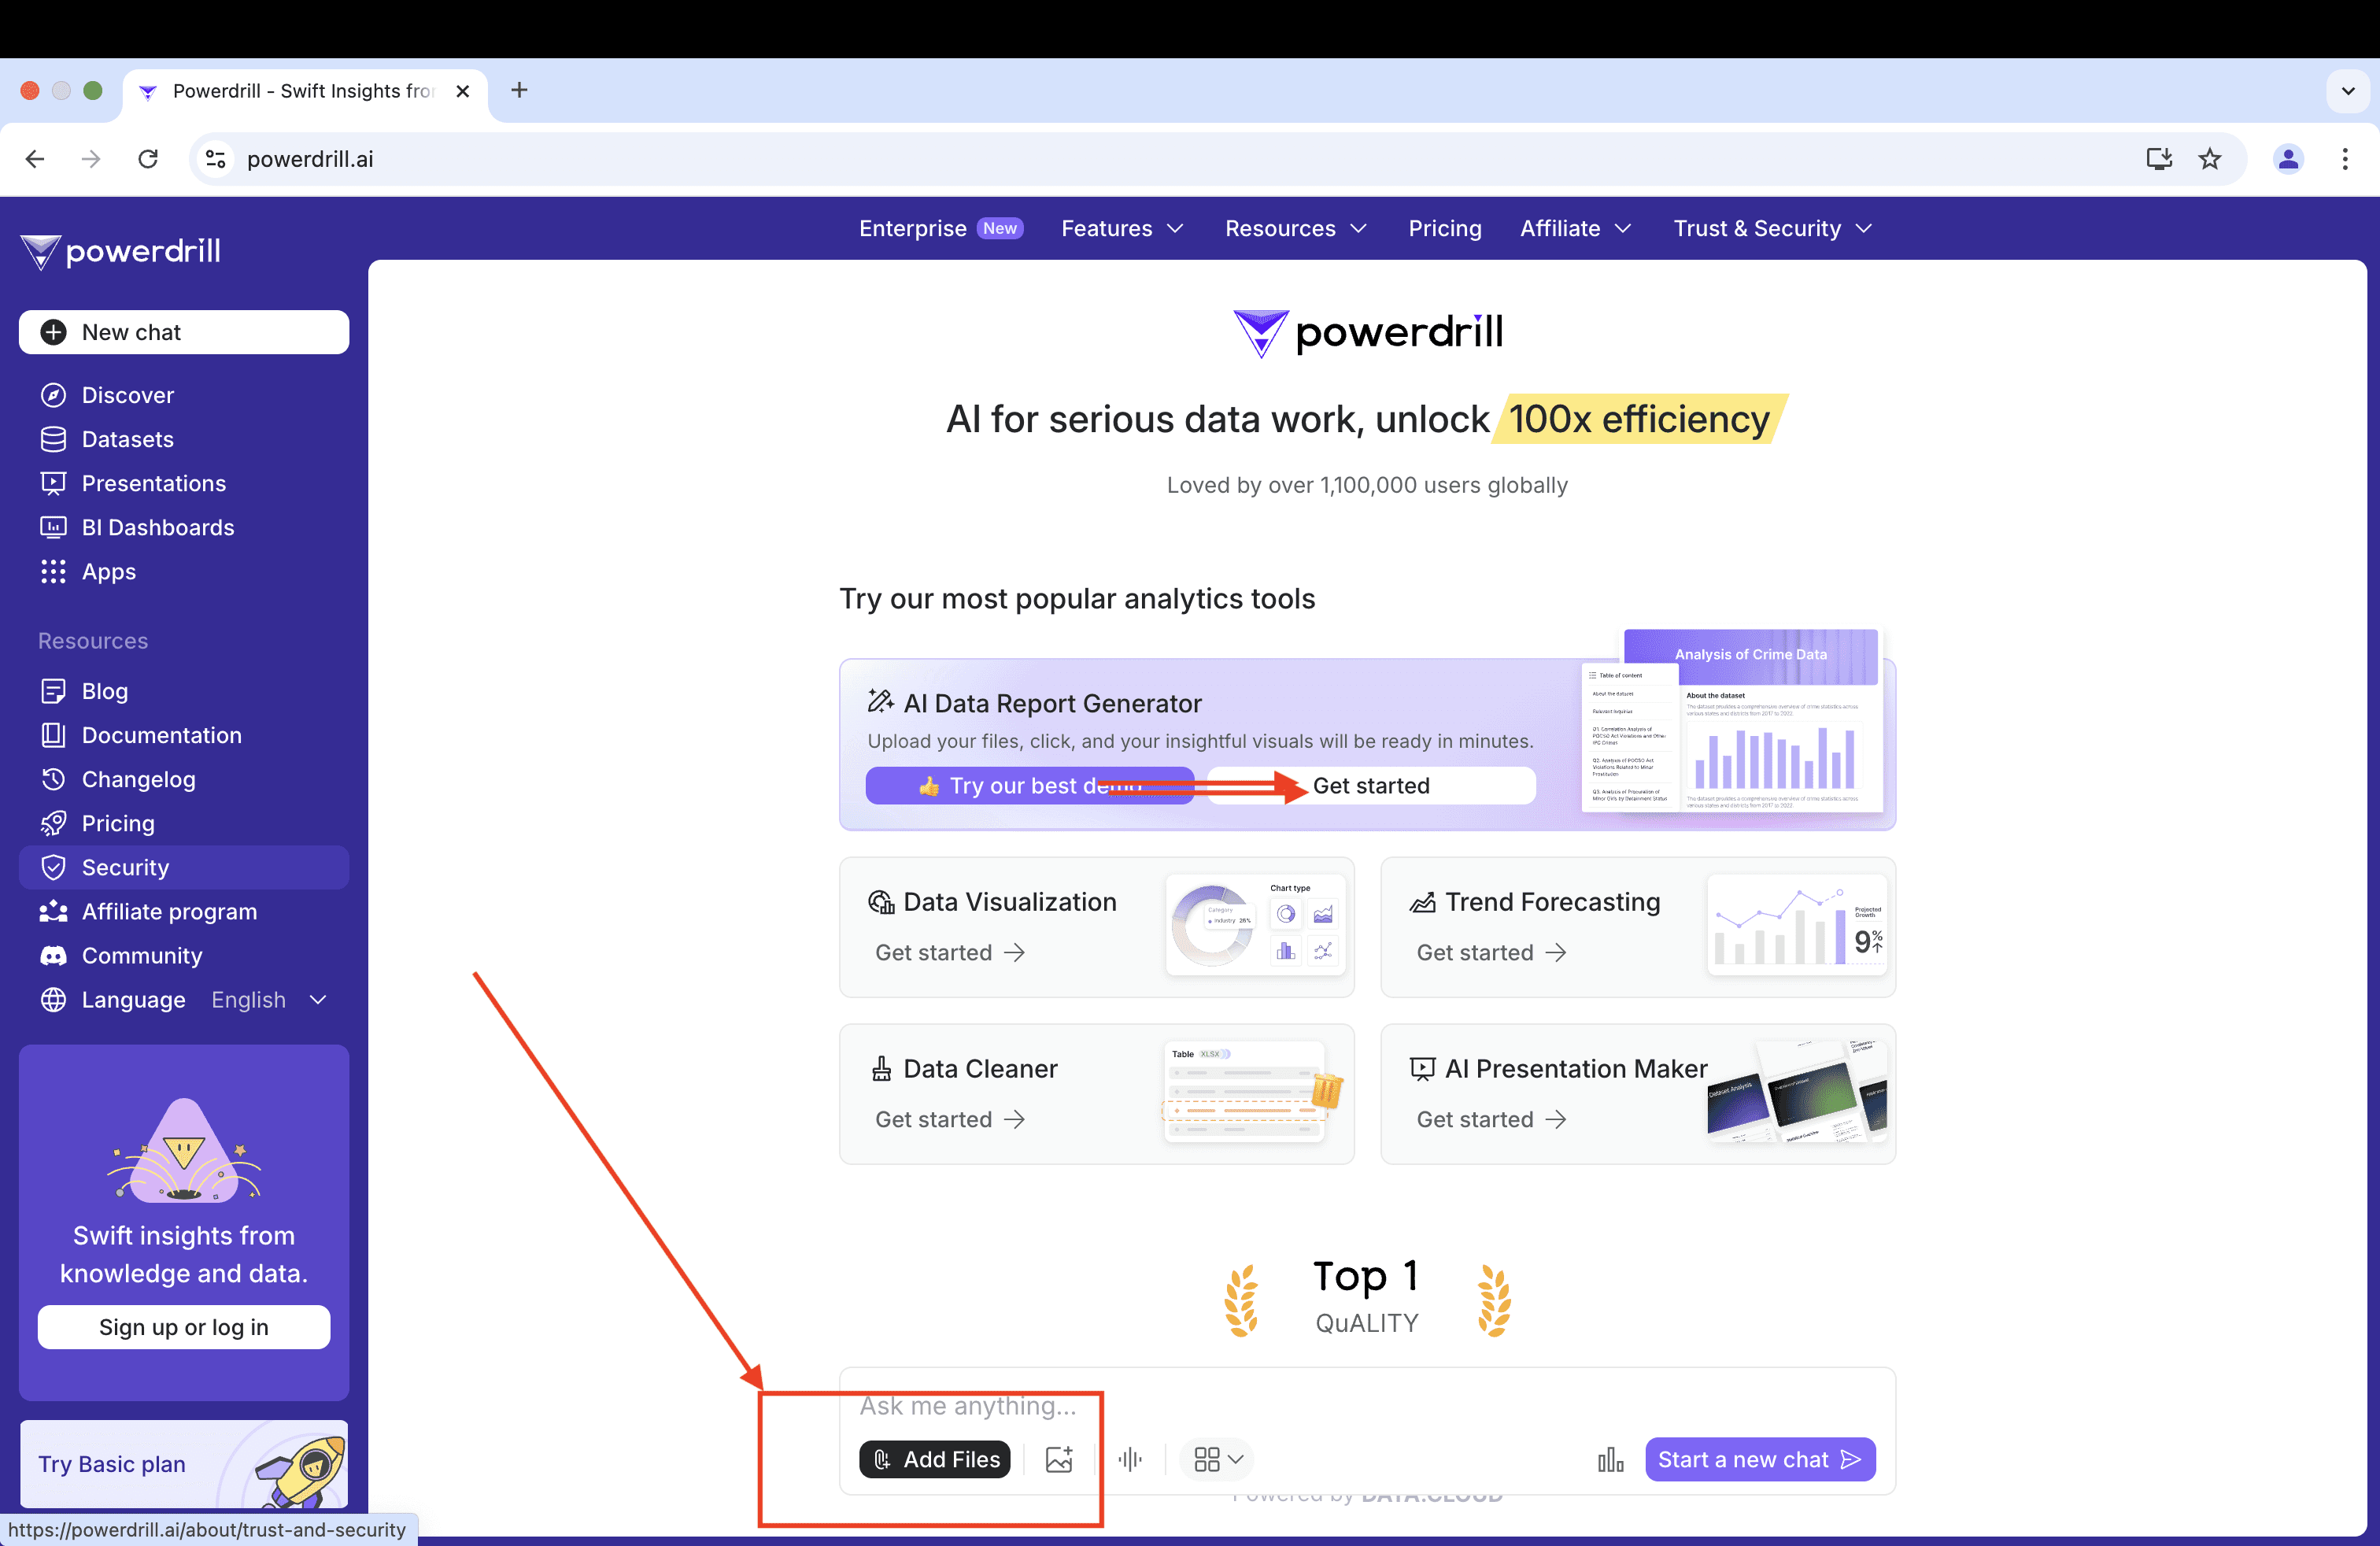
Start by clicking the Add Files button to upload your Excel file. Powerdrill supports multiple file formats, including .xls, .xlsx, and .csv, ensuring compatibility with most datasets. You can upload up to 10 files at once, which is perfect for processing multiple datasets simultaneously.
Step 2: Selecting the Data for Standard Deviation Calculation
Once your file is uploaded, you can type in your prompt to select entire columns or individual rows, depending on the data you want to analyze. For example, if you want to calculate the standard deviation for the sales figures in a column, simply select that column.
Here is an example of prompt:
Calculate the standard deviation of the data in column A, place the result in cell B1, and output it as an Excel file.
Step 3: Let Powerdrill AI Calculate the Standard Deviation
Powerdrill AI will automatically analyze your dataset and calculate the standard deviation for the selected range. In just a few seconds, the tool will provide you with the result, offering a fast and accurate calculation without the need for complex formulas.
Step 4: Download the Calculation Results
Once the calculation is complete, you can download the result as a Excel file or view the data in your dashboard. Powerdrill not only provides the standard deviation but also offers insights into the dataset's variability, making it easier to interpret the data.
Step 5: Optional - Generate a Data Report
For a more detailed breakdown of the standard deviation calculation, you can upload your result again and click the View data report button. This report will include an analysis of the dataset and suggestions for further improvements in your data analysis.
FAQs
Can Powerdrill handle large datasets for standard deviation calculations?
Yes! Powerdrill is designed to process large datasets efficiently, so even if you’re working with thousands of rows of data, you’ll get accurate results quickly.
What file formats does Powerdrill support?
Powerdrill supports .xls, .xlsx, and .csv file formats, ensuring compatibility with most types of Excel files.
Is Powerdrill suitable for sample and population standard deviation?
Yes, Powerdrill calculates the standard deviation in a manner similar to Excel’s built-in functions, making it suitable for both sample and population datasets.
Final Words
Calculating standard deviation doesn’t have to be time-consuming or complex. With Powerdrill AI, you can quickly and accurately calculate the standard deviation for any dataset, whether you're working with small samples or large datasets. Powerdrill’s user-friendly interface and AI-powered features ensure you can get precise results without the hassle. Try it today and see how Powerdrill can enhance your data analysis process!


