Free Box Chart Maker
Create powerful box charts easily. Discover data distributions clearly!
Free Box Chart Maker
Create powerful box charts easily. Discover data distributions clearly!
Free Box Chart Maker
Create powerful box charts easily. Discover data distributions clearly!
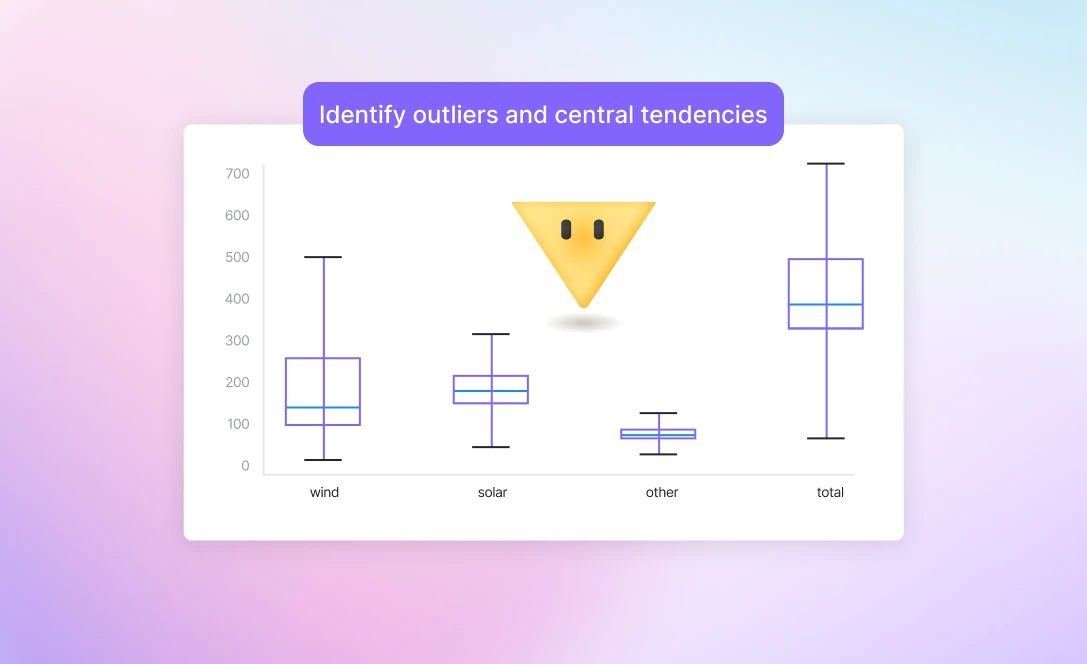
Robust Data Analysis
Box charts show the range and quartiles of data. Great for identifying outliers and central tendencies.
Robust Data Analysis
Box charts show the range and quartiles of data. Great for identifying outliers and central tendencies.
Robust Data Analysis
Box charts show the range and quartiles of data. Great for identifying outliers and central tendencies.
Robust Data Analysis
Box charts show the range and quartiles of data. Great for identifying outliers and central tendencies.
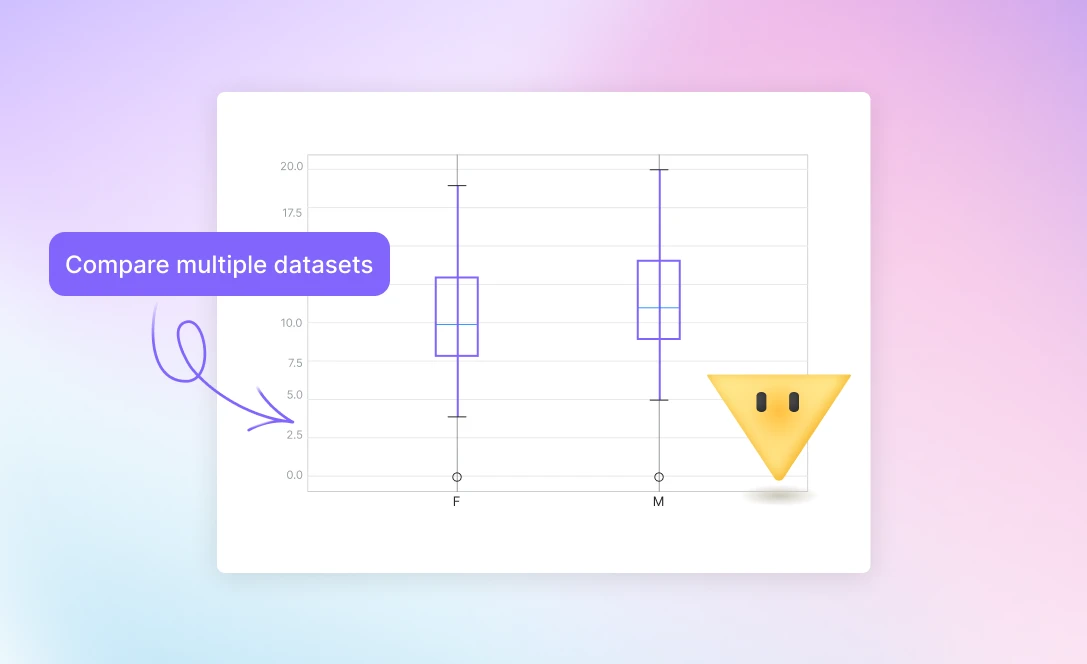
Comparative Insights
Compare multiple datasets using box charts. Useful for benchmarking and performance evaluation.
Comparative Insights
Compare multiple datasets using box charts. Useful for benchmarking and performance evaluation.
Comparative Insights
Compare multiple datasets using box charts. Useful for benchmarking and performance evaluation.
Comparative Insights
Compare multiple datasets using box charts. Useful for benchmarking and performance evaluation.
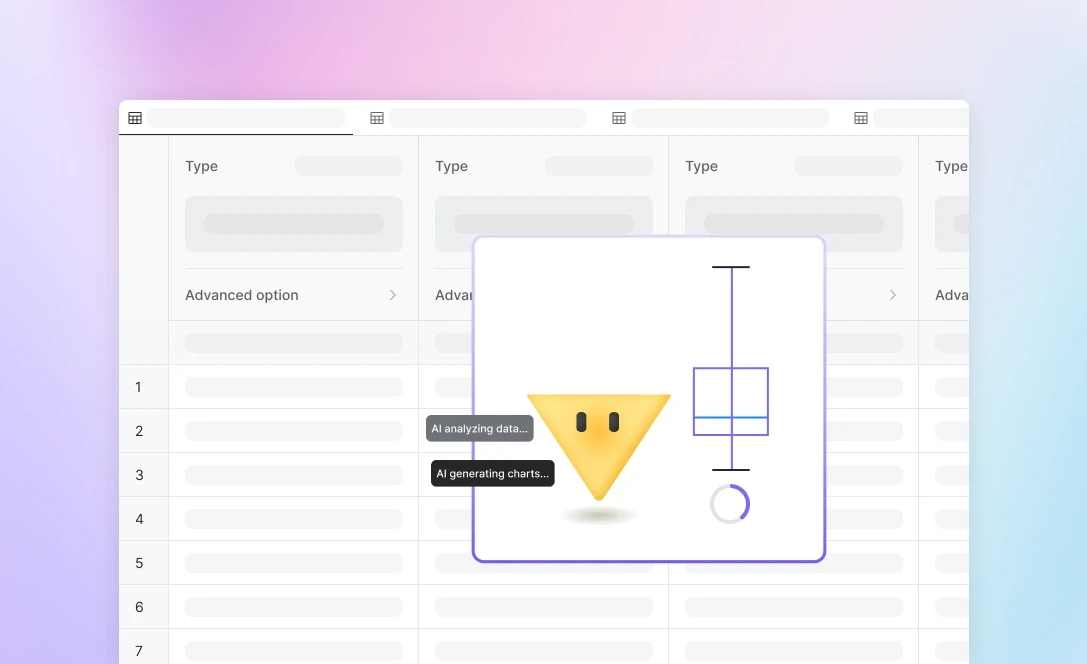
AI-Powered Precision
The AI ensures accurate chart generation. Saves time and reduces errors.
AI-Powered Precision
The AI ensures accurate chart generation. Saves time and reduces errors.
AI-Powered Precision
The AI ensures accurate chart generation. Saves time and reduces errors.
AI-Powered Precision
The AI ensures accurate chart generation. Saves time and reduces errors.
How it works
1
Upload Your Dataset
Upload your dataset smoothly. Supports various formats like CSV and Excel. Quick and straightforward to start.
1
Upload Your Dataset
Upload your dataset smoothly. Supports various formats like CSV and Excel. Quick and straightforward to start.
1
Upload Your Dataset
Upload your dataset smoothly. Supports various formats like CSV and Excel. Quick and straightforward to start.
1
Upload Your Dataset
Upload your dataset smoothly. Supports various formats like CSV and Excel. Quick and straightforward to start.
2
Generate Box Charts via Chatting
Describe your requirements in the chat. The AI creates box charts based on your instructions.
2
Generate Box Charts via Chatting
Describe your requirements in the chat. The AI creates box charts based on your instructions.
2
Generate Box Charts via Chatting
Describe your requirements in the chat. The AI creates box charts based on your instructions.
2
Generate Box Charts via Chatting
Describe your requirements in the chat. The AI creates box charts based on your instructions.
3
Download the Box Chart
Download the completed box chart promptly. Available in multiple formats. Ready for use in your reports or analyses.
3
Download the Box Chart
Download the completed box chart promptly. Available in multiple formats. Ready for use in your reports or analyses.
3
Download the Box Chart
Download the completed box chart promptly. Available in multiple formats. Ready for use in your reports or analyses.
3
Download the Box Chart
Download the completed box chart promptly. Available in multiple formats. Ready for use in your reports or analyses.
Frequently Asked Questions
More Features

Swift Insights from Knowledge and Data
Swift Insights from Knowledge and Data
Swift Insights from Knowledge and Data
Swift Insights from Knowledge and Data
© 2024 Powerdrill. All rights reserved.


© 2024 Powerdrill. All rights reserved.
© 2024 Powerdrill. All rights reserved.
© 2024 Powerdrill. All rights reserved.