Bitcoin Price Trends and Volume Analysis: Key Insights from 2014 to 2024
Ma Li
Dec 5, 2024
Bitcoin's price has shown significant volatility and growth in the past one to two months. As of December 4, 2024, Bitcoin is trading at around $96,000, representing a substantial increase from its price in early November. The cryptocurrency experienced a notable surge, reaching an all-time high of $101,884.80 on September 5, 2024. This recent price movement reflects a continuation of the upward trend observed throughout 2024, with Bitcoin's value more than doubling since the beginning of the year. The market has been influenced by various factors, including the approval of Bitcoin Spot ETFs earlier in the year and the recent U.S. presidential election, which contributed to price fluctuations and overall growth in the cryptocurrency's value.
Recently, we acquired a dataset of Bitcoin prices from the past 10 years. In this blog, we'll leverage AI to analyze the data, uncover potential trends, and predict possible future peaks.
Prepare the dataset
The dataset is obtained from Kaggle.
The dataset "Bitcoin_Historical_Data_table_0.csv" provides a comprehensive historical record of Bitcoin's market performance, spanning 3,724 entries. Key columns include 'Date', 'Adj Close', 'Close', 'High', 'Low', 'Open', and 'Volume'. These columns capture daily trading data, with 'Date' marking the specific day of trading, and the other columns reflecting the financial metrics of Bitcoin on that day.
The 'Adj Close' and 'Close' columns, which are identical in this dataset, have a mean value of 18,848.68, with a minimum of 178.10 and a maximum of 98,997.66. The 'High' and 'Low' columns indicate the highest and lowest prices of Bitcoin on a given day, with mean values of 19,251.92 and 18,381.43, respectively. The 'Open' column, representing the opening price, has a mean of 18,825.29. The 'Volume' column, which records the number of Bitcoins traded, shows a mean of 18,148,784,739.86.
Examining the first five entries, we observe significant fluctuations in Bitcoin's price and trading volume. For instance, on September 18, 2014, Bitcoin opened and closed at 456.86 and 424.44, respectively, with a trading volume of 34,483,200. By July 24, 2015, the closing price had decreased to 288.28, with a volume of 37,199,400. These variations highlight Bitcoin's volatile nature and the dynamic market conditions over the years. The dataset provides valuable insights into Bitcoin's historical price trends and trading activity, essential for investors and analysts monitoring cryptocurrency markets.
Upload the dataset to Powerdrill
Log in to Powerdrill.
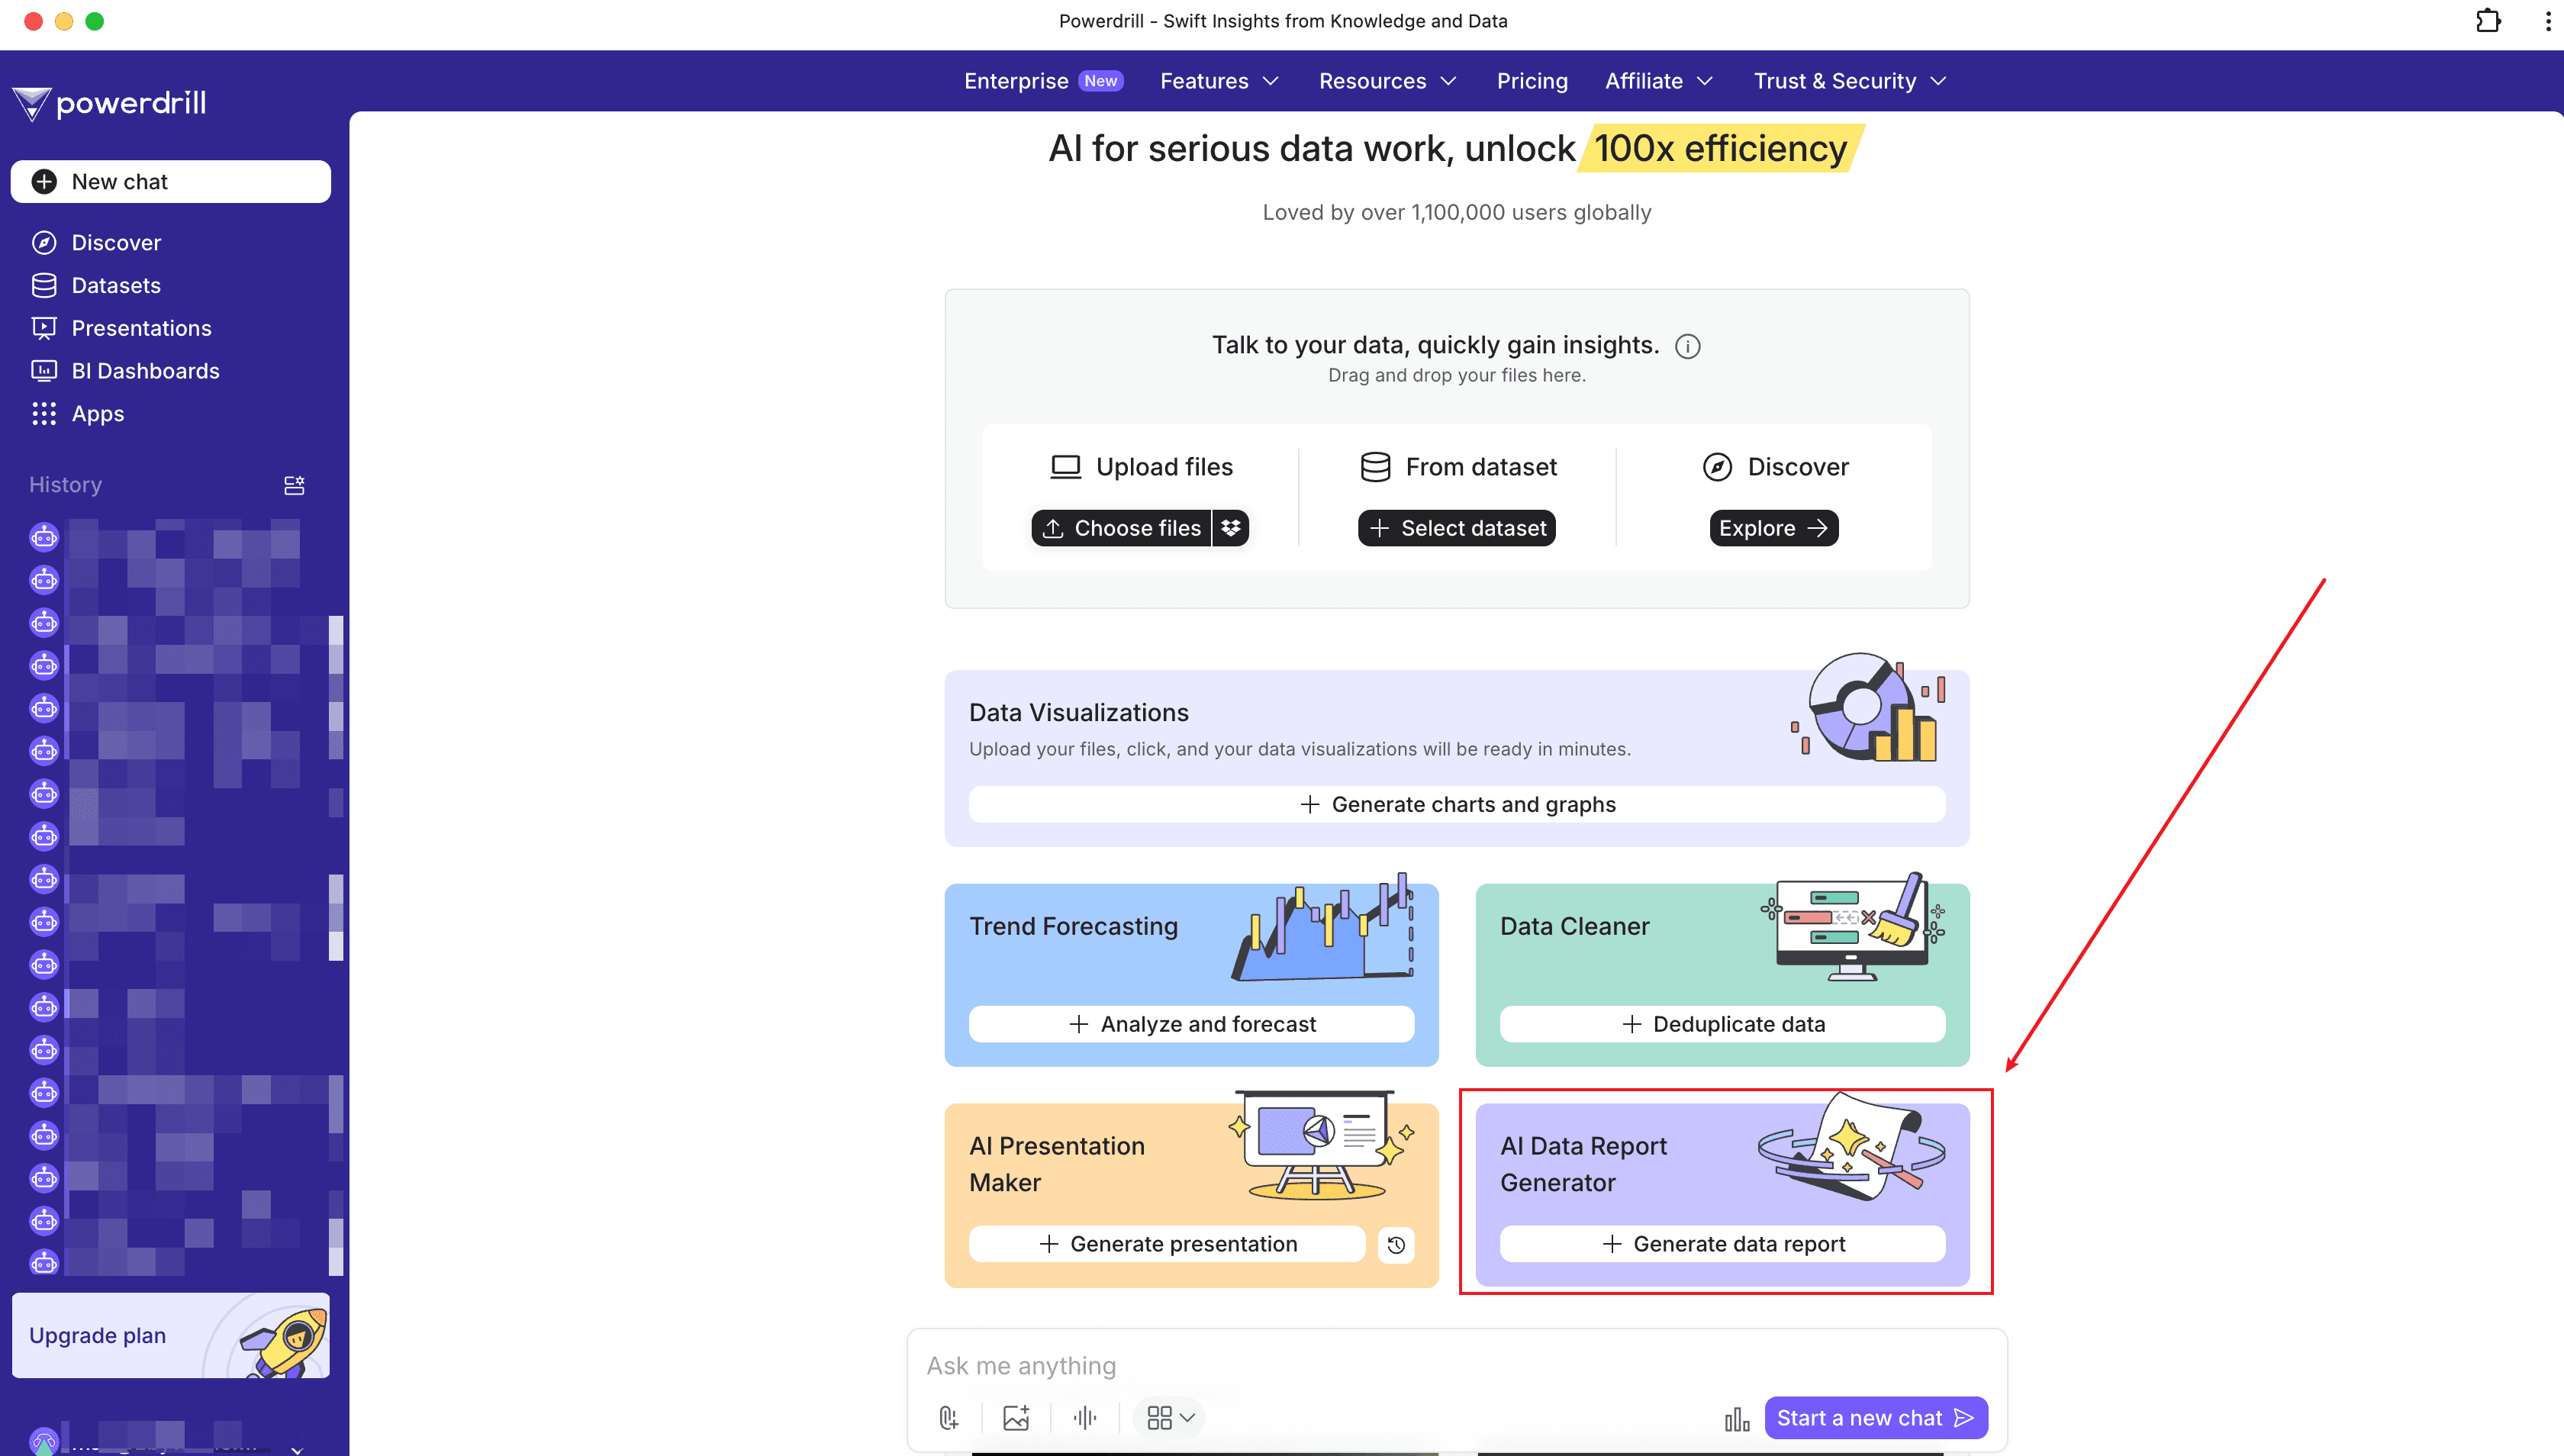
Click Generate data report and select the dataset. Then, simply wait for the results.
To know more about this feature, see AI Report Generator.
Powerdrill-Generated Data Report
Trends Observed in the Bitcoin Closing Prices over the Years
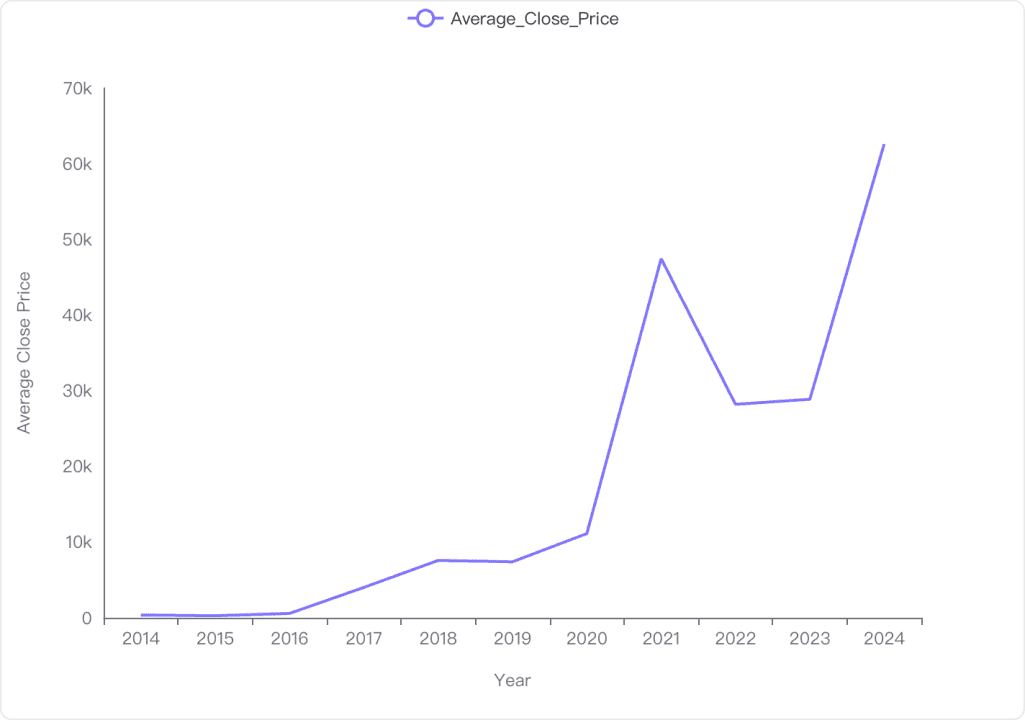
Yearly Average Analysis
Steady Increase (2014-2017): The average closing price of Bitcoin increased from approximately $364 in 2014 to over $4006 in 2017.
Significant Growth (2018-2021): There was a notable rise in prices, peaking at around $47437 in 2021.
Fluctuations (2022-2024): Prices decreased to about $28198 in 2022, then slightly increased to $28859 in 2023, and surged to $62574 in 2024.
Visual Trend Analysis
Overall Upward Trend: The line chart shows a general upward trend in Bitcoin prices over the years, with significant spikes in 2021 and 2024.
Volatility: The chart highlights the volatility in Bitcoin prices, especially noticeable in the sharp rise and fall between 2021 and 2022.
Conclusion and Insights
Long-term Growth: Despite fluctuations, Bitcoin has shown substantial long-term growth in closing prices.
Market Volatility: The data underscores Bitcoin's volatility, with significant price changes occurring over short periods.
Comparison Between Opening and Closing Prices of Bitcoin on a Daily Basis
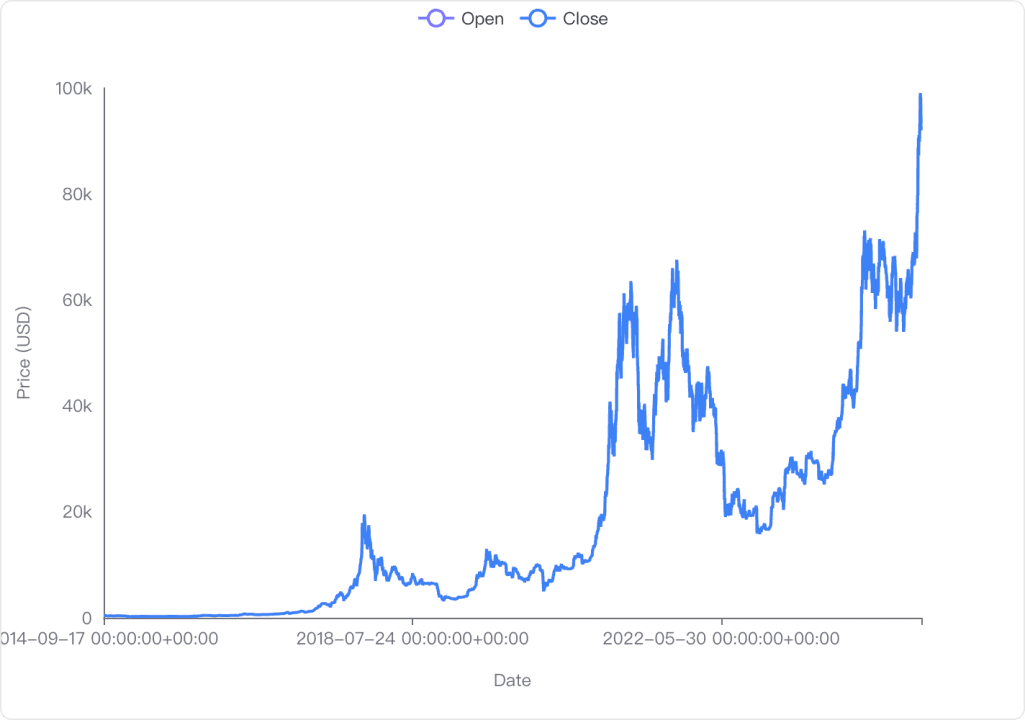
Daily Price Movement Analysis
Mean Opening Price: The average opening price of Bitcoin is approximately $18,825.29.
Mean Closing Price: The average closing price is slightly higher at $18,848.68.
Daily Price Movement: On average, the daily price movement is $23.39, with a standard deviation of $921.67, indicating significant volatility.
Sample Data: Examples show both positive and negative daily movements, such as -$8.53 on 2014-09-17 and $14.23 on 2014-09-20.
Visual Representation
Trend Over Time: The line chart illustrates the trend of opening and closing prices over time, showing significant fluctuations and growth, especially in recent years.
Price Peaks: Notable peaks are visible, reflecting periods of high volatility and price surges.
Conclusion and Insights
Volatility: Bitcoin exhibits high daily volatility, with substantial differences between opening and closing prices.
Growth Trend: Over the years, both opening and closing prices have shown a general upward trend, with significant peaks indicating periods of rapid price increases.
Investment Consideration: The volatility and growth suggest potential for both risk and reward in Bitcoin investments.
Volume and Close Price Clustering Analysis by Date
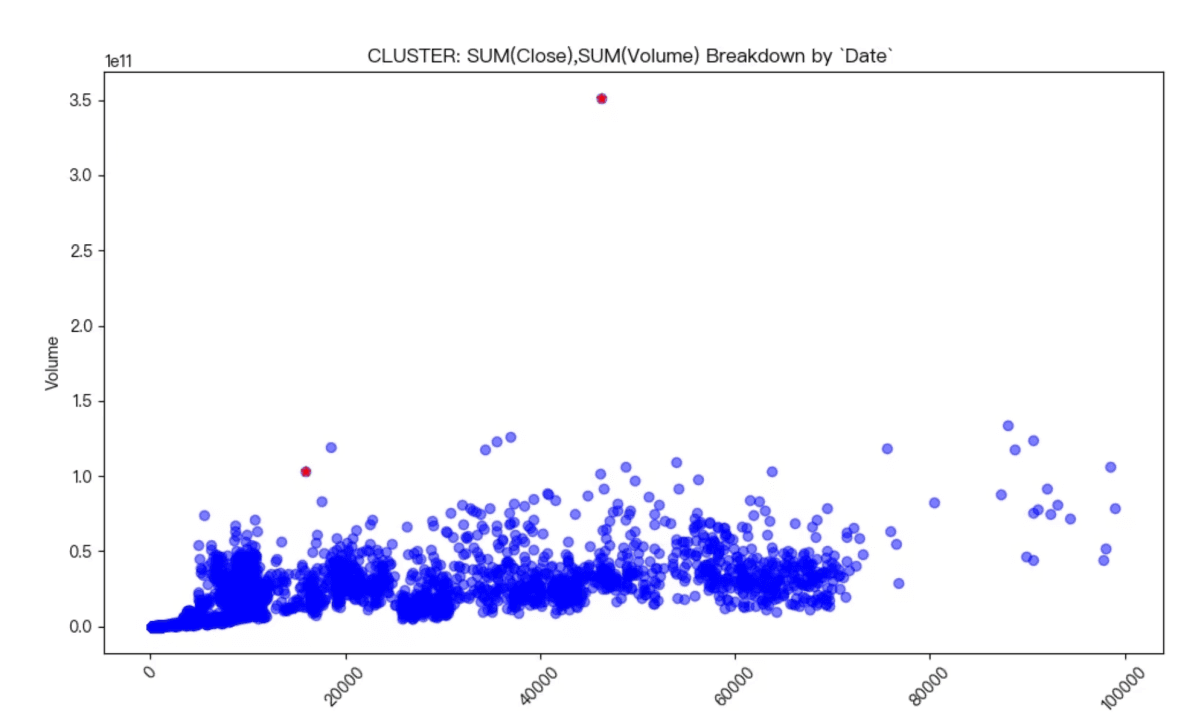
The visualization presents a clustering analysis of the aggregated closing prices and trading volumes over time. The x-axis represents the date, while the y-axis shows the total trading volume. The data points are predominantly clustered in the lower volume range, indicating that most trading activity occurs at lower volumes, with a few outliers representing significantly higher volumes.
The presence of noise points, particularly at coordinates (46339.76, 350967941479.0) and (15880.78, 102905151606.0), suggests that there are specific dates with exceptionally high trading volumes that deviate from the general trend. These outliers could indicate significant market events or anomalies that warrant further investigation. Overall, the clustering pattern highlights the typical trading behavior while also pointing to key dates that may have influenced market dynamics.
Annual Trends in Closing Values from 2014 to 2024
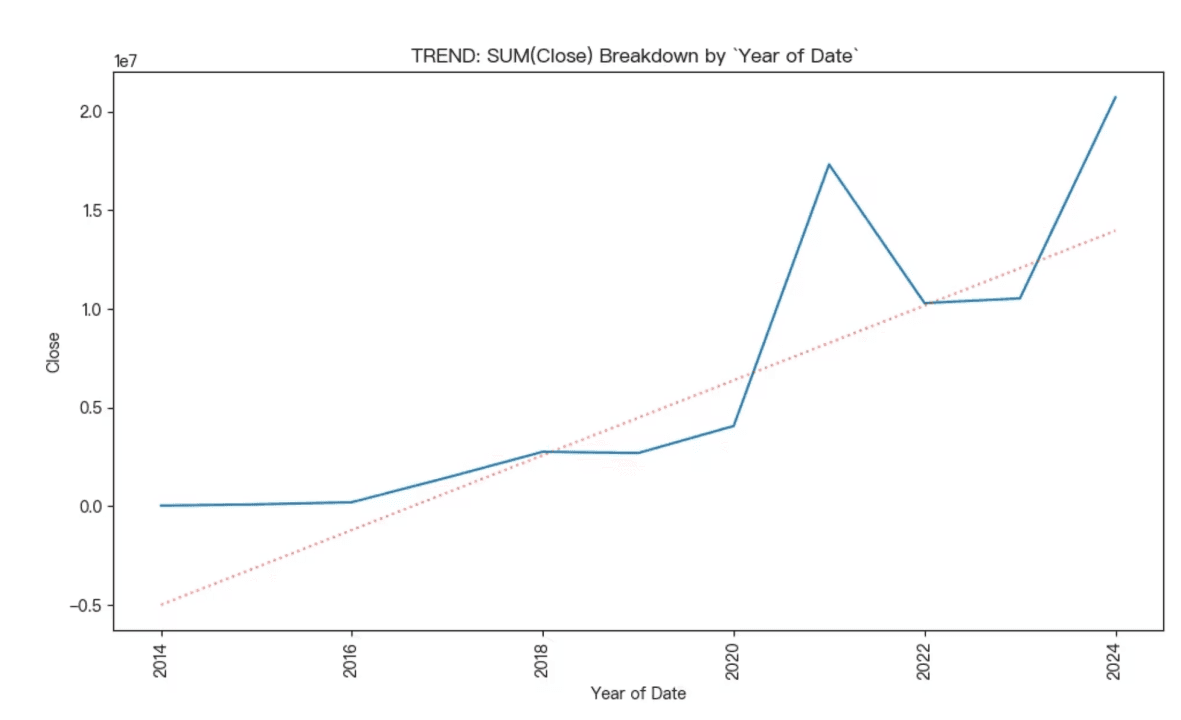
The analysis of the closing values over the years reveals a notable upward trend, particularly from 2020 onwards. The visualization indicates that while there were fluctuations in the earlier years, the overall trajectory has been positive, suggesting increasing values in the closing data. This trend is supported by the R-squared value of approximately 0.74, indicating a strong correlation between the years and the closing sums.
The intercept value of -4,984,306.80 suggests that the model predicts negative closing values at the start of the timeline, which aligns with the observed data points in the earlier years. However, as the years progress, the closing values rise significantly, culminating in a peak around 2024. This upward movement could be indicative of various underlying factors, such as market growth, increased investment, or other economic influences that warrant further investigation to understand the driving forces behind this trend.
Volume and Adjusted Close Price Clustering Analysis
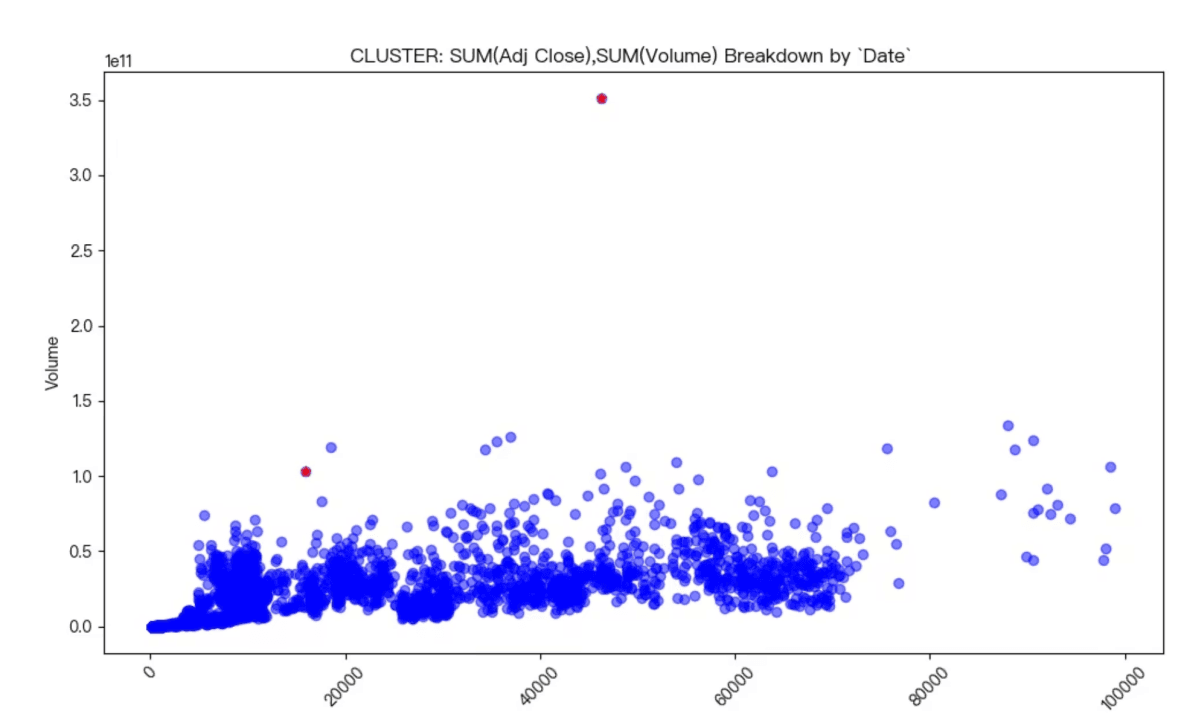
The visualization presents a clustering analysis of the sum of adjusted close prices and trading volumes over time. The x-axis represents the aggregated adjusted close prices, while the y-axis indicates the total trading volume. The data points predominantly cluster towards the lower end of both axes, suggesting that most trading activity occurs at lower price levels and volumes.
Notably, there are a few outlier points, indicated by the red dots, which represent significant spikes in either adjusted close prices or trading volumes. These outliers may warrant further investigation, as they could indicate unusual market activity or events that influenced trading behavior. Overall, the clustering pattern highlights the typical trading environment, where most transactions occur within a certain range, while a few exceptional instances stand out as anomalies.
Correlation Between Bitcoin Trading Volume and Other Price Metrics such as the Opening, High, and Low Prices
Correlation with Price Metrics
Open Price Correlation: The correlation between Bitcoin trading volume and the opening price is approximately 0.655.
High Price Correlation: The correlation with the high price is slightly higher at 0.661.
Low Price Correlation: The correlation with the low price is about 0.645.
Close Price Correlation: The correlation with the closing price is approximately 0.655.
Conclusion and Insights
Comparison with Closing Prices: The correlation of trading volume with the closing price is similar to that with the opening price, both being around 0.655. This suggests that the trading volume has a consistent relationship with both the opening and closing prices.
High Price Correlation: The highest correlation is observed with the high price at 0.661, indicating that trading volume is slightly more responsive to the high price compared to other price metrics.
Correlation Between Bitcoin's High and Low Prices with its Trading Volume
Correlation Results
High vs Volume Correlation: The correlation between Bitcoin's 'High' prices and 'Volume' is approximately 0.661, indicating a moderate positive relationship.
Low vs Volume Correlation: The correlation between Bitcoin's 'Low' prices and 'Volume' is approximately 0.645, also suggesting a moderate positive relationship.
Conclusion and Insights
Moderate Positive Correlation: Both 'High' and 'Low' prices of Bitcoin show a moderate positive correlation with trading volume. This suggests that as trading volume increases, both the high and low prices tend to increase as well, indicating a potential relationship between price outliers and trading activity.
Implication for Trading Strategies: Traders might consider monitoring trading volumes as an indicator of potential price movements, as increased activity could be associated with significant price changes.
Distribution of Bitcoin Trading Volumes: Identifying Periods of Unusual Activity
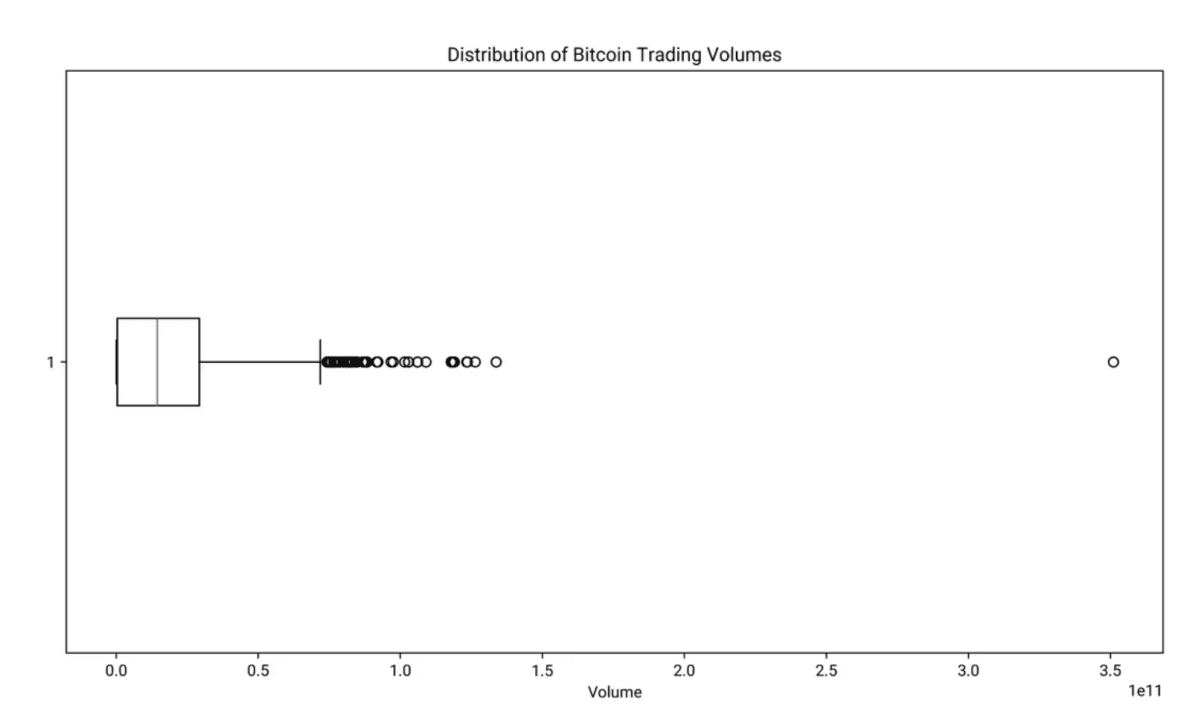
Statistical Analysis
Mean Volume: The average trading volume is approximately 18.15 billion.
Standard Deviation: The standard deviation is about 19.76 billion, indicating significant variability in trading volumes.
Outliers: Outliers are identified using a Z-score threshold of 3. The data shows periods with volumes significantly higher than the average.
Visualization Insights
Box Plot Overview: The box plot shows a right-skewed distribution with several outliers on the higher end.
Outliers: There are multiple data points beyond the whiskers, indicating unusually high trading volumes.
Conclusion and Insights
High Volume Periods: The presence of outliers suggests periods with exceptionally high trading volumes, which could be linked to market events or increased trading activity.
Low Volume Periods: While the data does not explicitly highlight low volume periods, the mean and standard deviation suggest that most trading volumes are below the mean, with fewer instances of extremely low volumes.


