
In today's data-driven world, making sense of vast amounts of information is more important than ever. Turning raw data into clear, easy-to-understand visuals can significantly improve decision-making, drive innovation, and uncover valuable insights. AI tools for visual analytics are essential in this process, as they automate data analysis, spot patterns, and present complex information in a way that's easy to grasp. In this article, we'll look at three top AI tools that excel in visual analytics: Powerdrill AI, TensorFlow, and DataSquirrel. These tools are known for their powerful features, user-friendly interfaces, and ability to transform large datasets into meaningful visuals, helping businesses and individuals make informed, data-driven decisions with confidence.
Key Takeaways
Powerdrill AI offers one-click data visualizations for quick insights.
TensorFlow is great for building and training AI models.
DataSquirrel provides easy-to-use interactive charts and dashboards.
AI tools help uncover patterns and insights in data.
Choosing the right tool depends on usability, compatibility, and cost.
1. Powerdrill AI
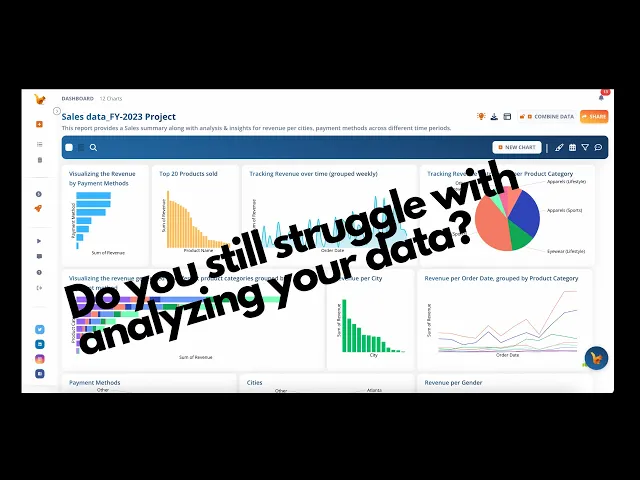
Powerdrill AI is a fantastic tool for real-time data visualization that aims to make your data engaging and easy to understand. It helps you turn raw numbers into clear, dynamic visuals with minimal effort. With Powerdrill AI, you can create a variety of charts, like area and bar charts, to best showcase your data. What sets it apart is its ability to analyze your data as you go, offering insights and suggestions to ensure you're presenting your information in the most effective way possible. Whether you need to track performance metrics, spot trends, or present your findings to others, Powerdrill AI makes the process straightforward and impactful. It's a great tool for anyone looking to make smarter, data-driven decisions quickly and easily.
Key features
Real-time data visualization: Powerdrill AI analyzes your files with data visuals generated in real time.
Automated data analysis: Powerdrill AI employs advanced LLMs to analyze data as it is inputted, providing insights and recommendations to enhance the accuracy and clarity of visualizations.
User-friendly interface: With Powerdrill AI, the only thing you need to do is tell Powerdrill AI what you need, and Powerdrill AI will give you everything you need in a neat and well-formatted response.
Diverse chart options: Powerdrill AI supports a variety of chart types, including area and bar charts, ensuring that you can choose the best format to represent your data effectively.
Benefit 1: Easy-to-Use
Powerdrill AI offers a clear, user-friendly no-code interface. Without writing any code, you can obtain sophisticated data analysis results, uncovering insights, trends, and patterns in your data.
But that's not all. After uploading your files or selecting a new dataset for your current chat, Powerdrill automatically generates relevant questions to help you start understanding your data, in case that you're unsure where to begin.

Benefit 2: Customizable and shareable charts and dashboards
During data processing and analysis, Powerdrill AI generates a variety of dynamic charts to vividly visualize your findings. You can effortlessly download these charts or save them to customizable dashboards for seamless management and presentation. If the default presentations don't meet your preferences, you have the flexibility to personalize the chart type, color, and other elements to perfectly match your style and needs.

With just one click after you input your question, Powerdrill AI can create stunning visualizations from your data. This feature saves time and effort, making it easy for anyone to understand complex data sets.
Powerdrill AI allows you to customize charts and dashboards to fit your specific needs. You can adjust colors, labels, and formats to make your data presentations unique and clear.
Powerdrill AI is perfect for both professionals and hobbyists looking to add a new dimension to their data analysis.
2. TensorFlow
TensorFlow is a powerful open-source platform for machine learning developed by Google. It allows developers to build and deploy machine learning models easily. TensorFlow is widely used in both research and industry for tasks ranging from image recognition to natural language processing.
Key features
Scalability: TensorFlow can handle large-scale machine learning models and datasets.
Flexibility: It supports various platforms, including mobile and web.
Community support: A large community of developers contributes to its continuous improvement.
Integration: TensorFlow integrates well with other Google services and tools.
Benefit 1: Comprehensive ecosystem
TensorFlow offers a robust ecosystem with a wide range of tools and libraries, including TensorFlow Lite for mobile and embedded devices, TensorFlow.js for in-browser machine learning, and TensorFlow Extended (TFX) for end-to-end ML pipelines. This makes it versatile for various applications and platforms.

Benefit 2: Model building and training
TensorFlow provides high-level APIs like Keras, which simplify the process of building and training machine learning models. These APIs are user-friendly and allow for quick prototyping, while still offering the flexibility to dive into lower-level operations if needed.

3. DataSquirrel
DataSquirrel is a user-friendly AI tool designed for data analysis using DataSquirrel.ai. It simplifies the process of turning raw data into meaningful insights, making it accessible even for those without a technical background.
Key features
Intuitive interface for easy data interaction
Real-time collaboration for team projects
Connects to various data sources like CSV files, Google Sheets, and BigQuery
Automatically generates live-updating reports
Benefit 1: Automated data cleaning
One of DataSquirrel's standout features is its automated data cleaning capabilities. It can identify and correct errors, handle missing values, and standardize data formats, saving you significant time and effort in preparing your data for analysis.
Benefit 2: Advanced data visualization
DataSquirrel provides a wide range of customizable visualization options, allowing you to create compelling charts, graphs, and dashboards. These visualizations help you uncover insights, trends, and patterns in your data, making it easier to communicate your findings to stakeholders.

With DataSquirrel, you can quickly analyze data without needing conventional tools like spreadsheets or SQL. This makes it perfect for users who want to dive into data analysis without a steep learning curve.
DataSquirrel supports real-time collaboration, allowing teams to work together effortlessly. This feature is especially useful for projects that require input from multiple team members.
Conclusion
In today's world, AI tools for visual analytics are more important than ever. Powerdrill AI, TensorFlow, and DataSquirrel each offer unique features that can help you turn raw data into clear, useful visuals. Whether you need one-click visualizations, customizable dashboards, or powerful data processing, these tools have something to offer. Choosing the right tool depends on your specific needs, but any of these top three can make your data analysis easier and more effective. So, explore these options and see how they can help you make better decisions with your data.


