
Introduction
In modern retail business, data-driven decision-making significantly enhances operational efficiency and market competitiveness. Powerdrill offers advanced data analysis capabilities that extract valuable insights from complex retail data. This article will demonstrate how to use Powerdrill for retail data analysis and provide a detailed case study using real data.
Understanding Retail Data Analysis
What is Retail Data Workflow?
1. Data Ingestion
Collection: Gather relevant retail data including sales records, customer transactions, and inventory logs.
Alignment: Ensure data sources align with business objectives and provide comprehensive coverage of retail operations.
2. Data Cleaning and Preprocessing
Consistency: Address inconsistencies by handling missing values, removing duplicates, and standardizing formats.
Quality: Ensure data quality and accuracy for reliable analysis.
3. Exploratory Data Analysis (EDA)
Examination: Conduct initial exploration using statistical summaries and visualizations.
Identification: Identify trends, patterns, and anomalies to understand the dataset’s structure and key characteristics.
4. Behavioral Analysis
Patterns: Analyze customer purchase behaviors to uncover preferences and buying patterns.
Targeting: Use insights to tailor marketing strategies effectively.
5. Results Interpretation and Deployment
Context: Interpret results in the context of business objectives.
Action: Translate findings into actionable insights and integrate them into decision-making processes.
6. Reporting
Communication: Compile findings into reports.
Guidance: Use these to effectively communicate insights to stakeholders and guide business strategies.
Popular Retail Data Analysis Tools
Powerdrill: Advanced AI-powered analytics tool for extracting actionable insights from retail data.
Google Analytics: Provides data insights for online retail stores, tracking customer behavior, and conversion rates.
Tableau: A powerful visualization tool that helps businesses interpret complex data through graphs and charts.
Step-by-Step Guide to Analyze Retail Data with Powerdrill
In this case study, we explore how retail analytics can optimize sales strategies and inventory management using Powerdrill. We have data from Walmart that includes weekly sales figures, store identifiers, department numbers, and dates. Our objective is to understand sales patterns across different stores and departments, predict future sales trends, and recommend strategies for improving inventory management and customer satisfaction. By analyzing this real-world retail data, we aim to identify actionable insights that can enhance operational efficiency and drive business growth.
The sample data used in this case study is Walmart sales data.
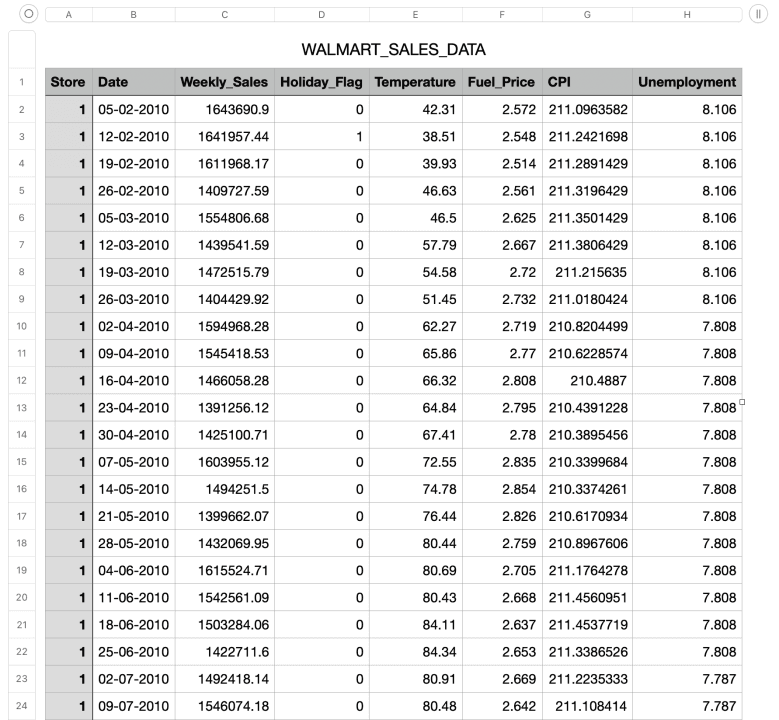
You can click WALMART_SALES_DATA Link to analyze the dataset on Powerdrill.
Step1: Question Formulation
In retail analytics, formulating the right questions is crucial for guiding your analysis and deriving meaningful insights. It's like setting a clear objective for your investigation, helping you focus on the essential aspects of your data. For example, with our Walmart sales data, we posed the question:
"What are the key factors that drive sales performance across different stores and departments over time?"
This question directs us to analyze various elements such as weekly sales trends, store performance, and department-specific patterns. By clearly defining our question, we ensure that our analysis remains focused and effective, allowing us to extract actionable insights that can enhance sales strategies and inventory management.
Step2: Data Collection
In retail analytics, collecting the right data is fundamental. For our case study on Walmart sales performance, we gathered comprehensive sales records, including weekly sales figures, store identifiers, department numbers, and transaction dates. This data is critical to answering our key questions about sales trends and inventory management. It’s important to ensure that the data aligns with our analysis objectives. While new data collection might be necessary in some scenarios, here we utilized existing data that already encompasses all the relevant details we need for our analysis. Acquiring accurate and relevant data is the essential first step towards uncovering actionable insights.
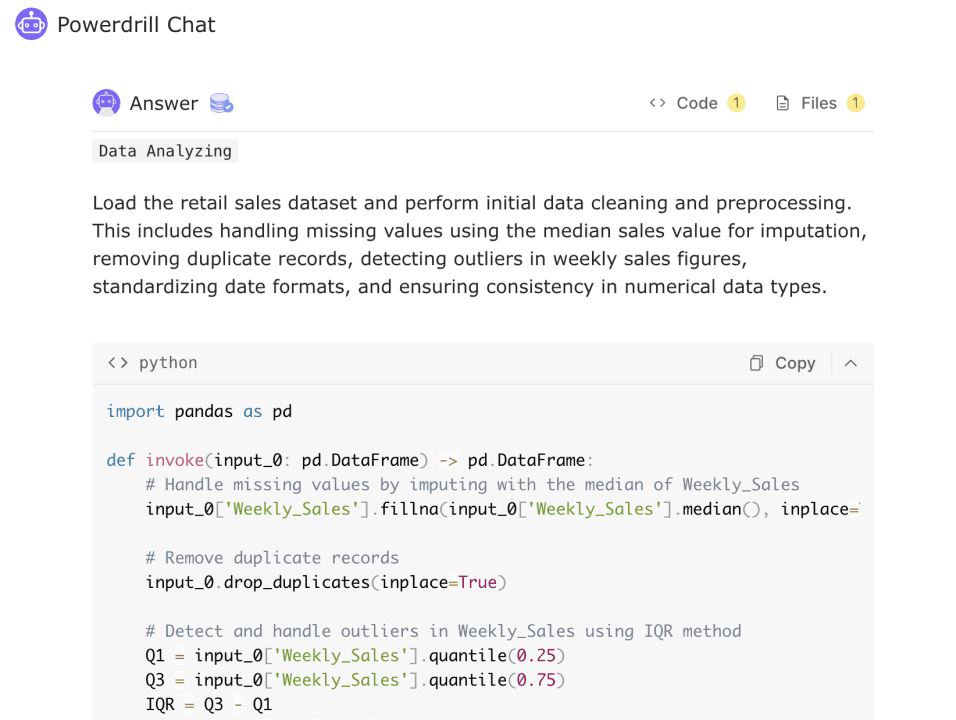
Step3: Data Cleaning and Preprocessing
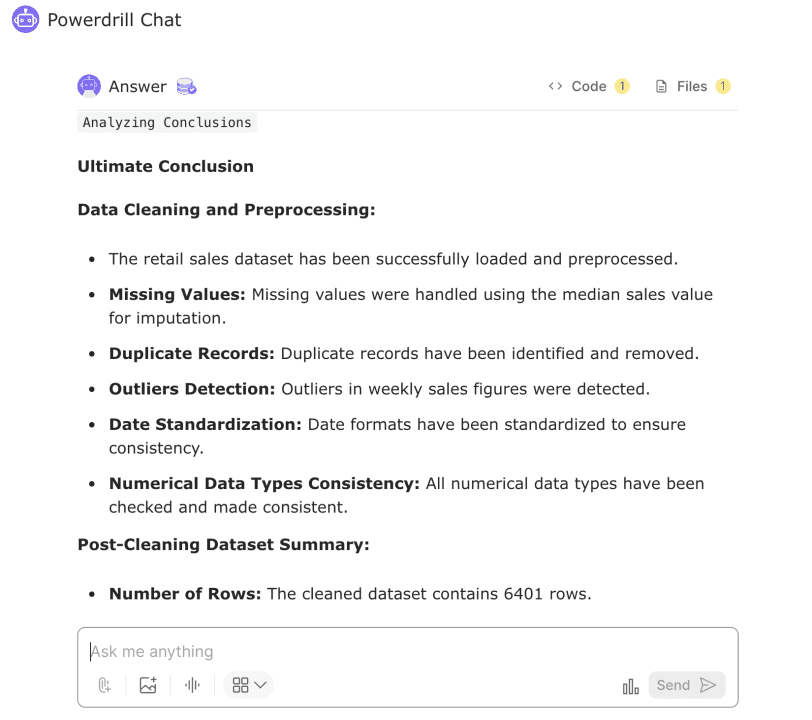
In our retail analysis, the data cleaning and preprocessing phase was pivotal and involved leveraging Powerdrill for optimal data integrity. Initially, the Walmart sales dataset was loaded into Powerdrill. We instructed Powerdrill to rigorously identify and address missing values and duplicate records. It revealed no duplicates but highlighted some weeks with missing sales data. We resolved these gaps by imputing the missing values with the median sales for those periods, thus maintaining data consistency and avoiding skewed analysis. Powerdrill also detected several outliers in weekly sales figures, particularly elevated sales during certain periods, likely associated with promotional activities or seasonal variations. These outliers were retained for further exploration to assess their potential impacts on sales trends. Furthermore, we standardized the date formats to YYYY-MM-DD and ensured uniform numerical data types across the dataset. This thorough preprocessing has primed the dataset for in-depth analysis, enabling us to derive accurate and actionable insights.
Step4: Significant Findings
Missing Values: Addressed through median imputation, ensuring consistent data across the dataset.
Outliers: Retained to explore their influence on sales trends, especially during promotions or seasonal peaks.
Date Standardization: Implemented a unified date format (YYYY-MM-DD) to support time-series analysis.
Numerical Consistency: Verified and standardized numerical data types for accurate analysis.

Step5: Exploratory Data Analysis (EDA)
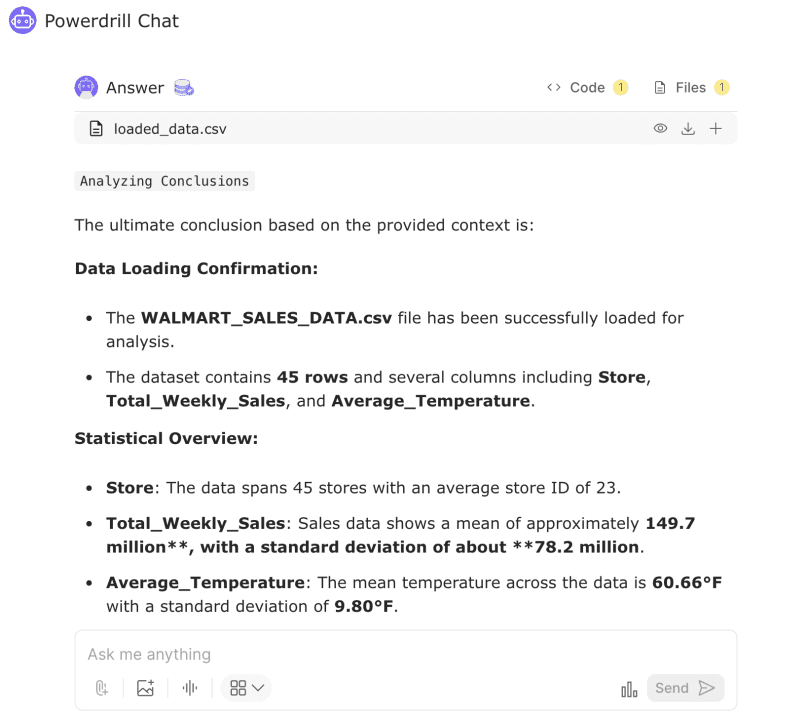
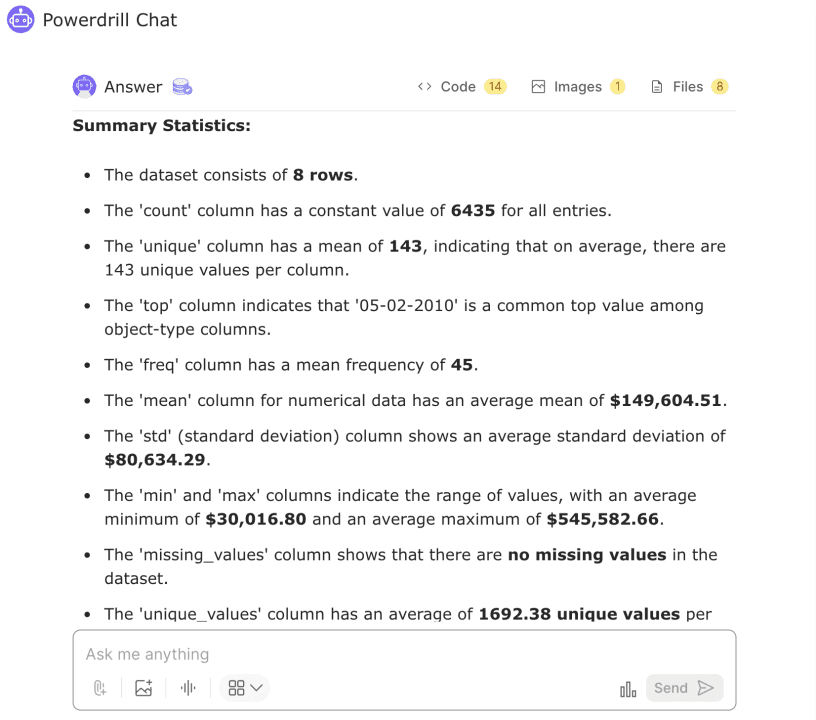
After preprocessing the data to handle missing values and standardize formats, we proceeded to the exploratory data analysis (EDA) phase using Powerdrill. The initial step involved generating updated descriptive statistics, which Powerdrill swiftly provided, revealing critical insights into our refined dataset of 6,401 records. We found that the average weekly sales were approximately $1,036,130.35, with a standard deviation of $545,196.06, indicating considerable variability across different periods and stores.
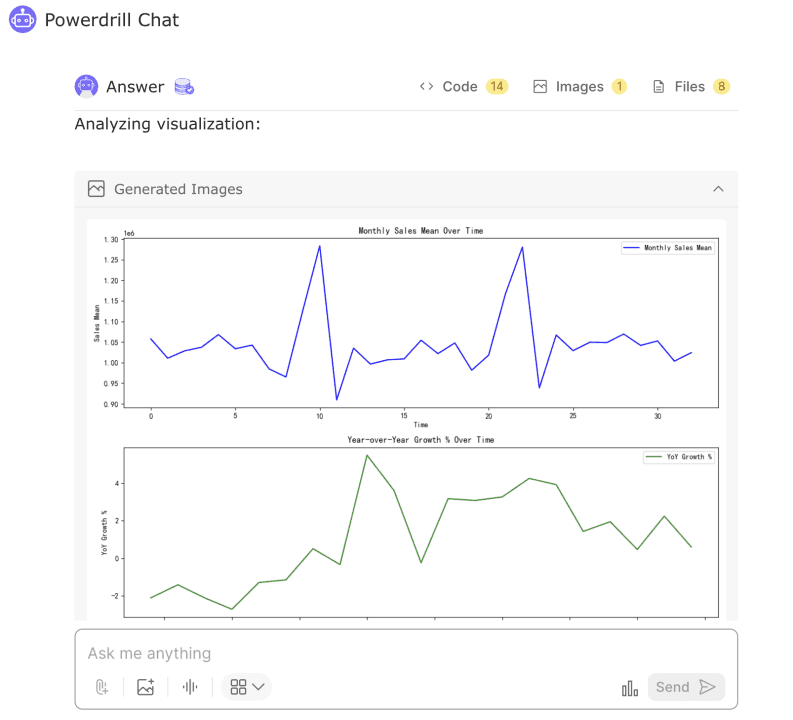
Beyond basic statistics, Powerdrill facilitated an in-depth exploration of the dataset's structure. Visualizations revealed significant trends, such as higher sales during holiday weeks and notable spikes that coincided with promotional events. Scatter plots and correlation analyses highlighted a weak negative relationship between weekly sales and both temperature and unemployment rates, while the correlation with fuel prices was negligible. This comprehensive EDA not only summarized the data but also uncovered patterns and anomalies, laying the groundwork for more detailed subsequent analyses, such as examining the impact of economic indicators on sales performance. This phase was crucial in setting a solid foundation for our deeper exploration and strategic insights into Walmart’s sales dynamics.
Step6: Behavioral Analysis
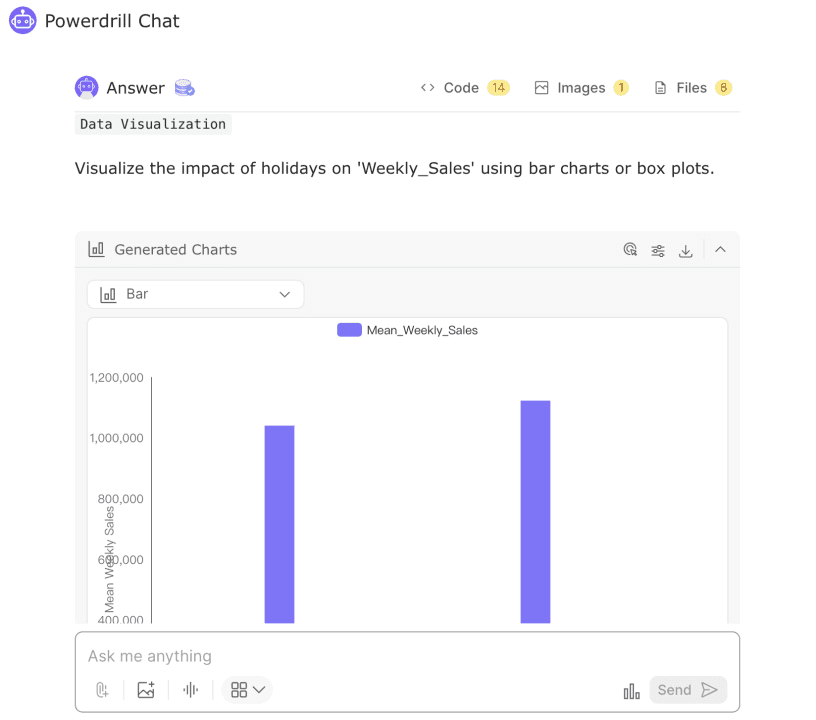
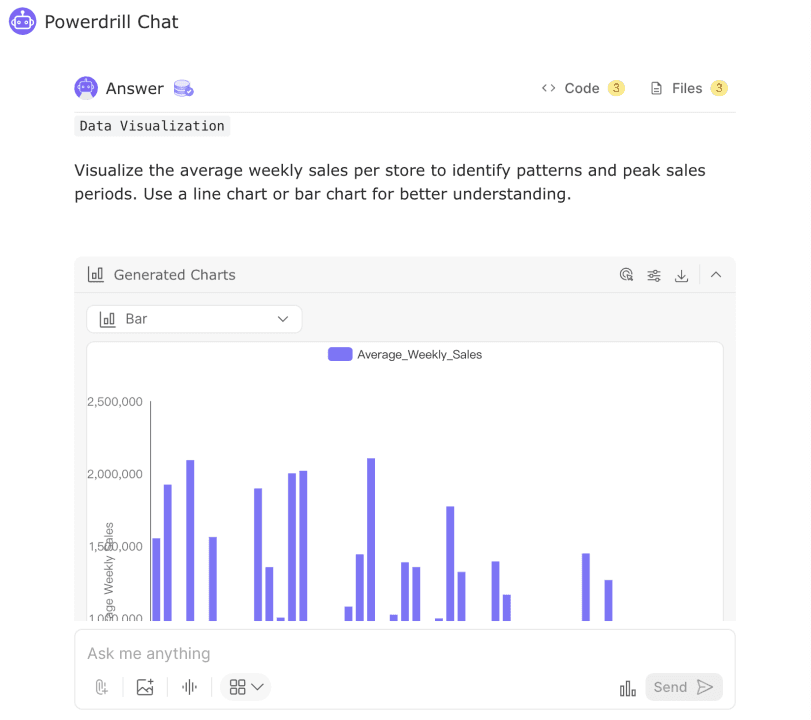
Using the Walmart sales dataset, we performed a behavioral analysis to identify customer purchase patterns and guide marketing strategies. Visualizations indicated notable trends: average weekly sales varied significantly across stores, with peak sales often around holidays or promotional periods. Visual charts showed that departments experienced sales fluctuations, suggesting an impact from promotions or seasonal demands. The analysis revealed that holidays increased sales, as depicted by higher average weekly sales during these periods compared to non-holidays. These insights emphasize key behaviors such as increased seasonal shopping, store-specific customer preferences, and strong responses to promotions. To leverage these findings, Walmart should focus marketing efforts during peak periods, tailor strategies based on store performance, and enhance promotions in departments with variable sales patterns to maximize overall sales.
FAQ
Q: How do I ensure that my retail data is clean before analysis?
A: It's crucial to check for missing values, duplicates, and outliers in your data. Powerdrill can help automate these processes, making data cleaning more efficient.
Q: Can Powerdrill handle large datasets from multiple stores?
A: Yes! Powerdrill is designed to handle large volumes of data, making it an excellent tool for retailers with multiple locations.
Q: How long does it take to analyze retail data with Powerdrill?
A: The analysis time depends on the size of your dataset, but Powerdrill’s advanced AI capabilities can process large datasets quickly and provide real-time insights. Usually it costs within one minute.
Final Words
We've reached the conclusion of our retail analysis journey, transforming Walmart sales data into actionable insights. From data cleaning to uncovering customer behavior patterns, this process demonstrates how systematic analysis can reveal critical trends. Using Powerdrill, we navigated through structured steps, making complex data analysis accessible and insightful. Our exploration uncovered significant variability in weekly sales, highlighted the impact of holidays, and identified key patterns in customer purchases. This analysis shows how data, when thoroughly examined, provides a clear narrative and practical strategies for optimizing retail performance. We hope this guide has made data analysis less intimidating and more engaging for those interested in discovering valuable insights within their data.
These insights will help Walmart strategically plan promotions and optimize inventory during peak periods.


