
The fashion industry is evolving faster than ever.
Trends now emerge and fade in the blink of an eye. In this high-speed environment, fashion brands that fail to keep pace risk not just stagnation, but irrelevance. The question is no longer if data can help, but how it can be harnessed to stay ahead.
What if you could predict the next big trend—not by intuition or guesswork, but through data-driven insights?
In this article, we’ll explore a real-world application of how to leverage advanced data analysis techniques to identify emerging fashion trends across Europe in 2025. We’ll walk through how a robust and comprehensive dataset—spanning sales performance, customer behavior, and market dynamics—can unlock powerful strategic insights across multiple countries.
About the Dataset
The dataset used in this analysis offers a rich, multi-dimensional view of the evolving European fashion retail landscape during the critical period from 2024 to 2025. Its depth and diversity make it an ideal foundation for trend discovery and consumer analysis.
The dataset includes:
Sales performance across diverse product categories and time frames
Customer demographics, including age, gender, region, and shopping preferences
Product-level details, such as type, color, material, brand, and pricing
Sales channel data, distinguishing between e-commerce and physical retail
Time-series data, enabling longitudinal analysis across seasons and promotional periods
This rich data structure allows fashion professionals to move beyond surface-level trends and dive into granular insights—identifying not just what is selling, but why, where, and to whom.
It’s an invaluable resource for:
Spotting emerging consumer patterns
Informing product development and collection planning
Tailoring regional marketing campaigns
Enhancing omnichannel strategies
Improving inventory forecasting and sustainability practices
Key Business Questions That Data Can Answer
Fashion retailers and brand strategists are increasingly turning to data to gain clarity on questions such as:
Which product categories are generating the highest revenue and profit margins?
How do consumer preferences shift across platforms (mobile, desktop, in-store)?
What’s the quantifiable impact of seasonal changes and events on demand?
Are current pricing strategies aligned with market willingness to pay?
How do factors like color, size, and gender targeting affect sell-through rates?
Where are the hidden opportunities to optimize inventory, reduce returns, and minimize waste?
These aren’t just academic questions—they translate directly into business results. And that’s where Powerdrill Bloom becomes a game-changer.
Key Benefits of Powerdrill Bloom
Powerdrill Bloom is a next-generation analytics tool built for the fashion industry’s modern challenges. It transforms raw data into real-time insights, helping brands make smarter, faster, and more strategic decisions.
✅ Automated Data Exploration and Visualization
Powerdrill Bloom simplifies the analytical process by automatically exploring uploaded datasets. It instantly generates visually intuitive dashboards and charts, allowing teams to gain insights without writing a single line of code or configuring complex settings.
✅ Integrated Online and Private Data Analysis
Bloom seamlessly blends public web data (such as social media trends or market benchmarks) with your internal sales and customer data. This dual-layer analysis delivers a more holistic, accurate, and actionable view of market dynamics—bridging the gap between internal performance and external trends.
✅ Path‑Based Deep Exploration
Thanks to its multi-path exploration capabilities, Bloom enables users to follow multiple analytical trails—drilling down into customer segments, product variants, seasonal effects, and more. This layered approach helps surface insights that would often remain buried in traditional reports.
✅ Instant Presentation Generation
After completing the analysis, Powerdrill Bloom can automatically generate polished, professional PowerPoint presentations. This feature eliminates the need for additional formatting, allowing teams to focus on sharing insights and executing strategies—whether in team meetings, stakeholder briefings, or investor updates.
How to Use Powerdrill Bloom to Analyze Fashion Trends
Step 1: Prepare Your Fashion Market Data
Start by preparing the fashion market data you'd like to analyze. You can either collect your own data or download an existing open dataset. For this guide, we’ll use a public dataset from Kaggle as an example. Here are the requirements for your data:
File should be in
.xls,.xlsx, or.csvformat.Multiple files can be uploadat once, but each file must be under 20MB.
Whether you're working with e-commerce sales, product catalog info, or marketing performance data, make sure it's well-organized and ready for upload.
Step 2: Sign in to Powerdrill Bloom
Next, head over to Powerdrill Bloom to start your data-driven journey.
Visit: https://bloom.powerdrill.ai.
Sign in with your email to access your workspace.
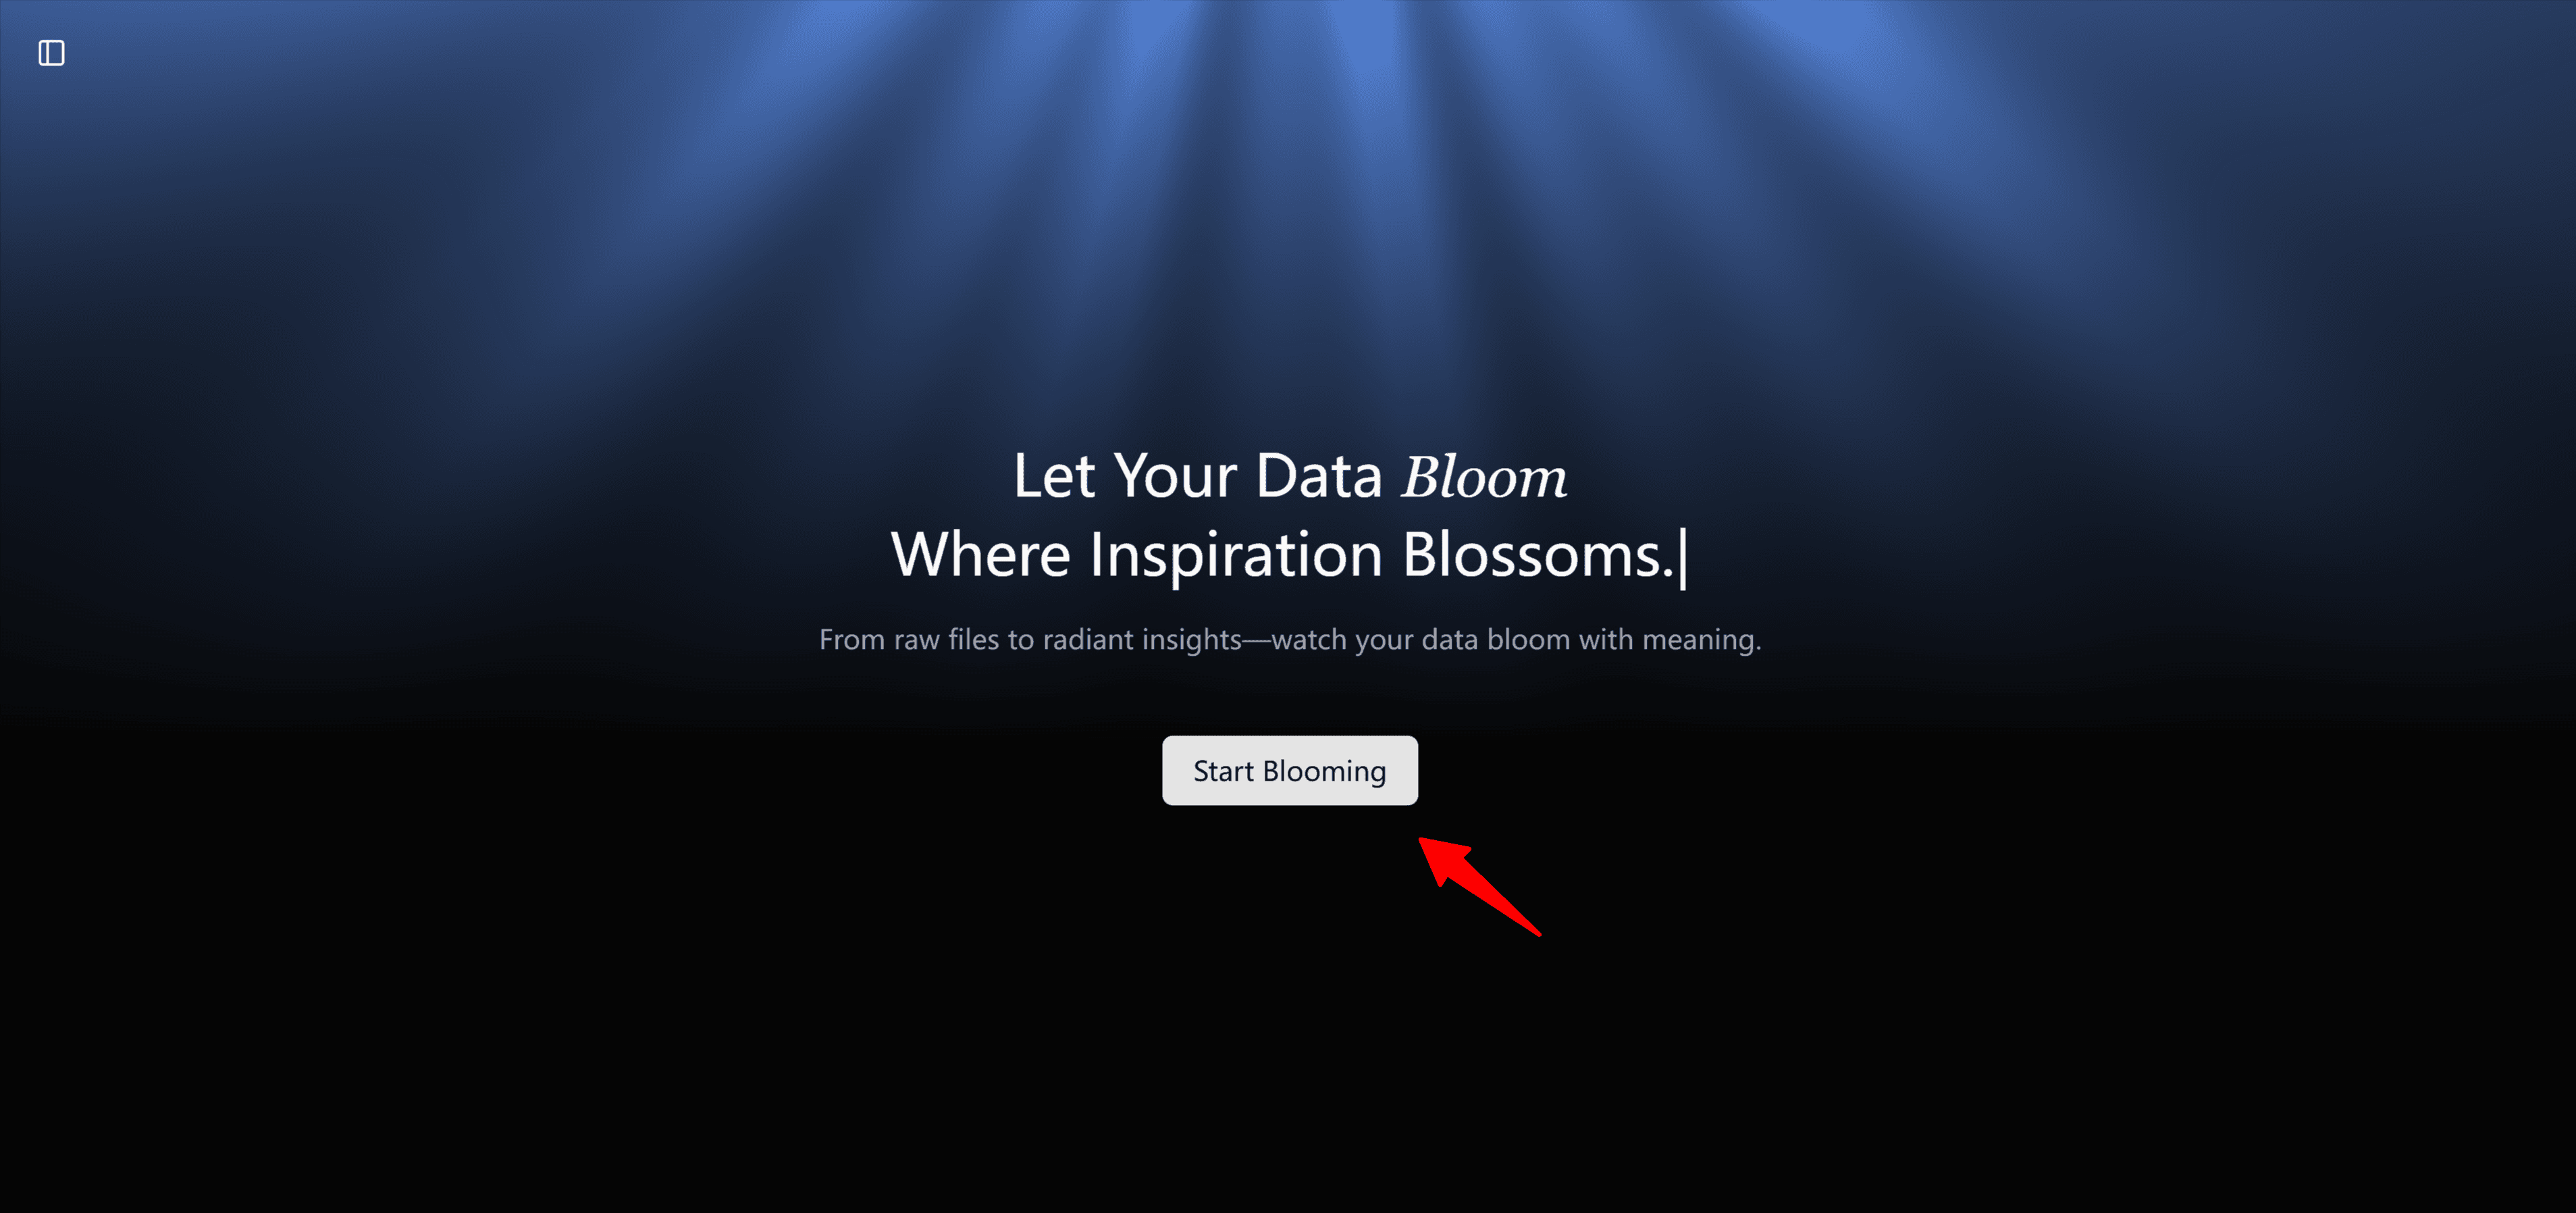
You’ll land on a clean and simple login page where you can quickly enter your credentials.
Step 3: Upload Your Data Files
Now it's time to upload your dataset(s) to Bloom. Don’t worry—your data is safe and securely handled.
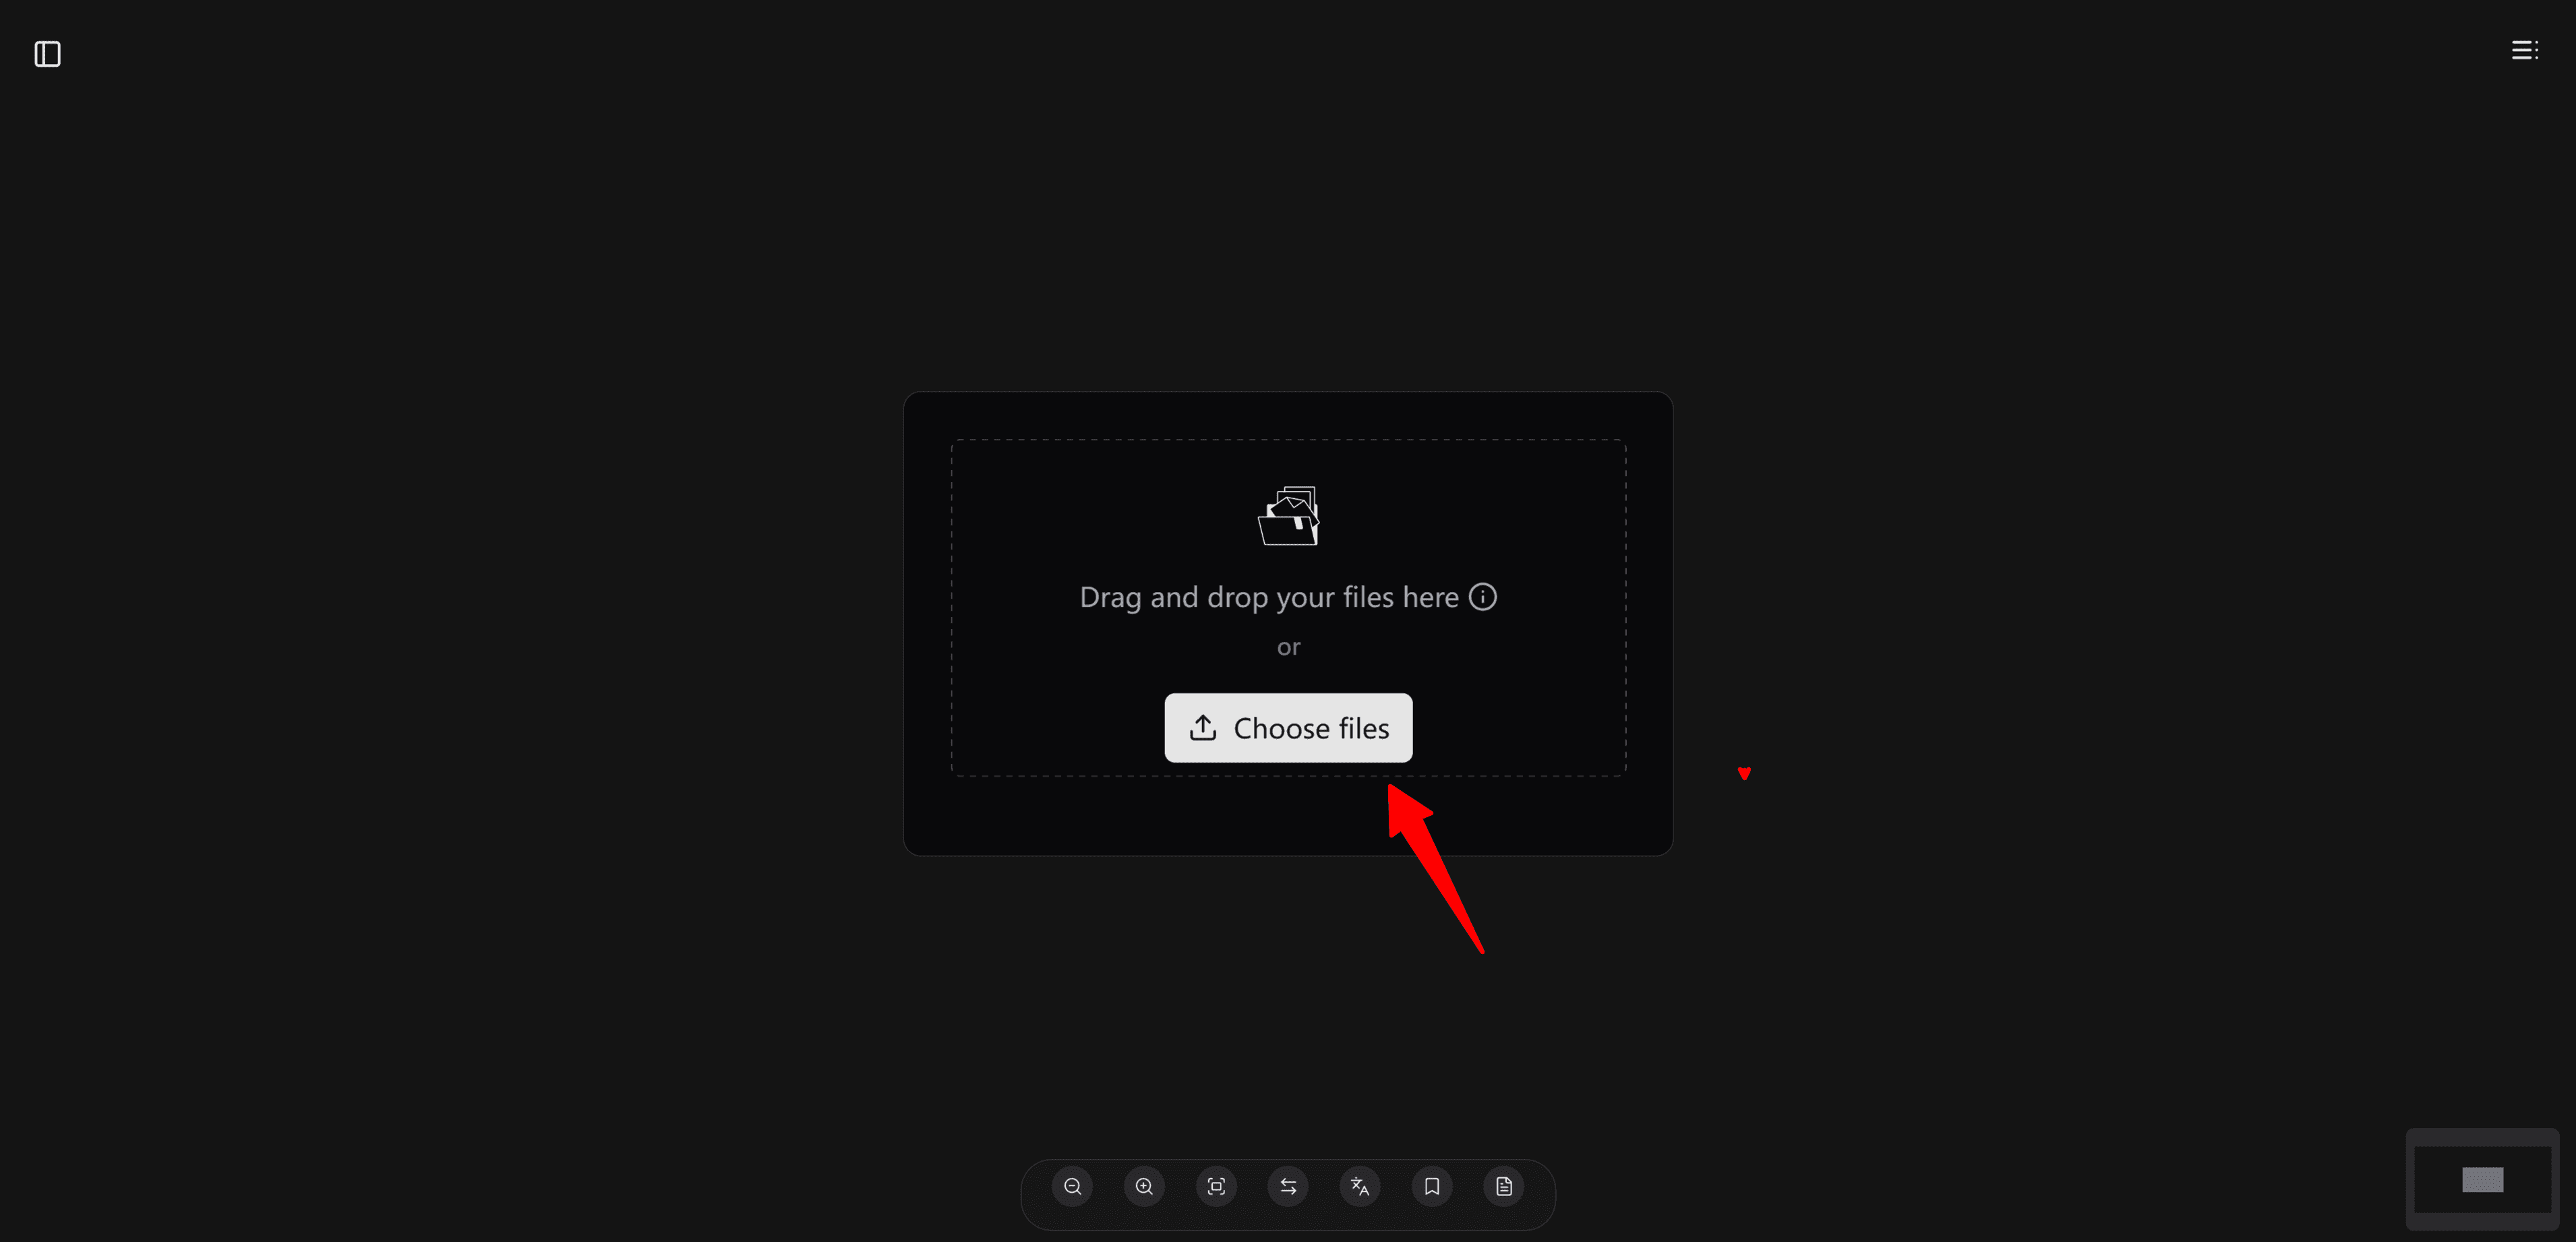
Click the “Choose files” button to select your files.
Tip: If you plan to upload multiple files, be sure to select them all at once.
Once your upload begins, Bloom’s AI agent team immediately starts processing your data—handling tasks like cleaning, structure checks, and basic formatting.
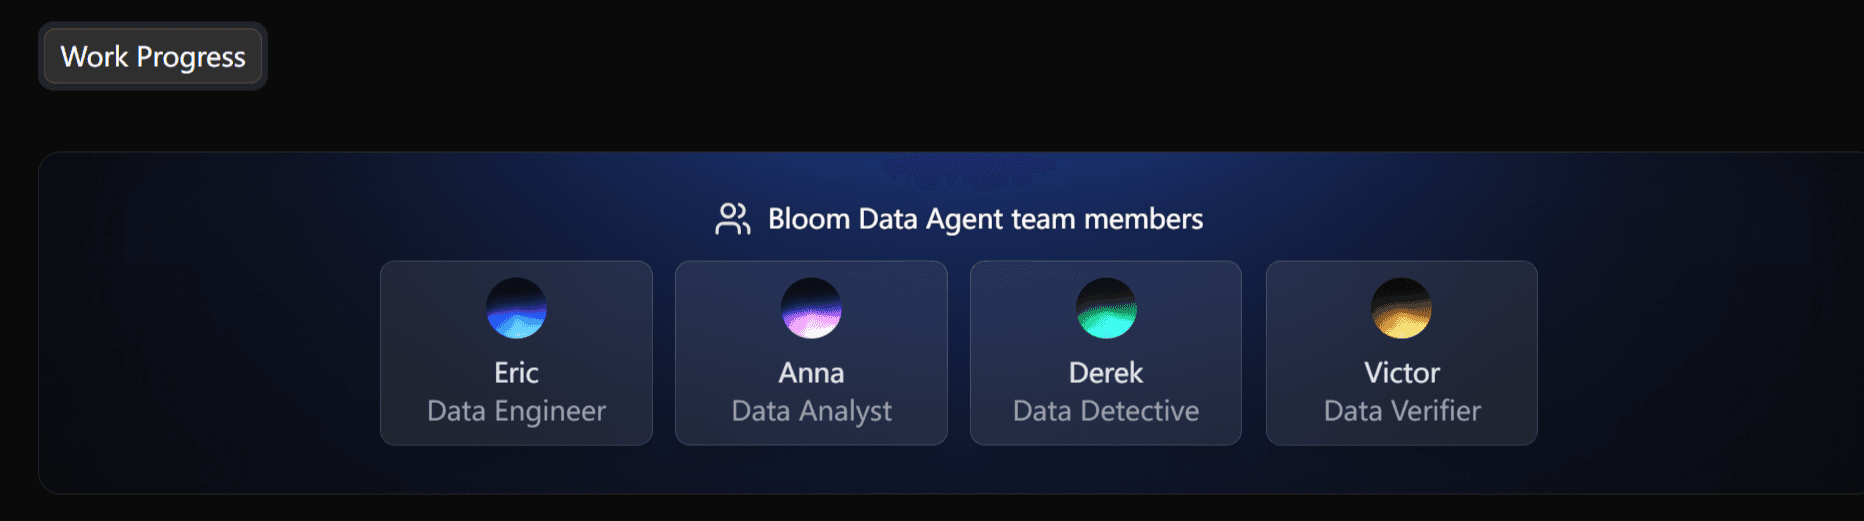
This preprocessing step takes about 1–2 minutes, and then you’re ready to explore.
Step 4: Explore the Data
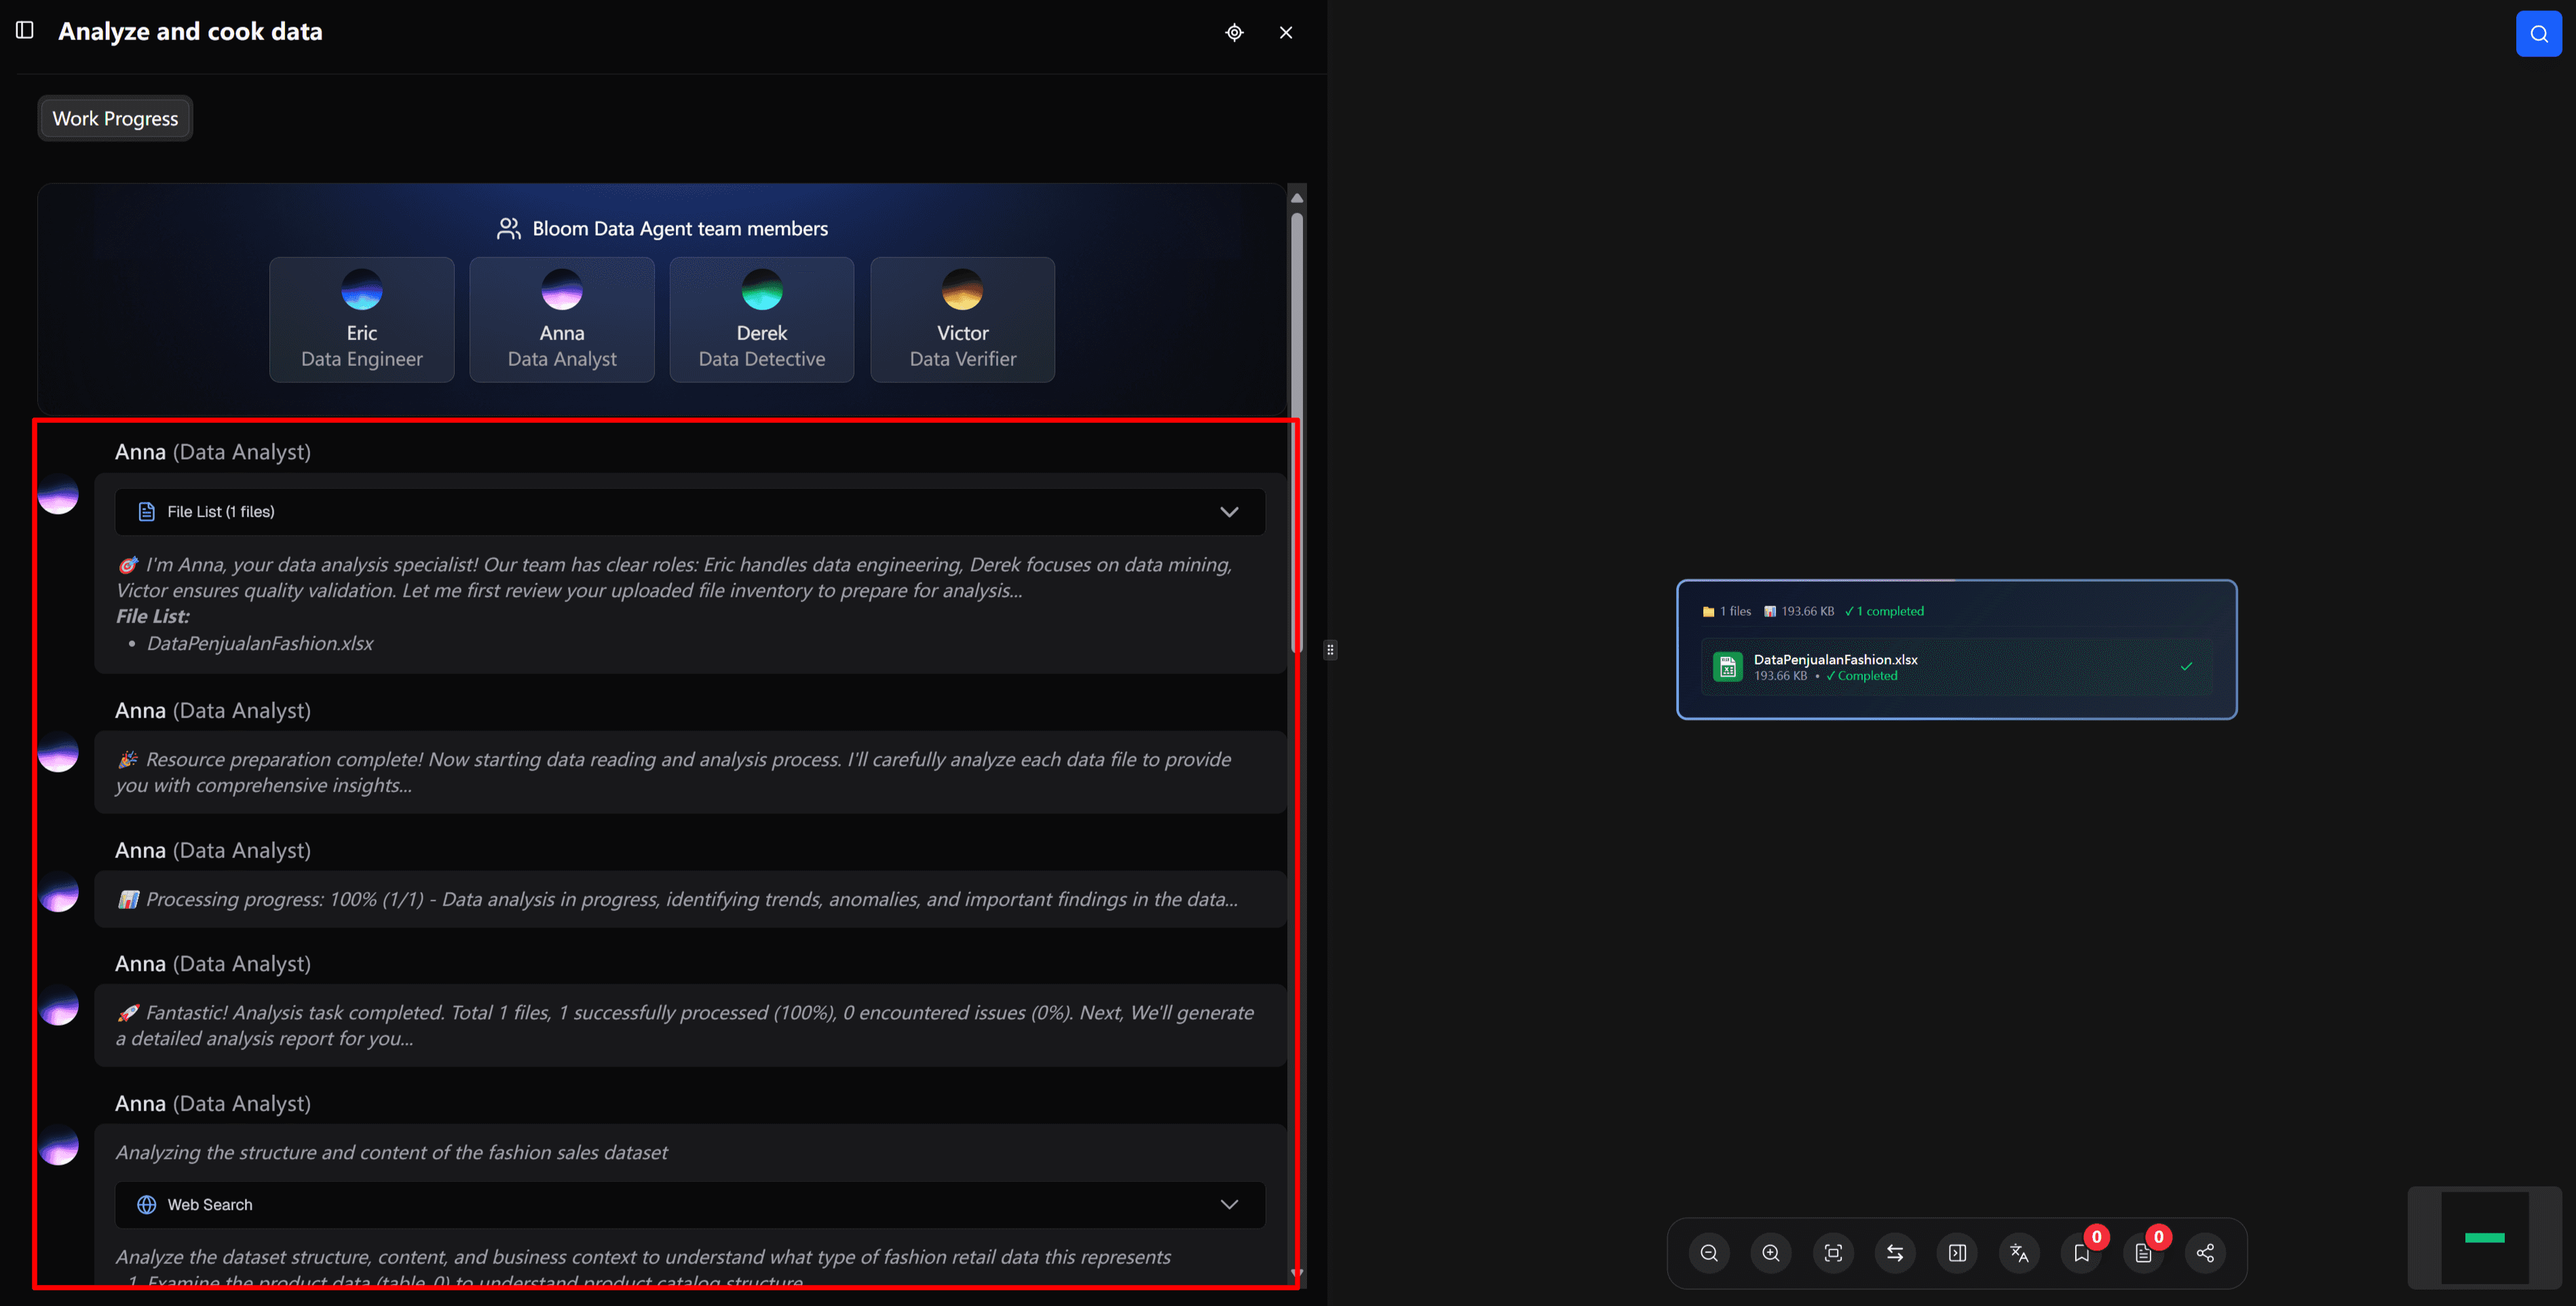
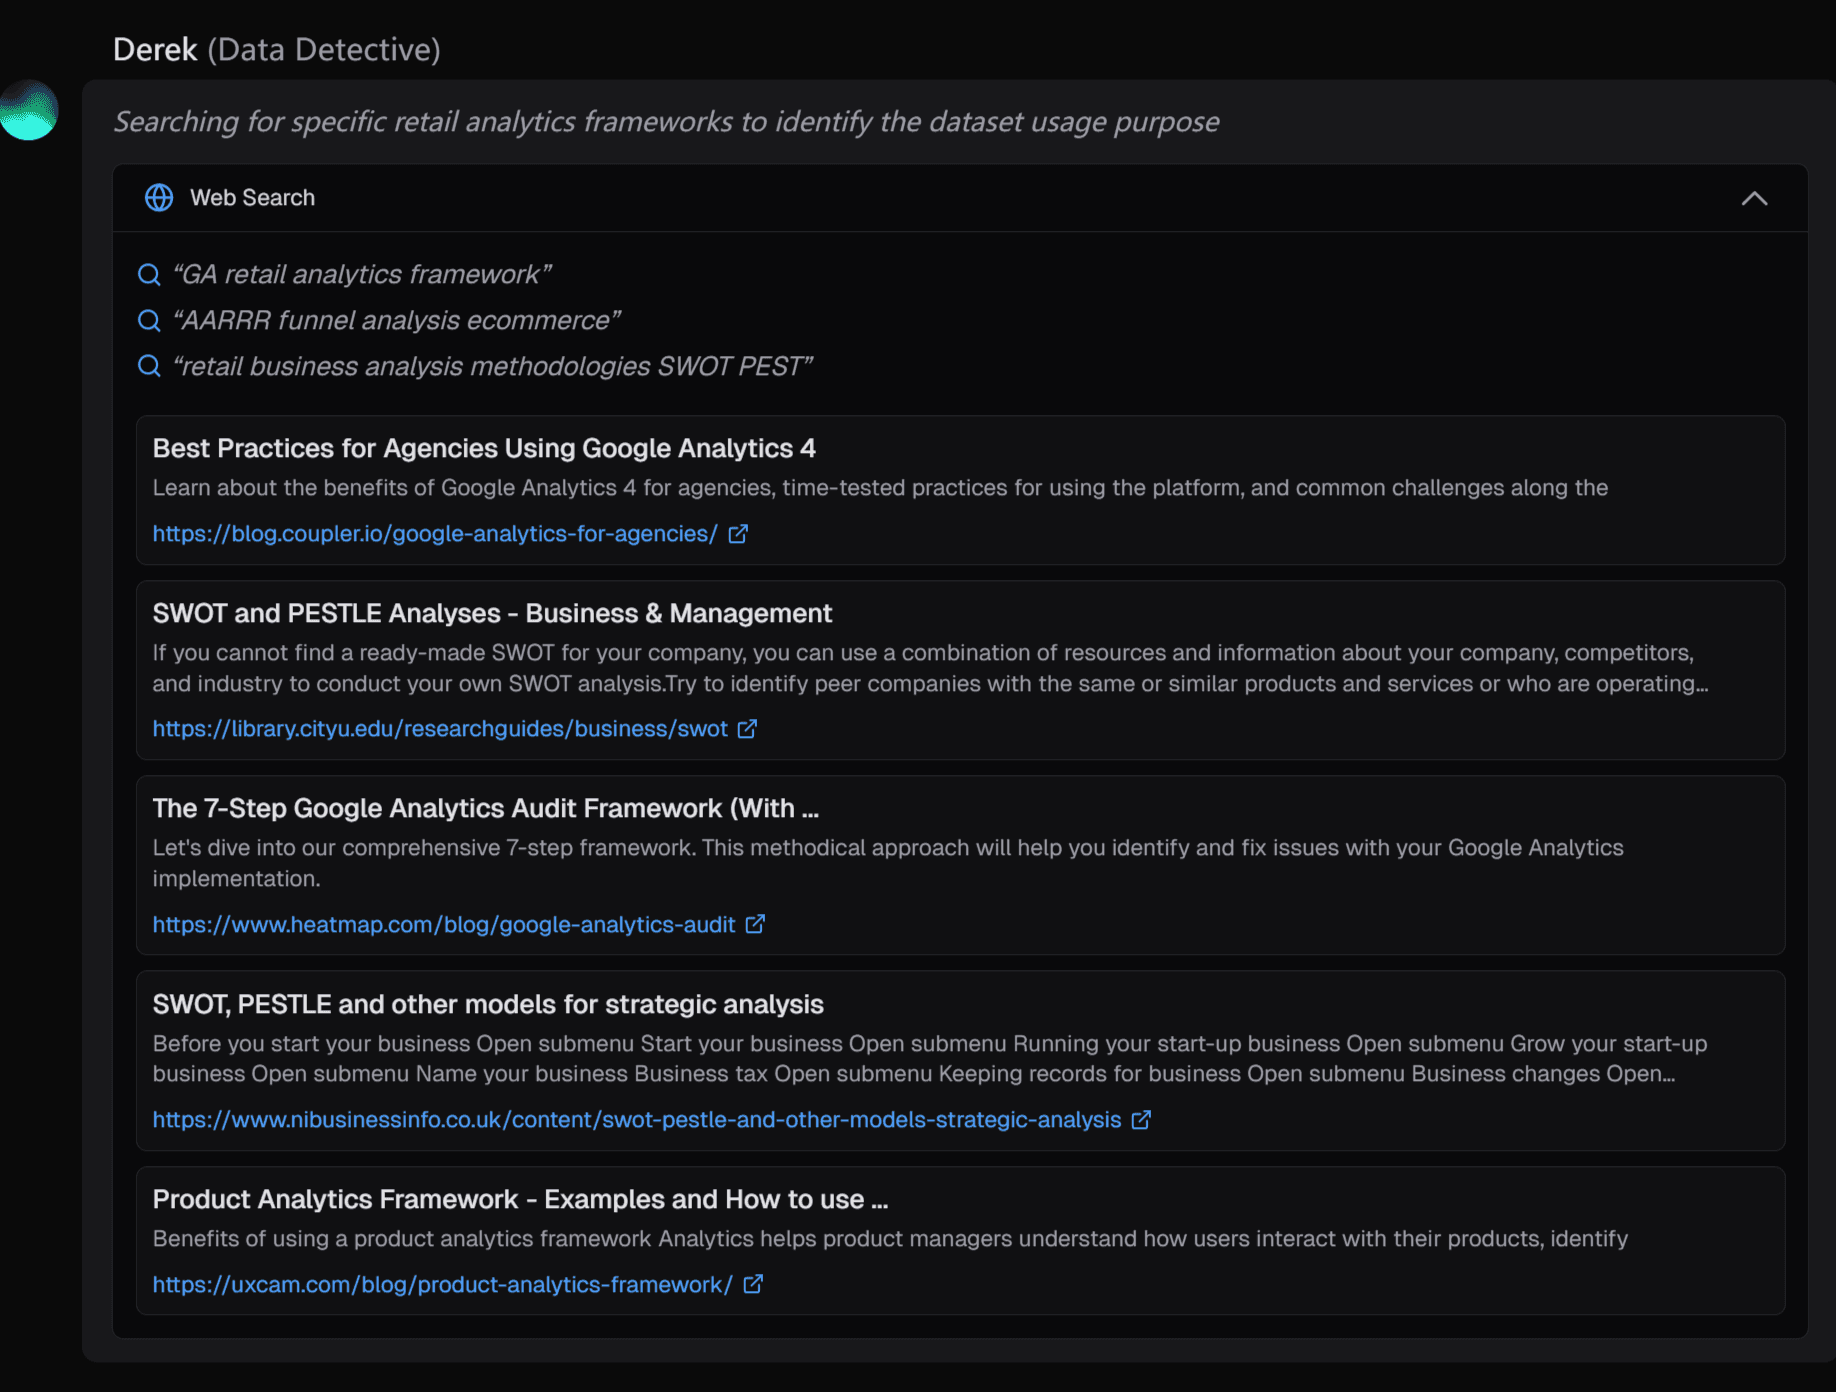
After preprocessing, our AI data engineer Derek performs a real-time web search to gather relevant market intelligence that enriches your analysis.
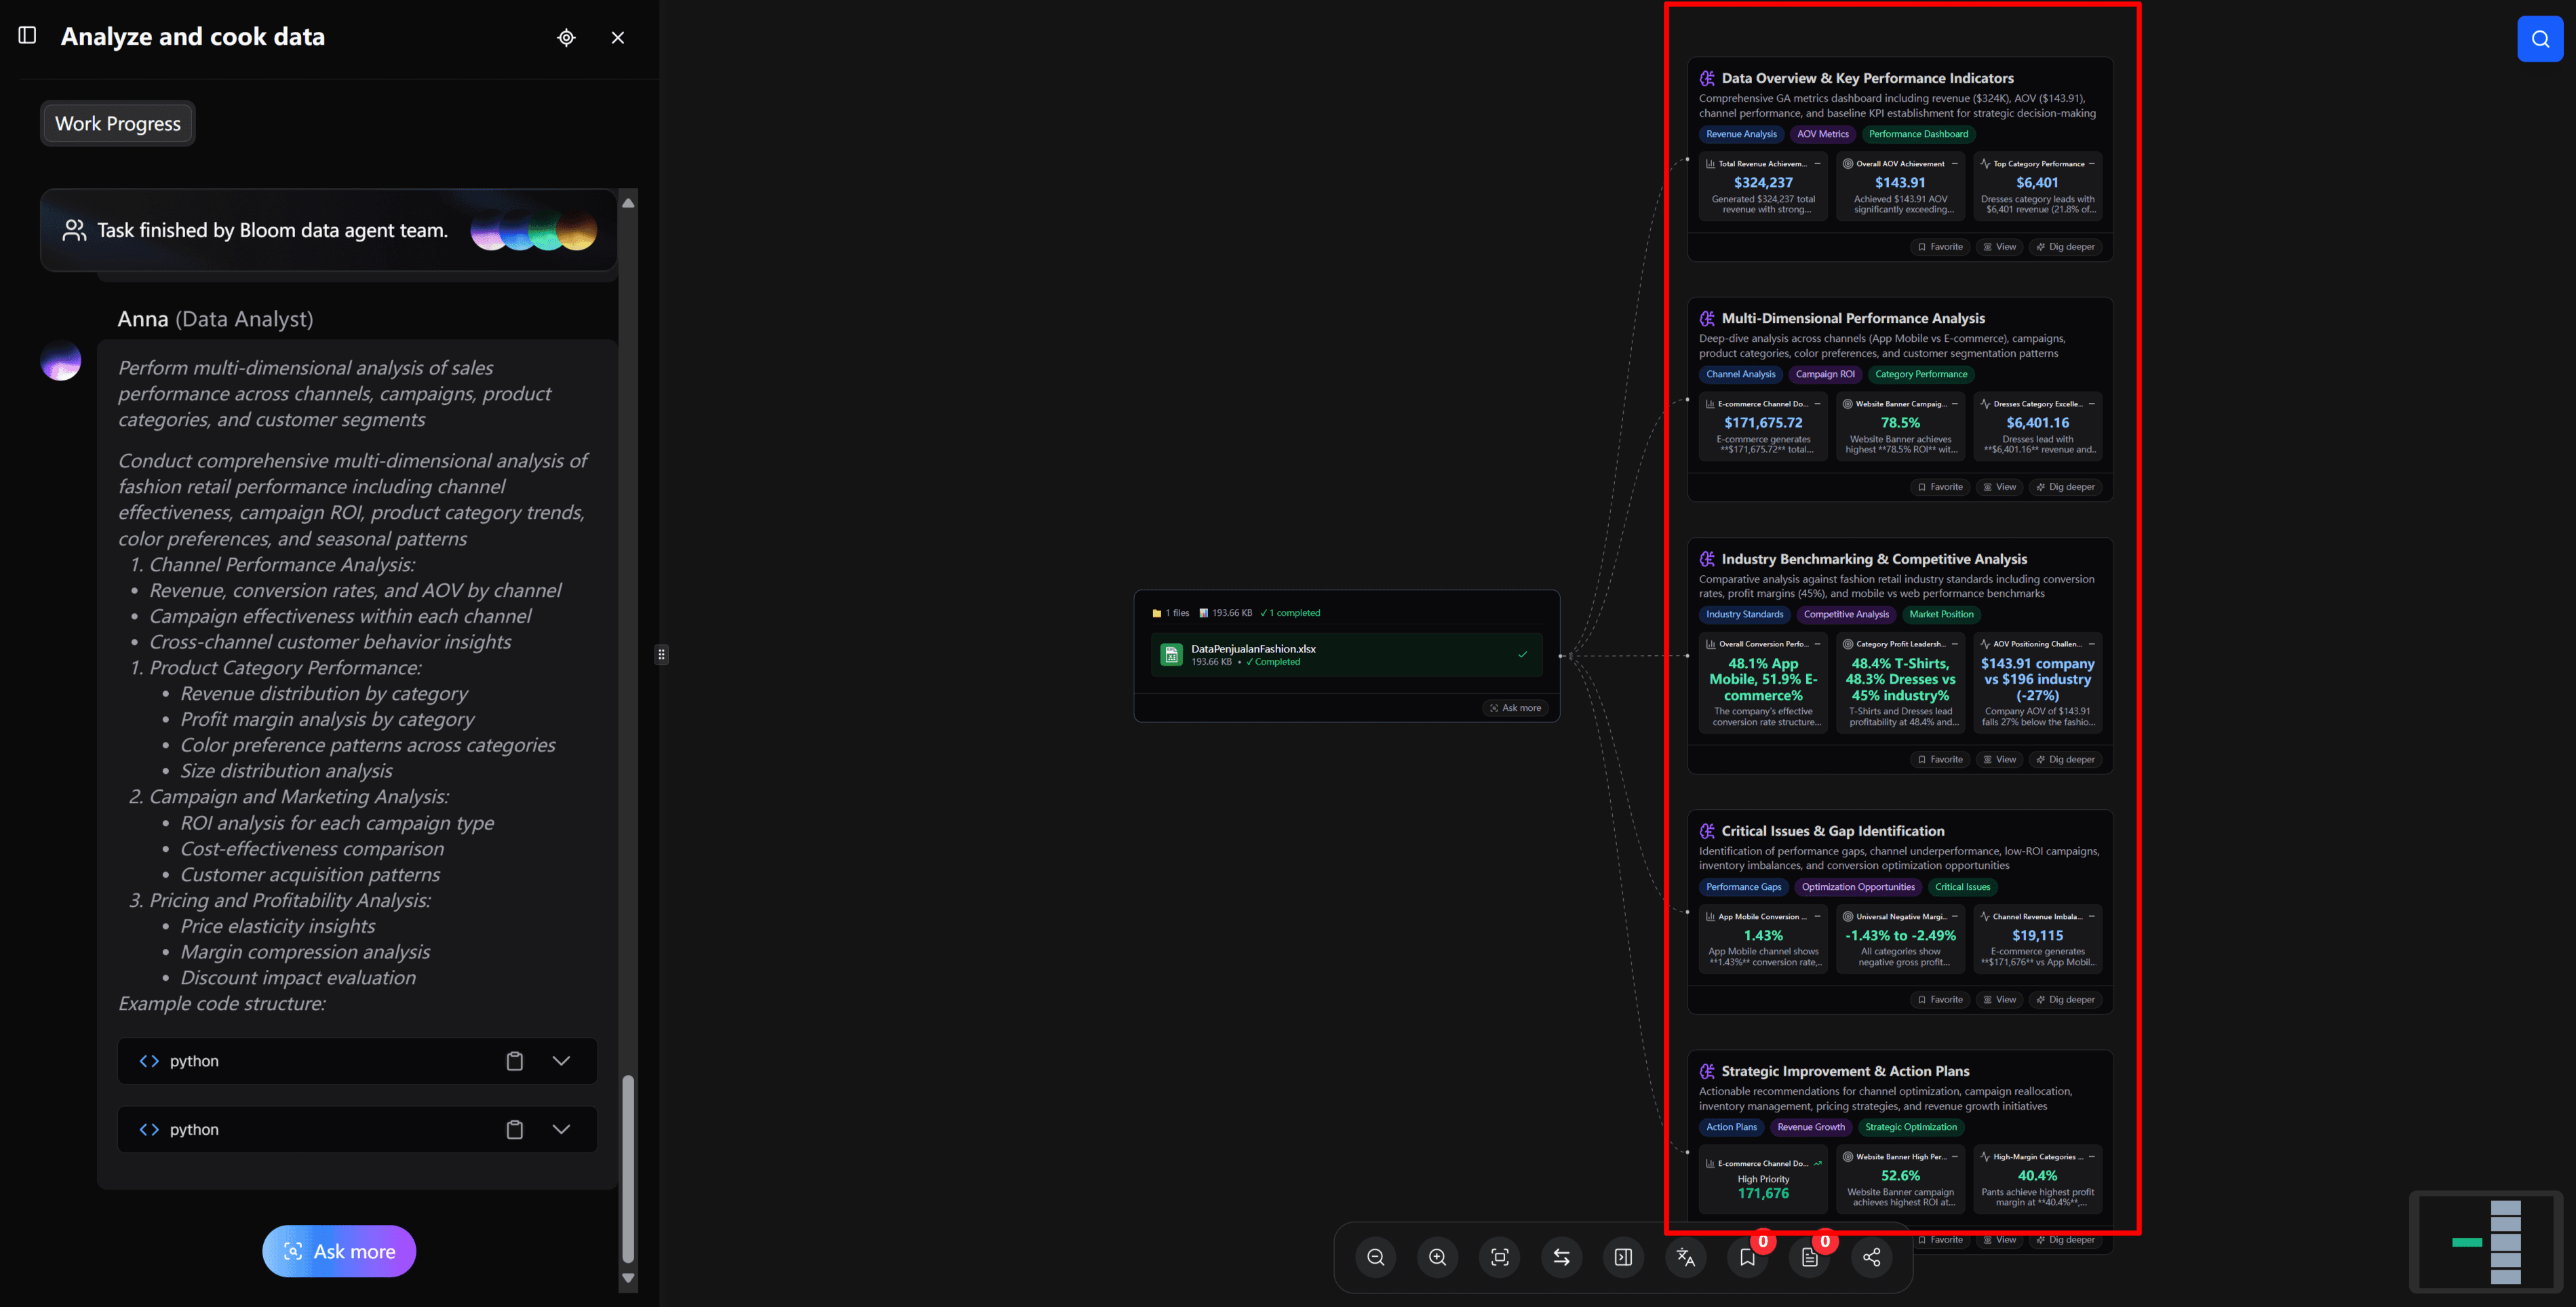
Meanwhile, our AI data analyst Anna jumps in to begin the initial analysis. If you’re not quite sure where to start, Anna’s explorations will provide inspiration and reference points.
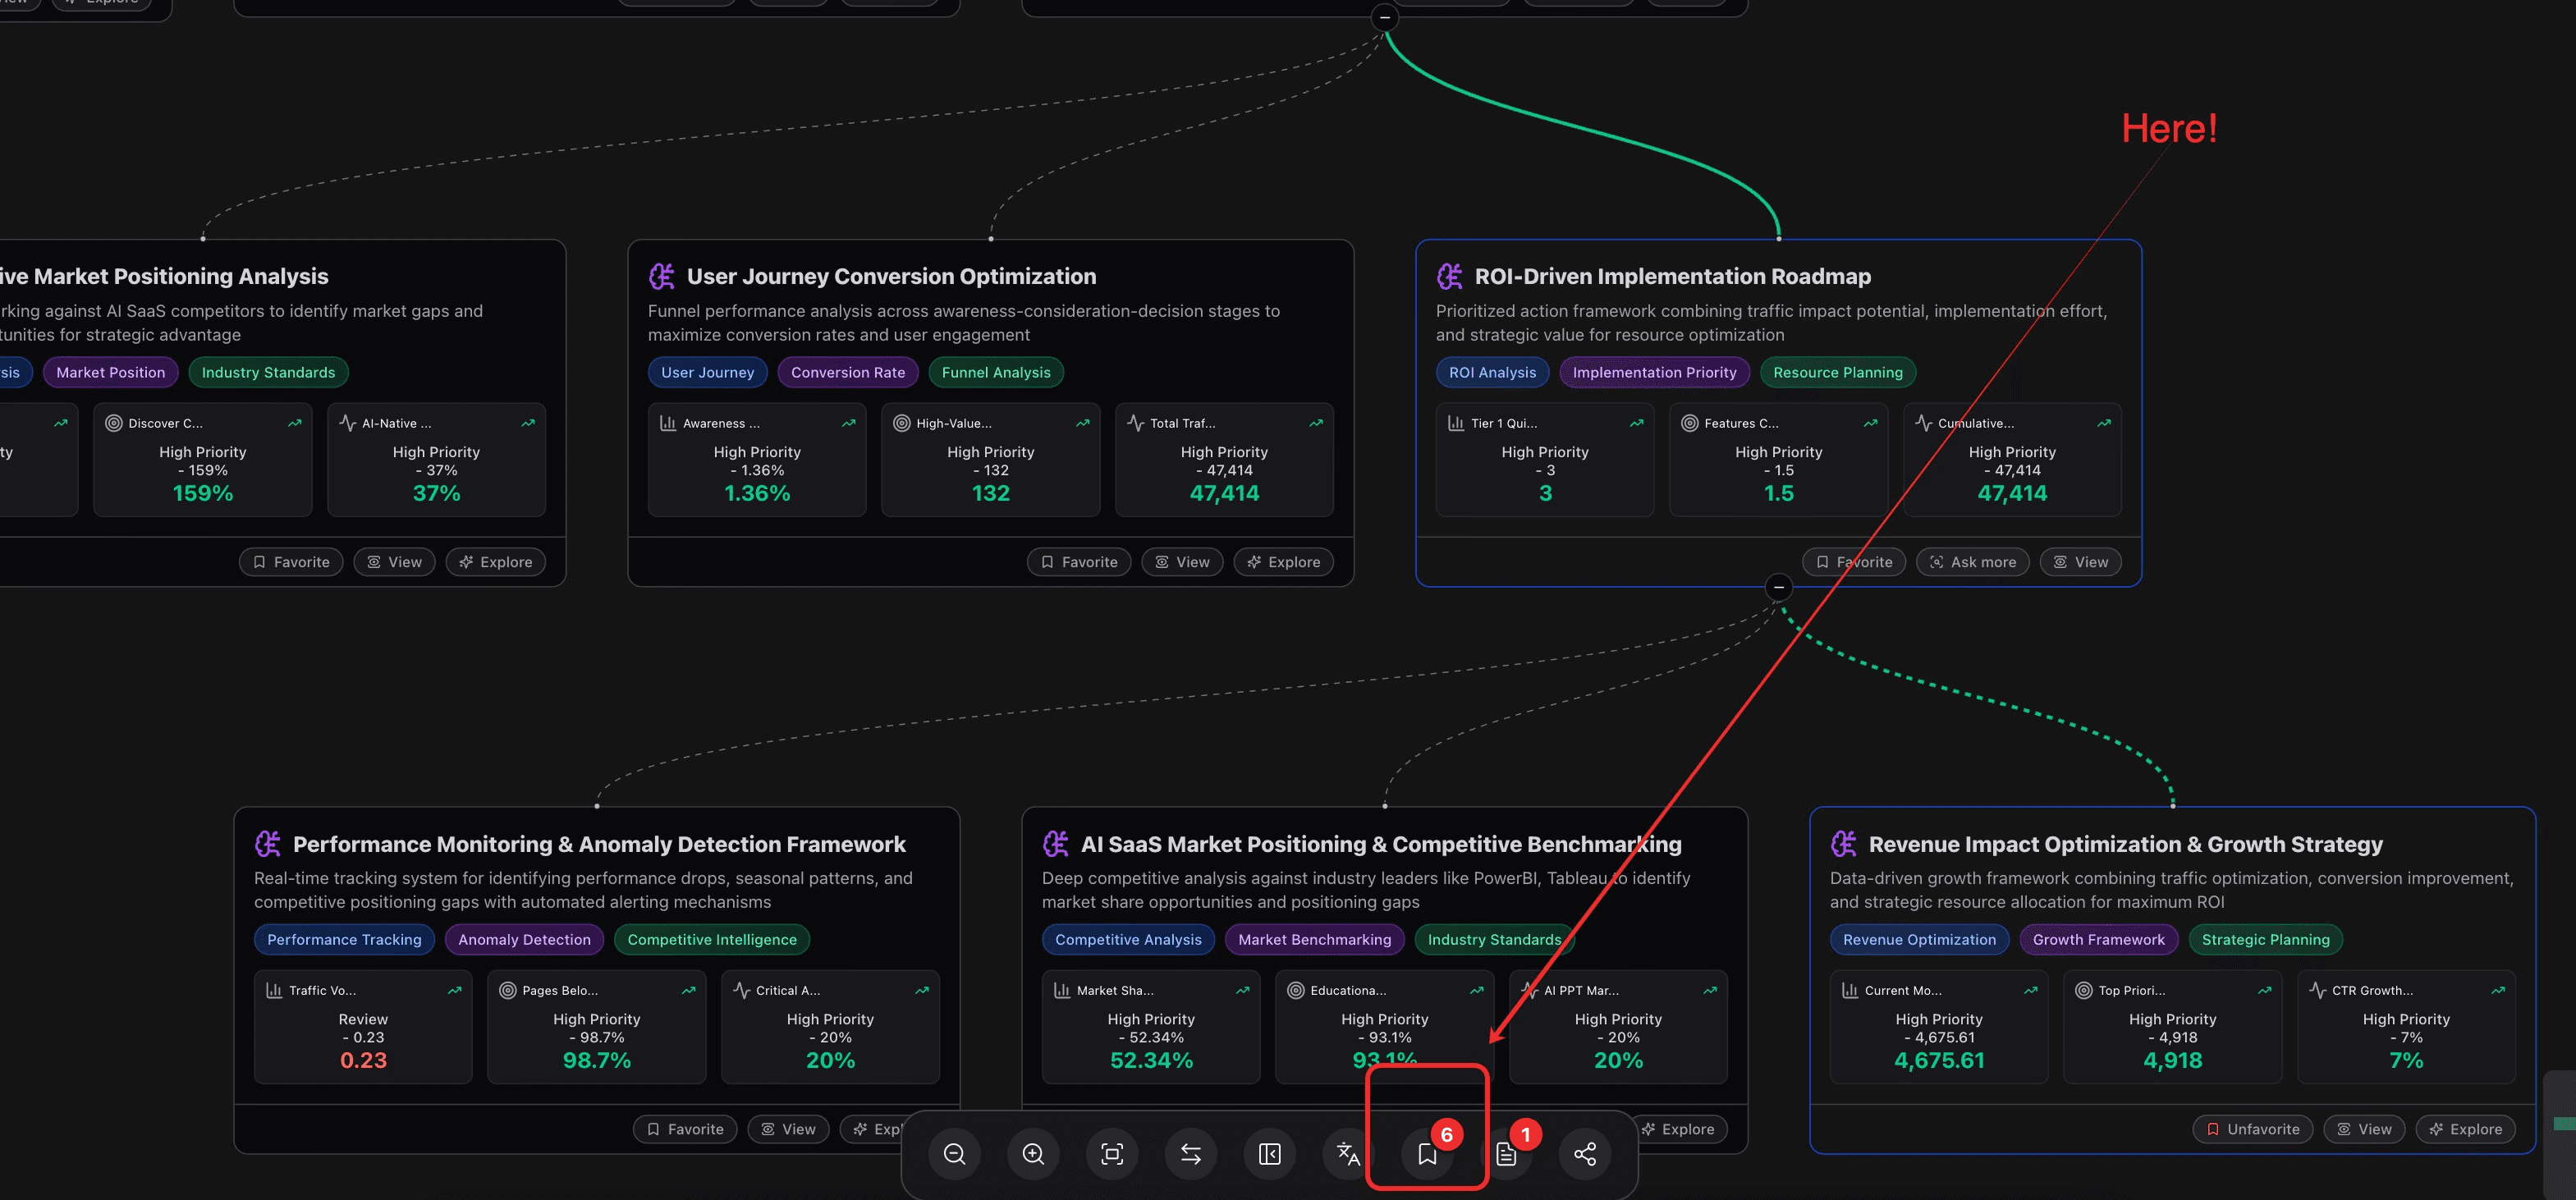
You’ll see a clear exploration path visualized on the AI canvas. Each node represents a different direction or insight.
The previous one was a bit small. This is a clear version. You can scroll the mouse to zoom in or out on the canvas.
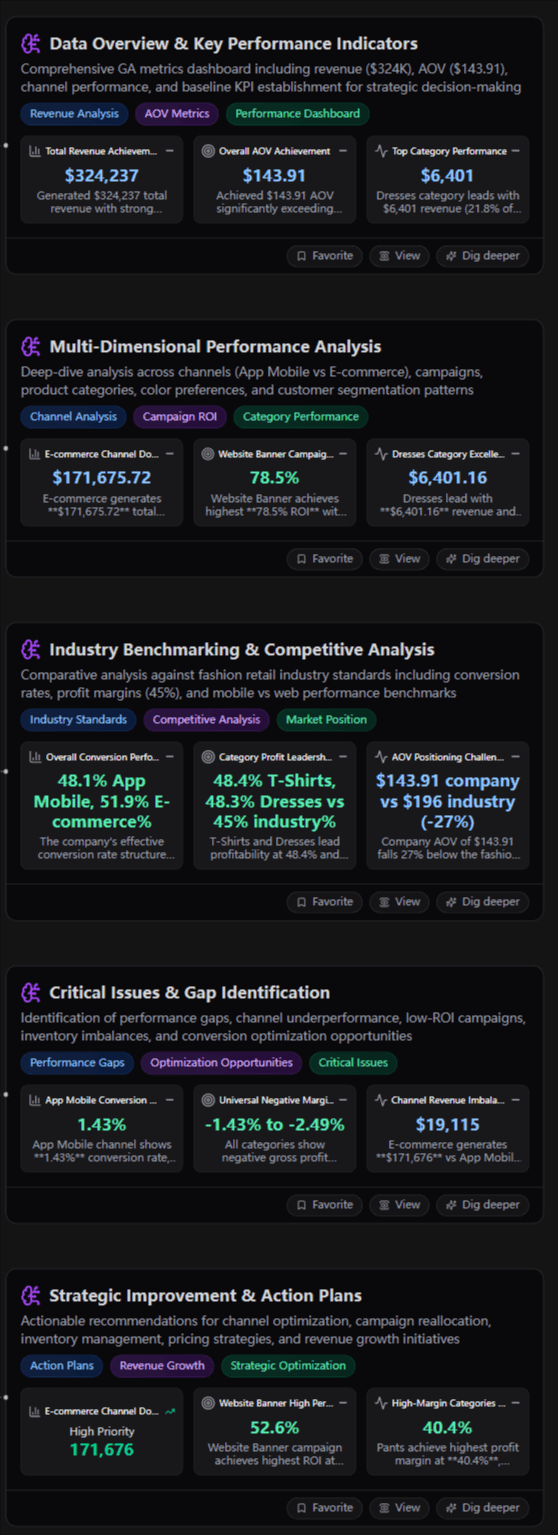
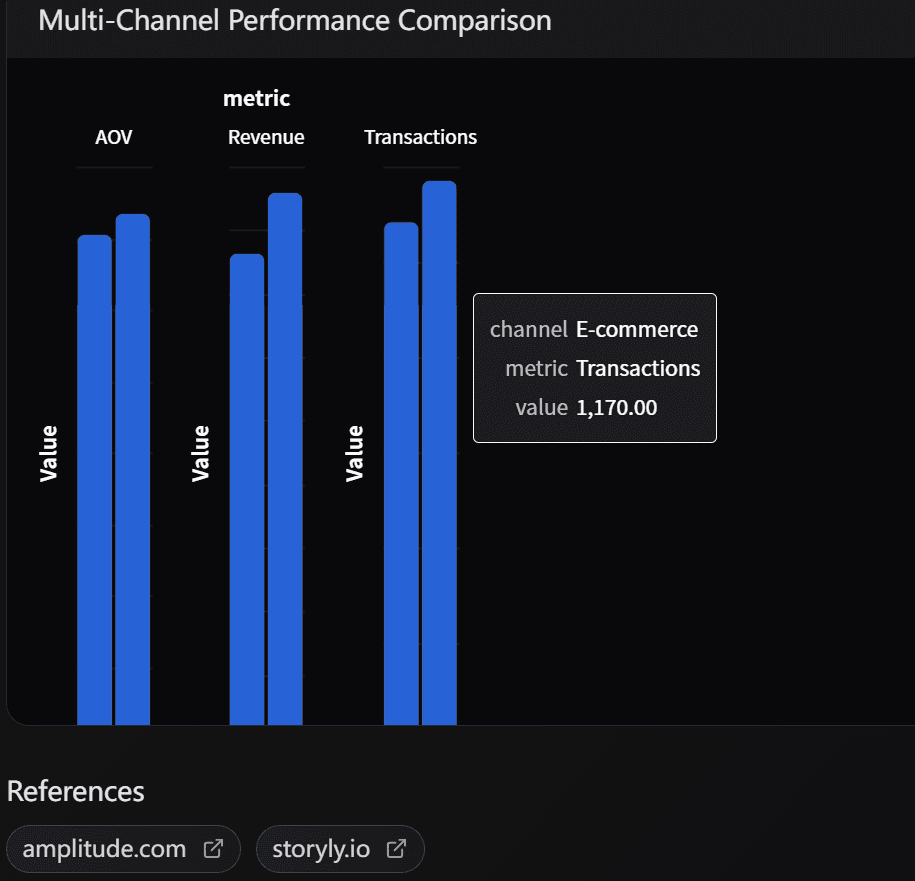
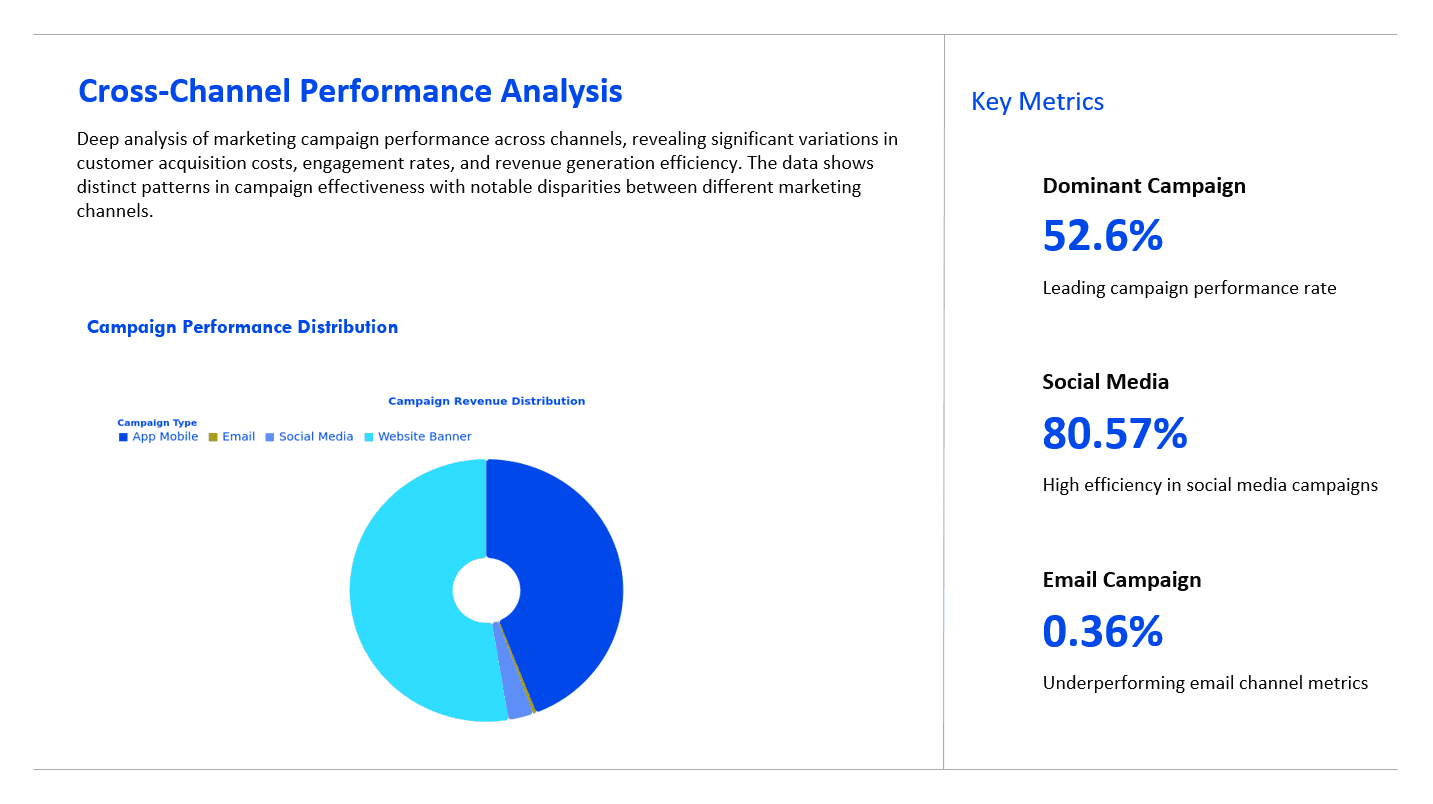
Simply select a node and click “View” to view actionable takeaways along with clean, easy-to-understand visualizations.
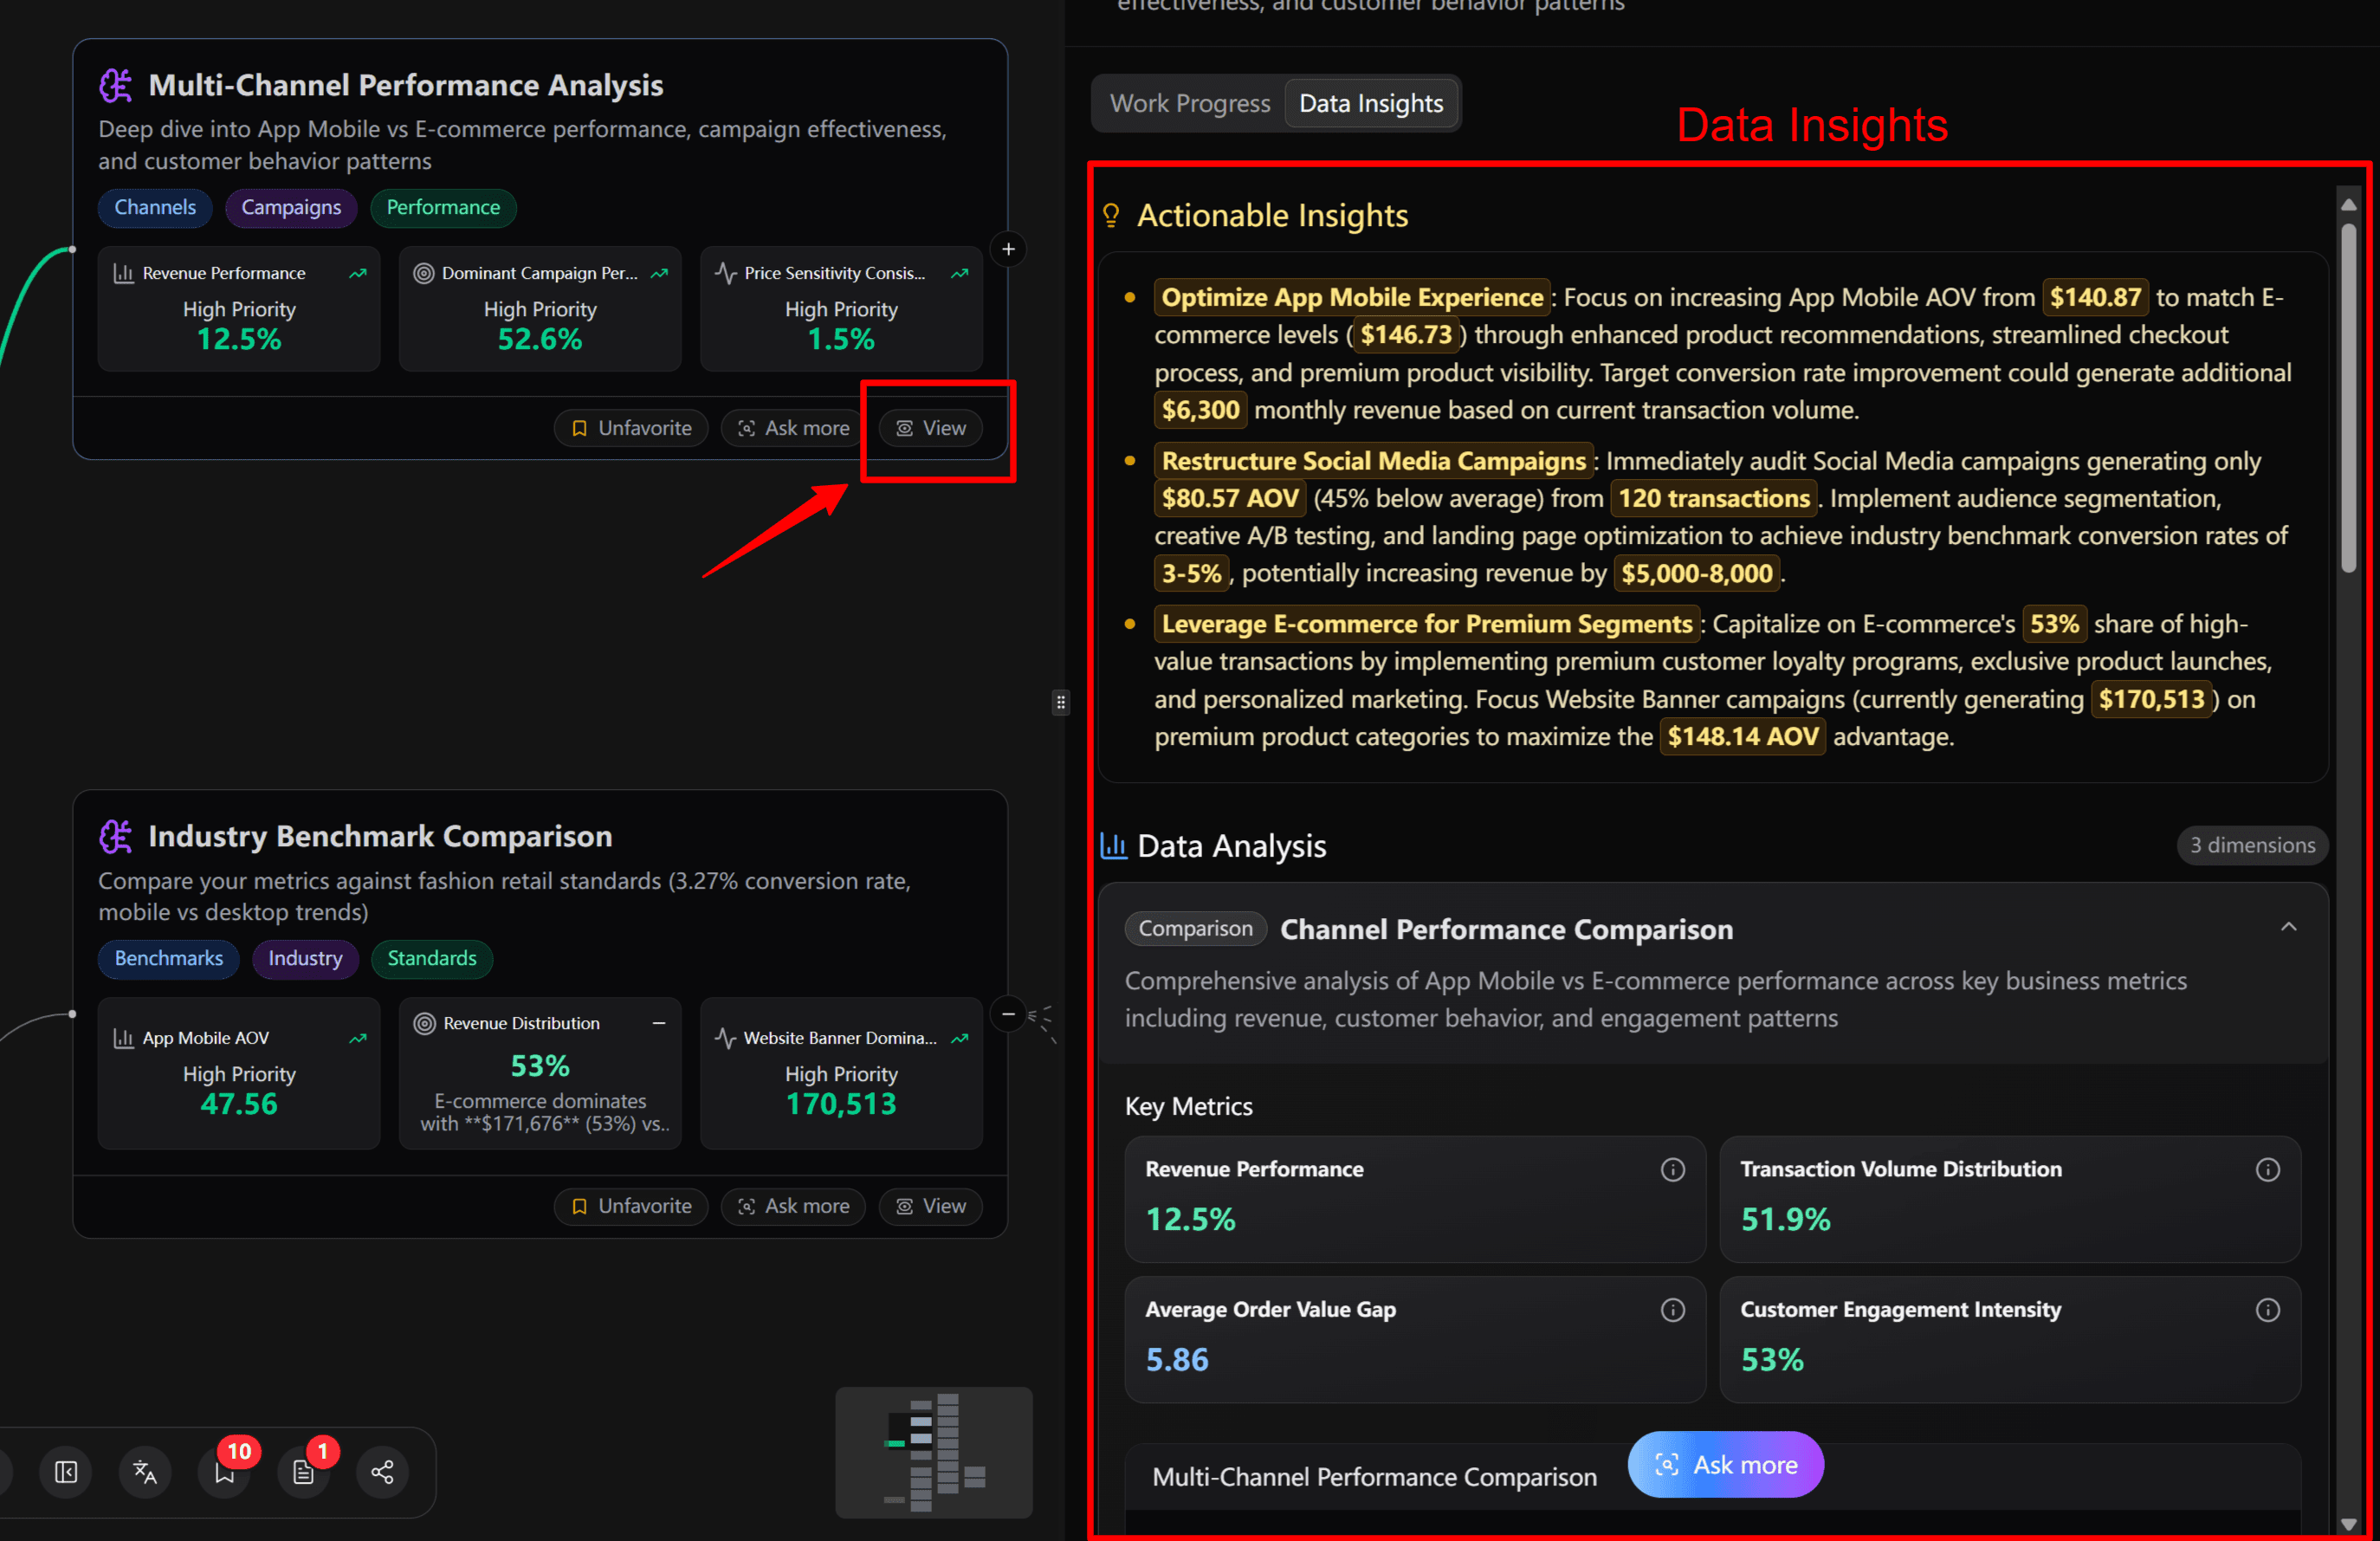
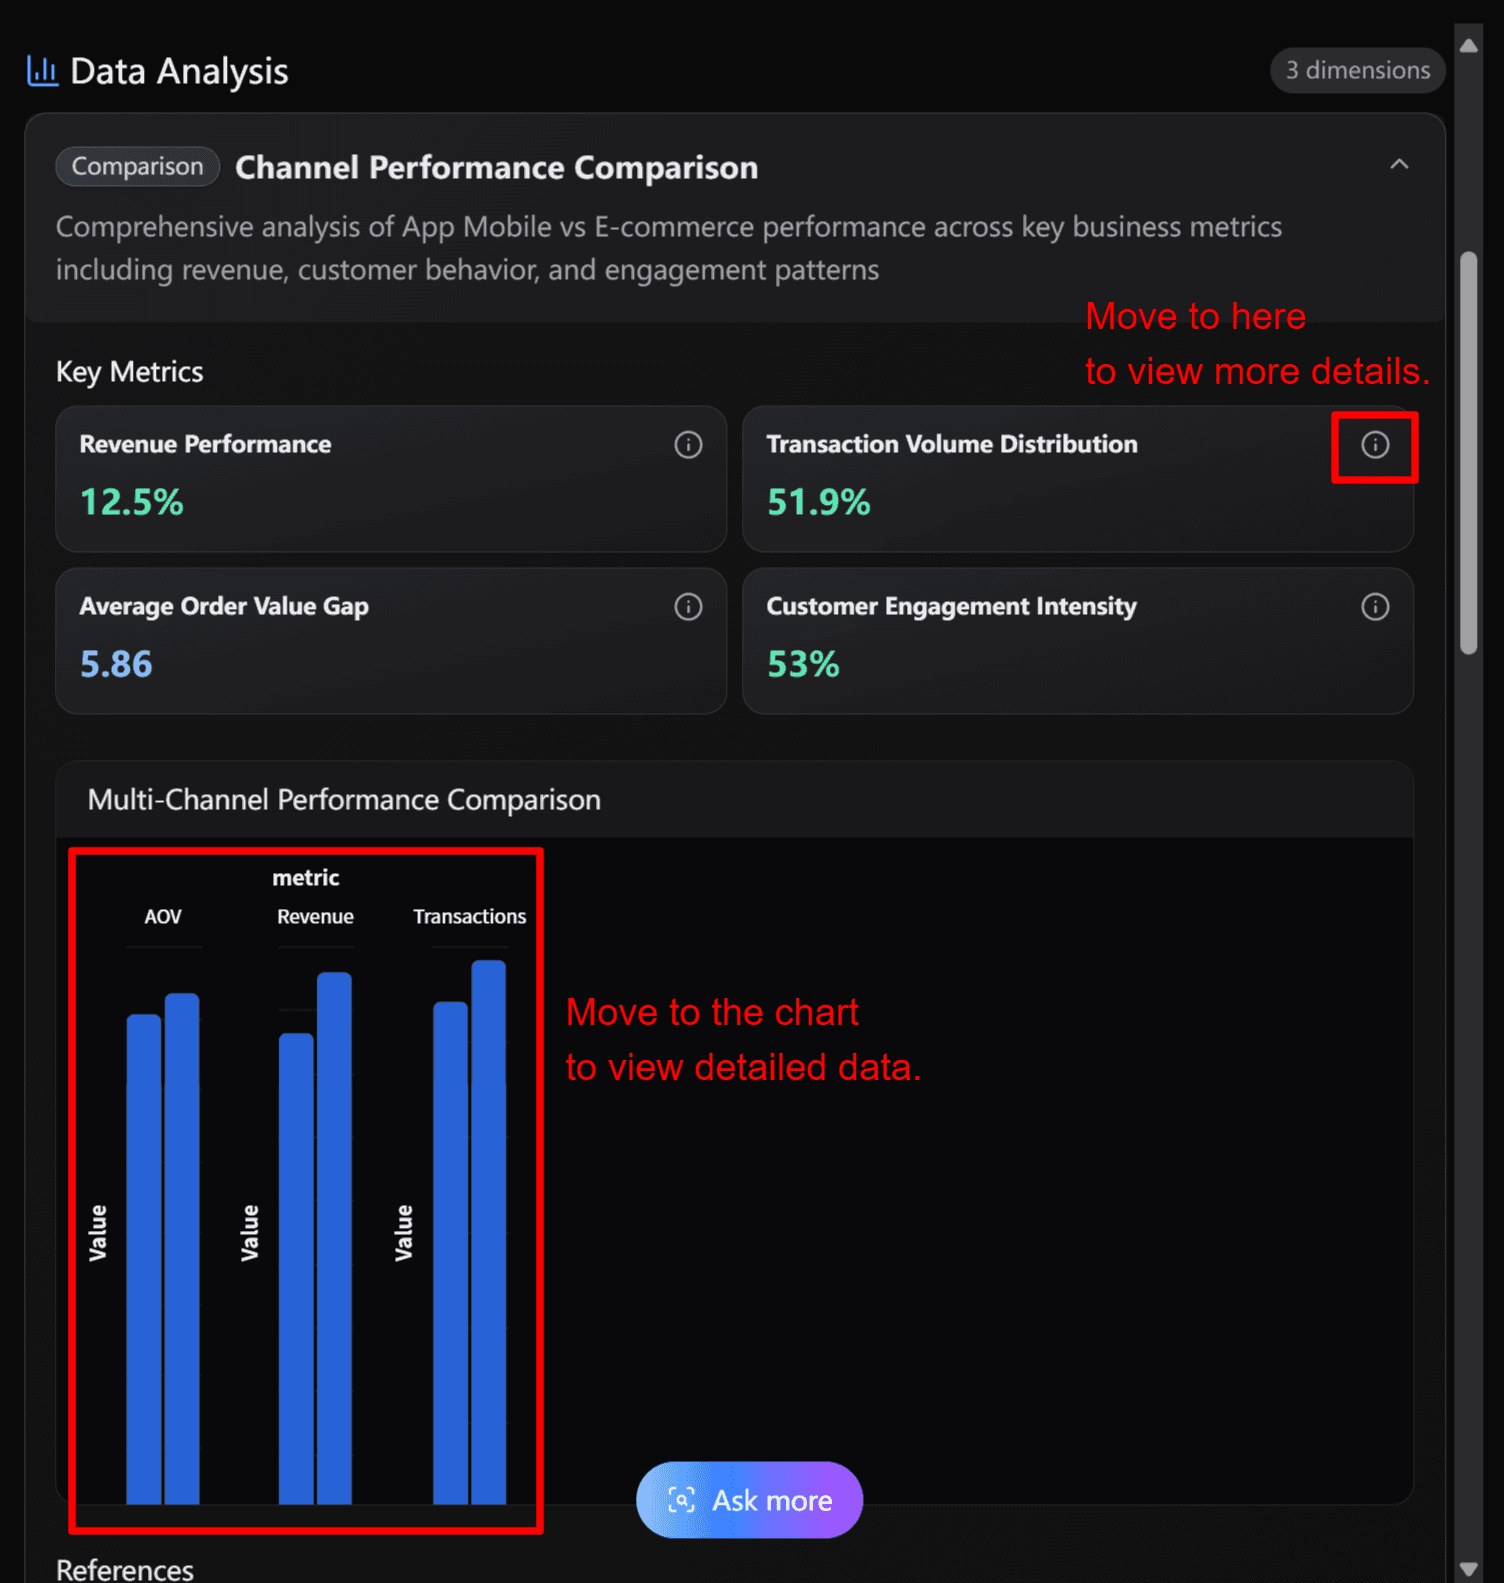
For example:
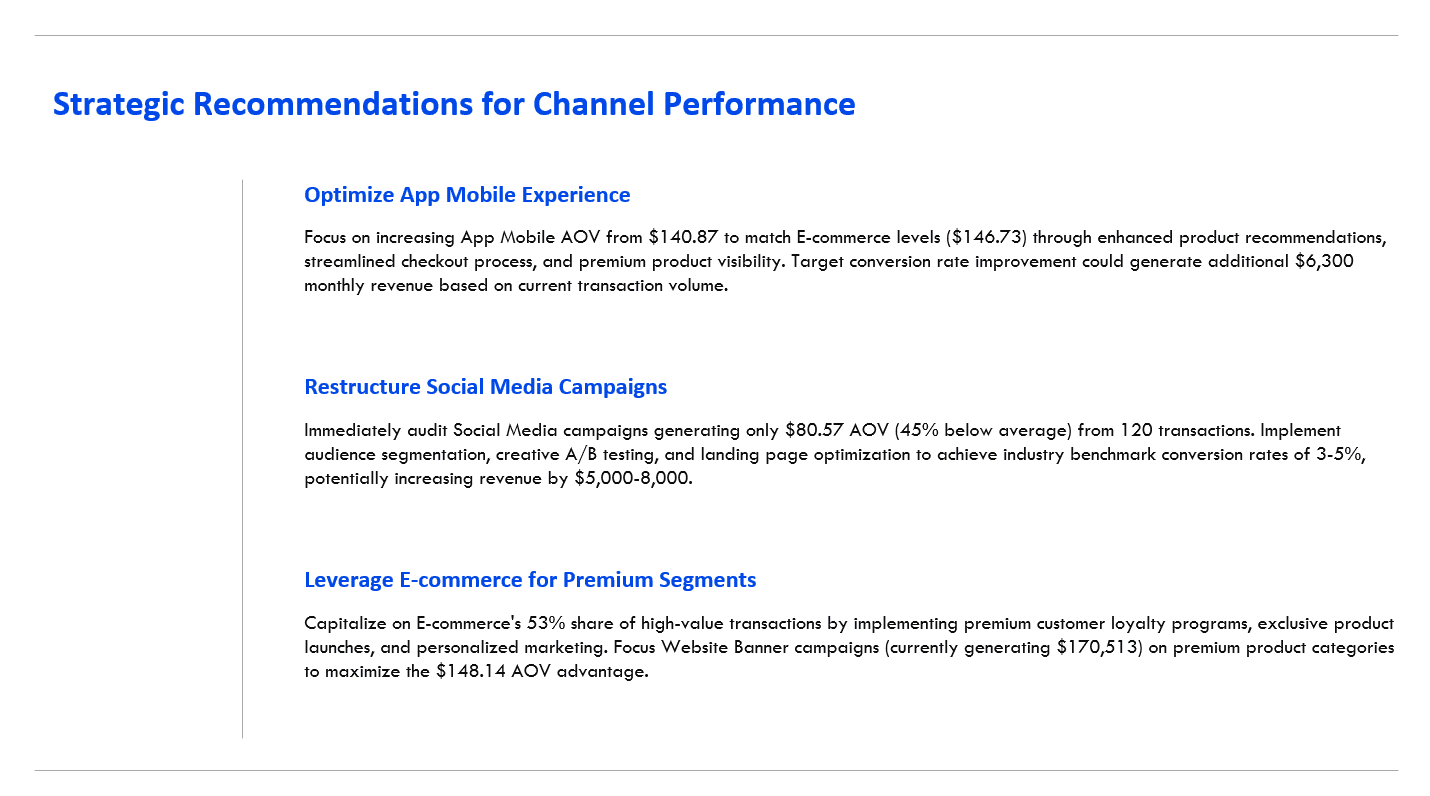
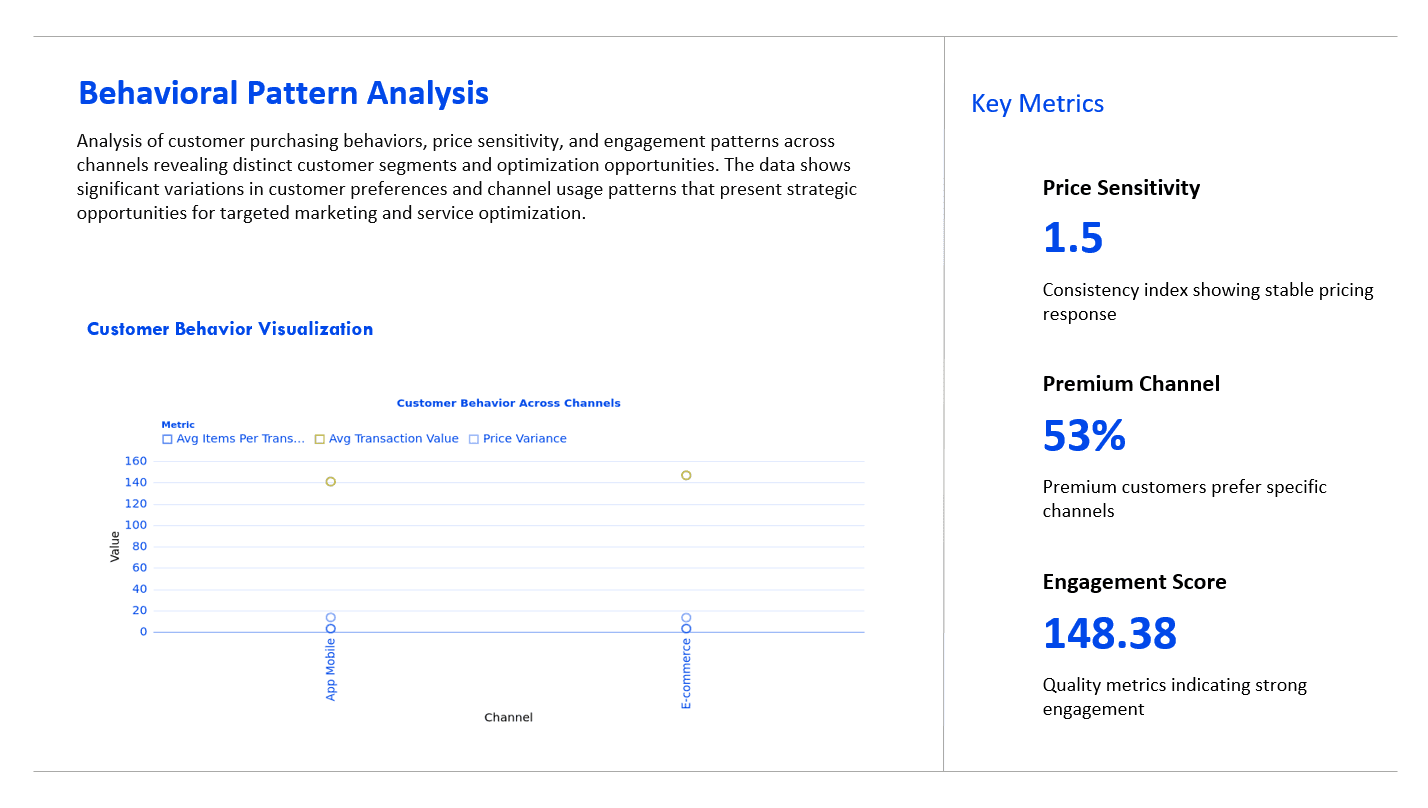
Optimize App Mobile Experience: Focus on increasing App Mobile AOV from $140.87 to match E-commerce levels ($146.73) through enhanced product recommendations, streamlined checkout process, and premium product visibility. Target conversion rate improvement could generate additional $6,300 monthly revenue based on current transaction volume.
Restructure Social Media Campaigns: Immediately audit Social Media campaigns generating only $80.57 AOV (45% below average) from 120 transactions. Implement audience segmentation, creative A/B testing, and landing page optimization to achieve industry benchmark conversion rates of 3-5%, potentially increasing revenue by $5,000-8,000.
Leverage E-commerce for Premium Segments: Capitalize on E-commerce's 53% share of high-value transactions by implementing premium customer loyalty programs, exclusive product launches, and personalized marketing. Focus Website Banner campaigns (currently generating $170,513) on premium product categories to maximize the $148.14 AOV advantage.
Step 5: Dive Deeper
Once you’ve reviewed the initial insights, you can choose to explore further.
Got your own questions or hypotheses? Click “Ask More” to type in your query.
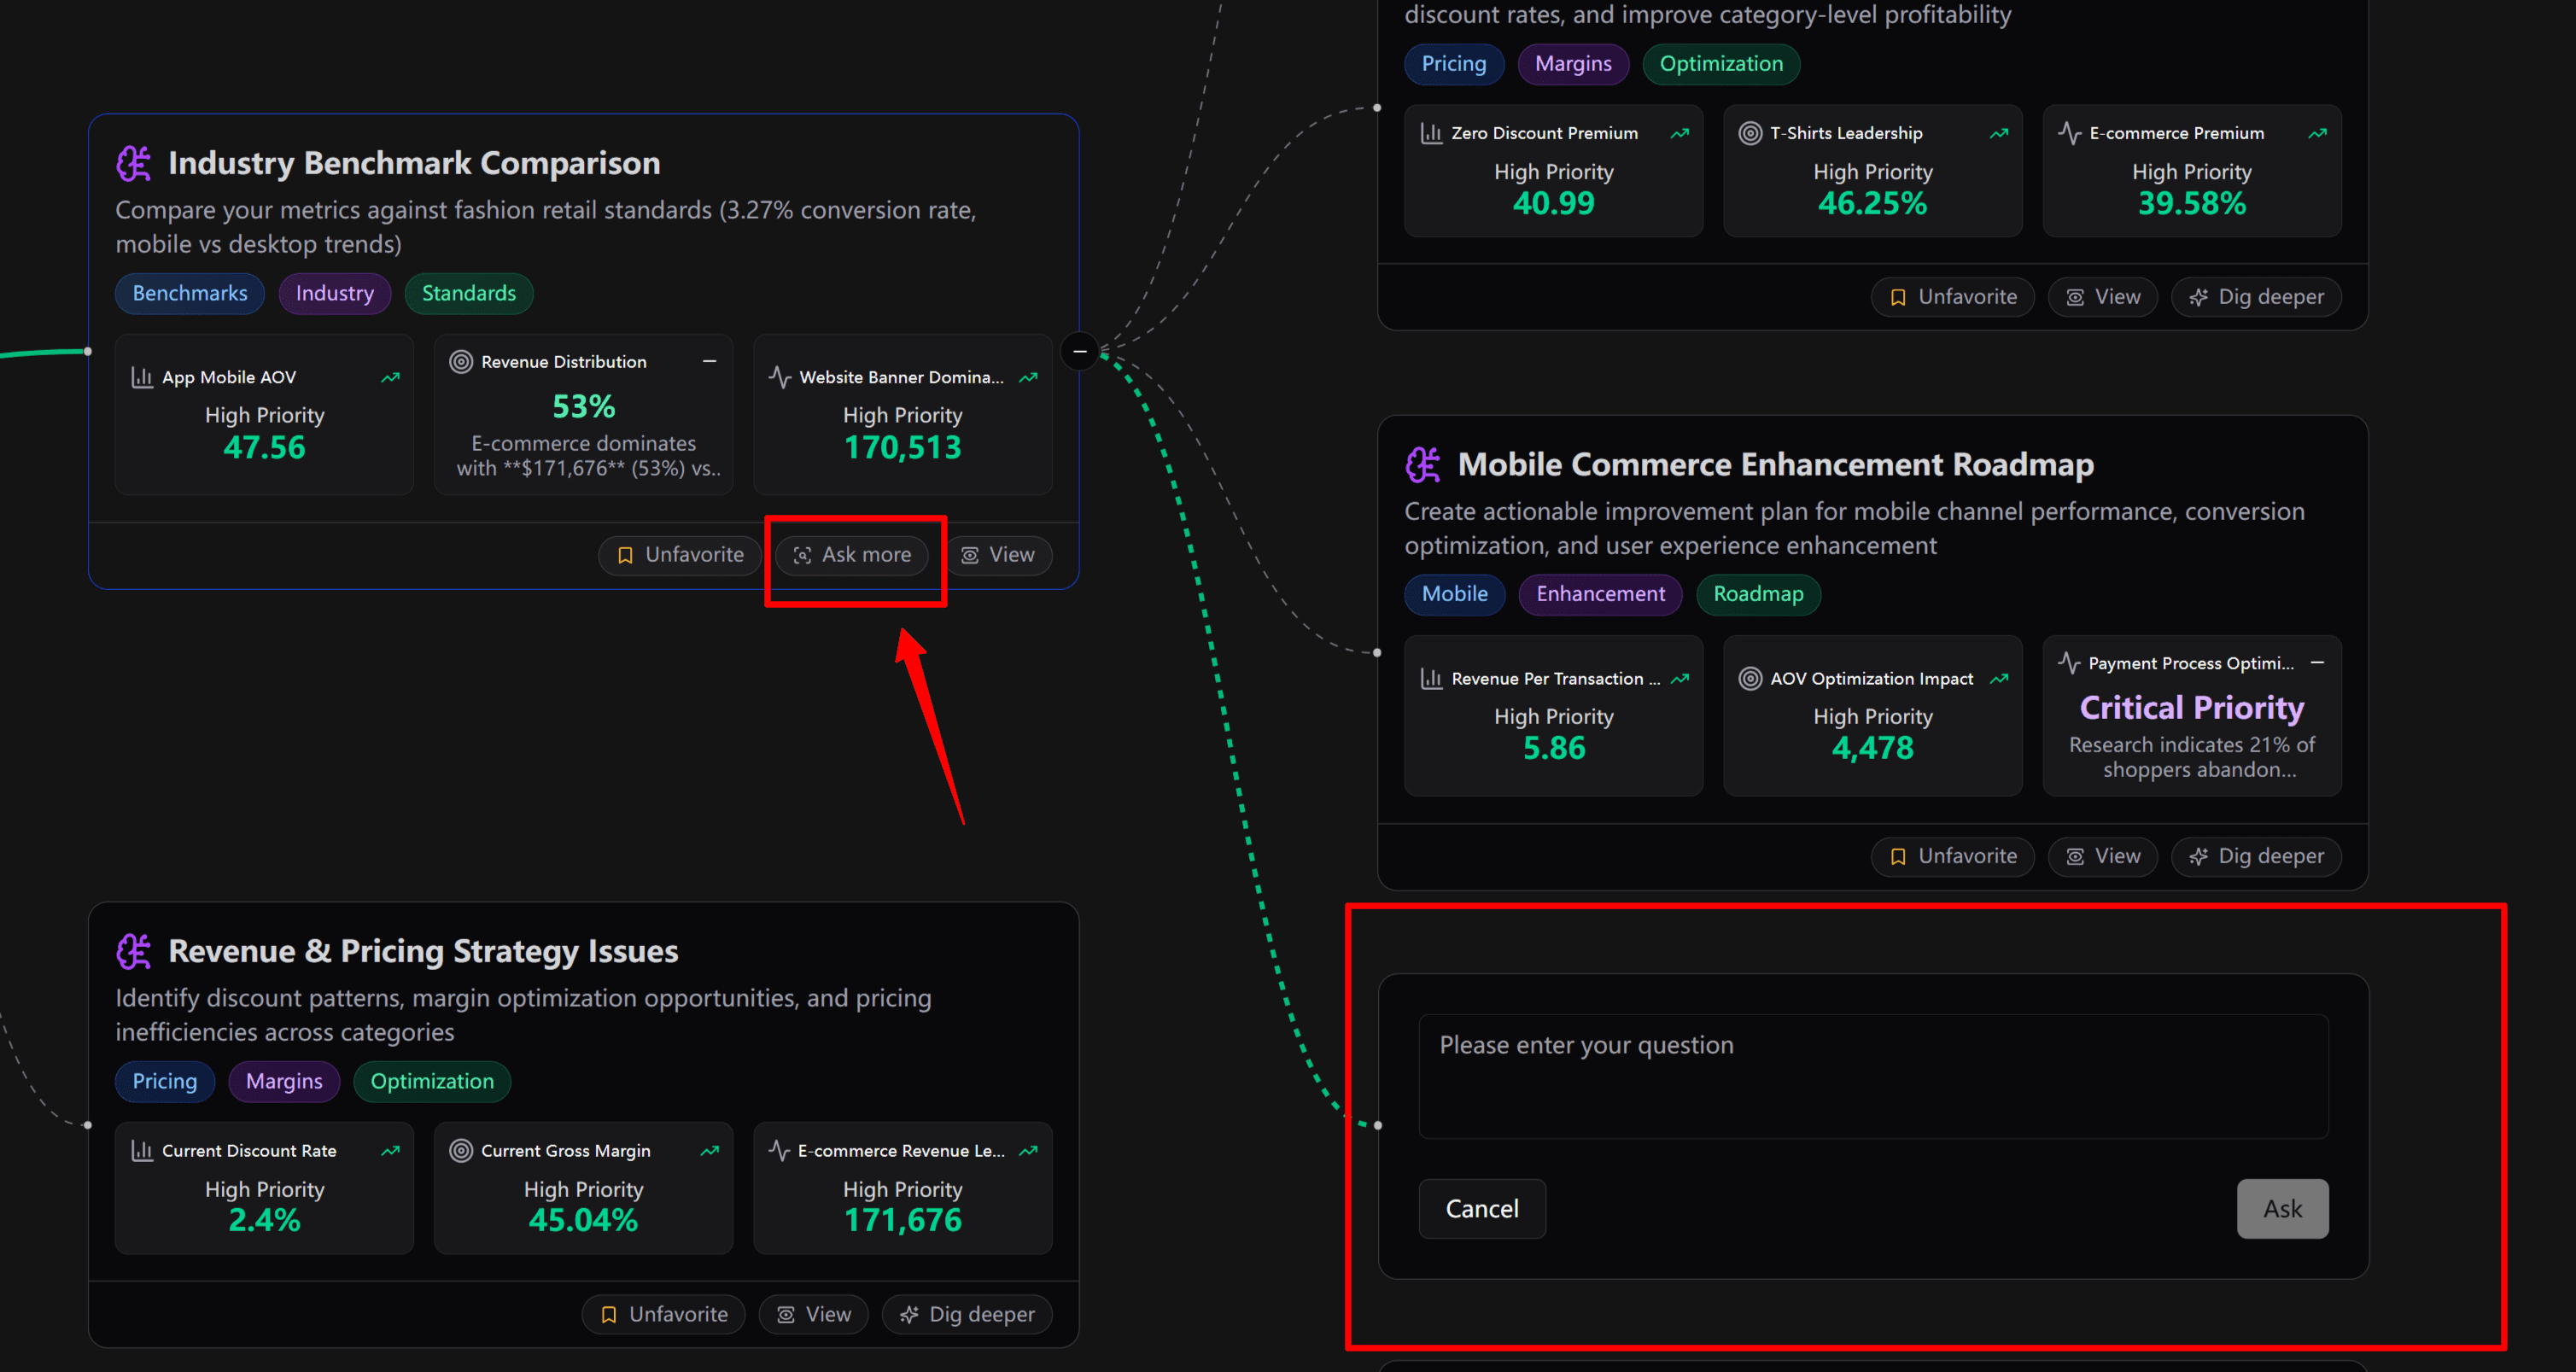
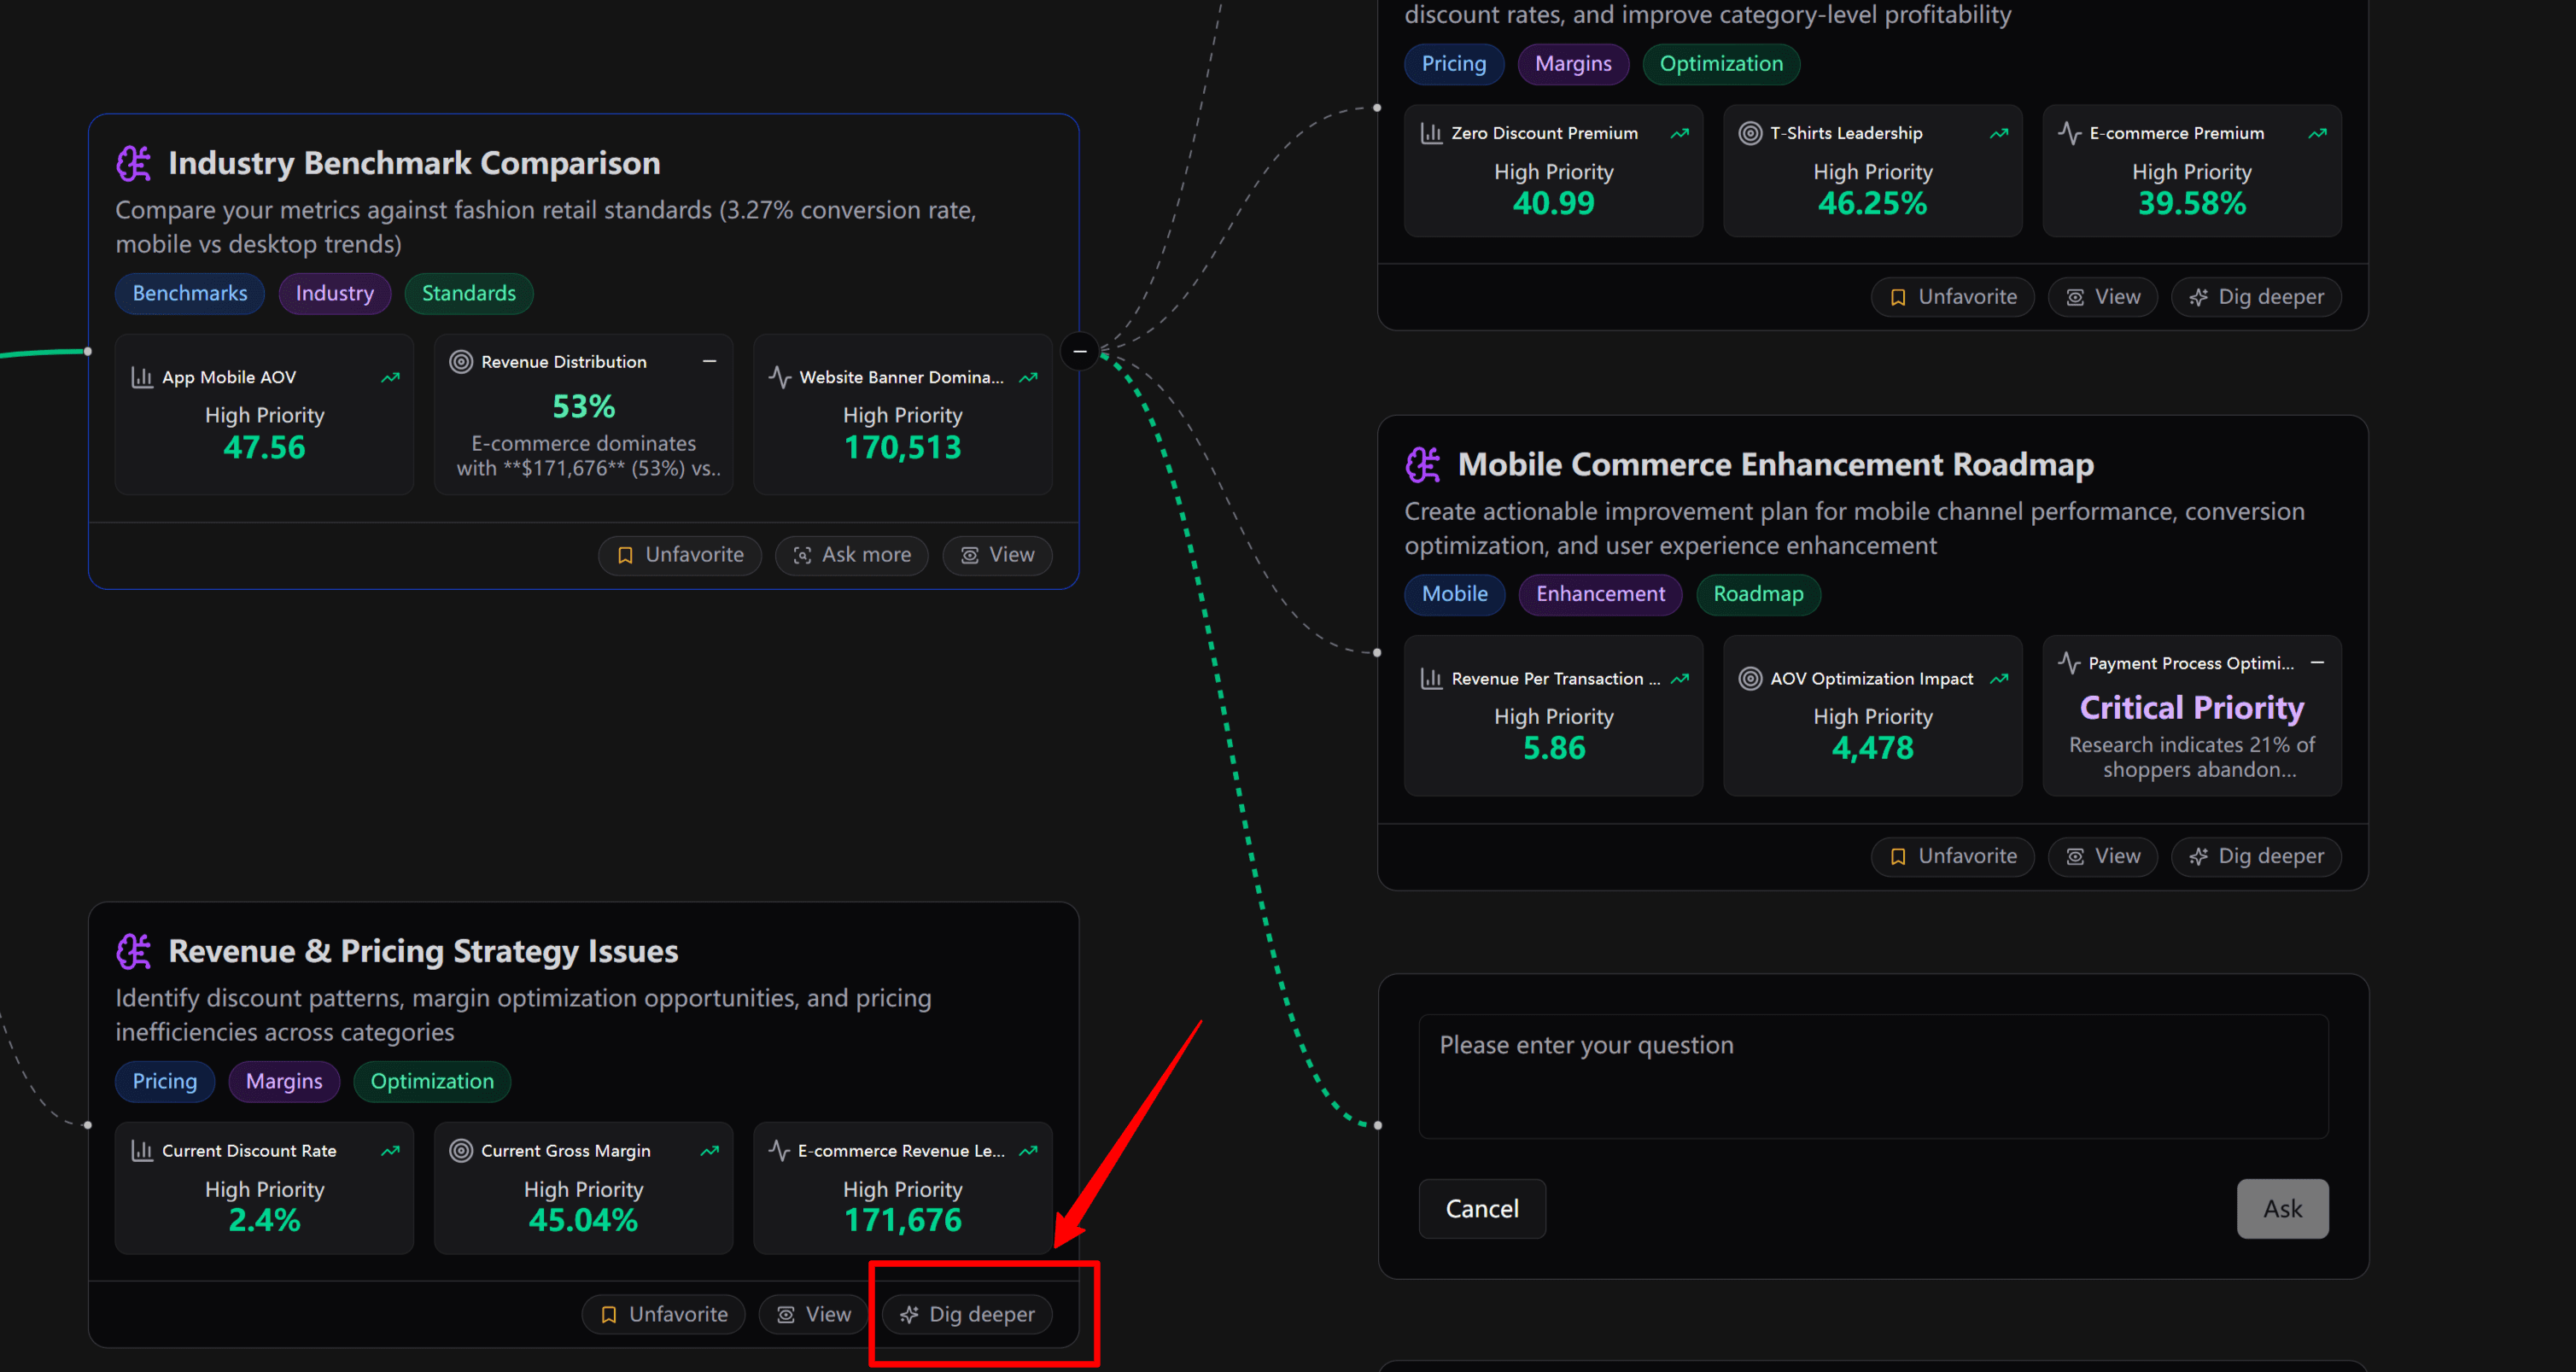
Found a direction you like? Click “Dig deeper” to continue diving deeper into that specific path. Bloom dynamically generates new insights based on your input, helping you move from curiosity to clarity.
Step 6: Generate Slides from Your Data Insights
When you're ready to wrap up your exploration and save your findings, you can generate a presentation in just one click.
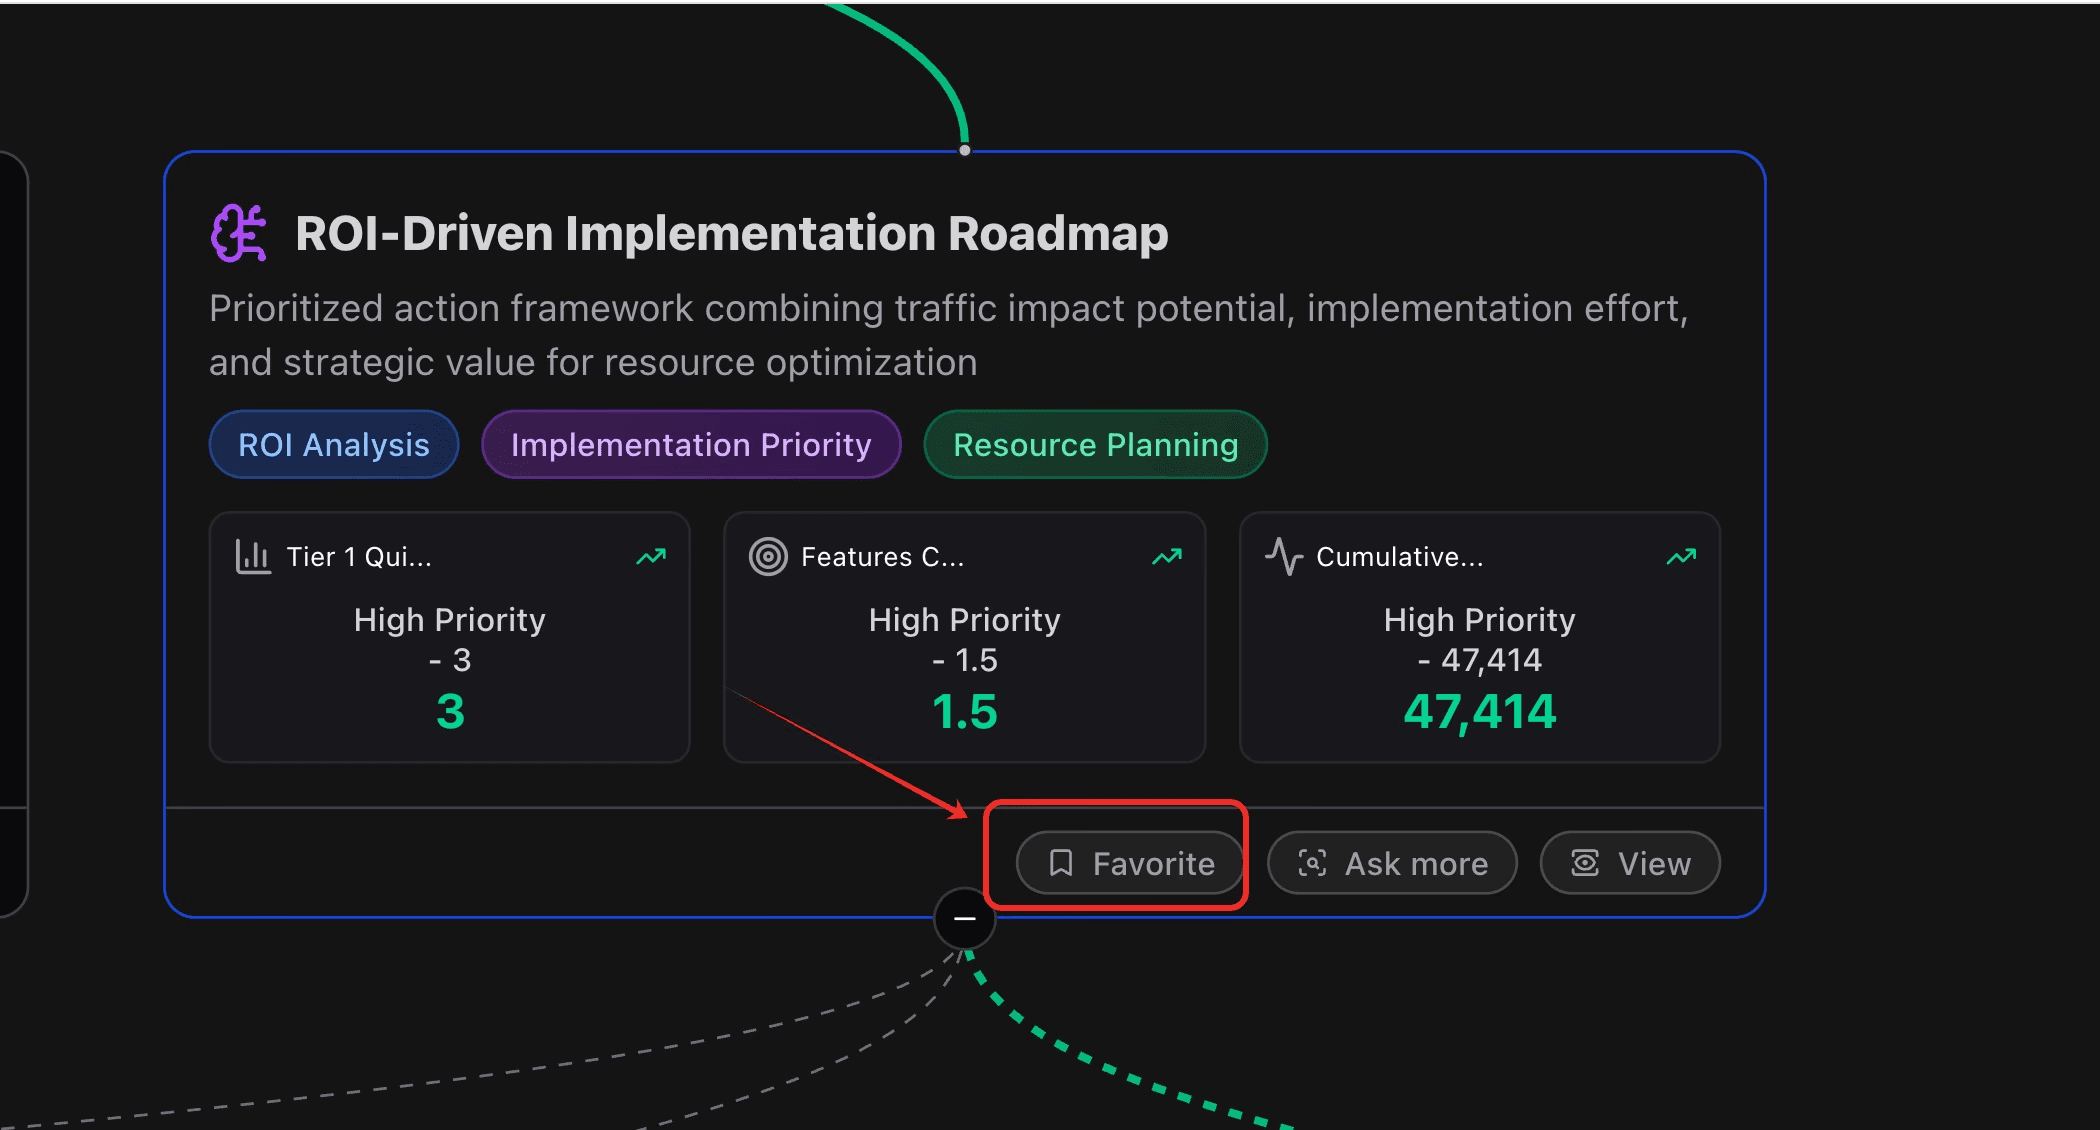
Add to Favorites: Start by clicking the “Favorite” button on any insight you want to include.
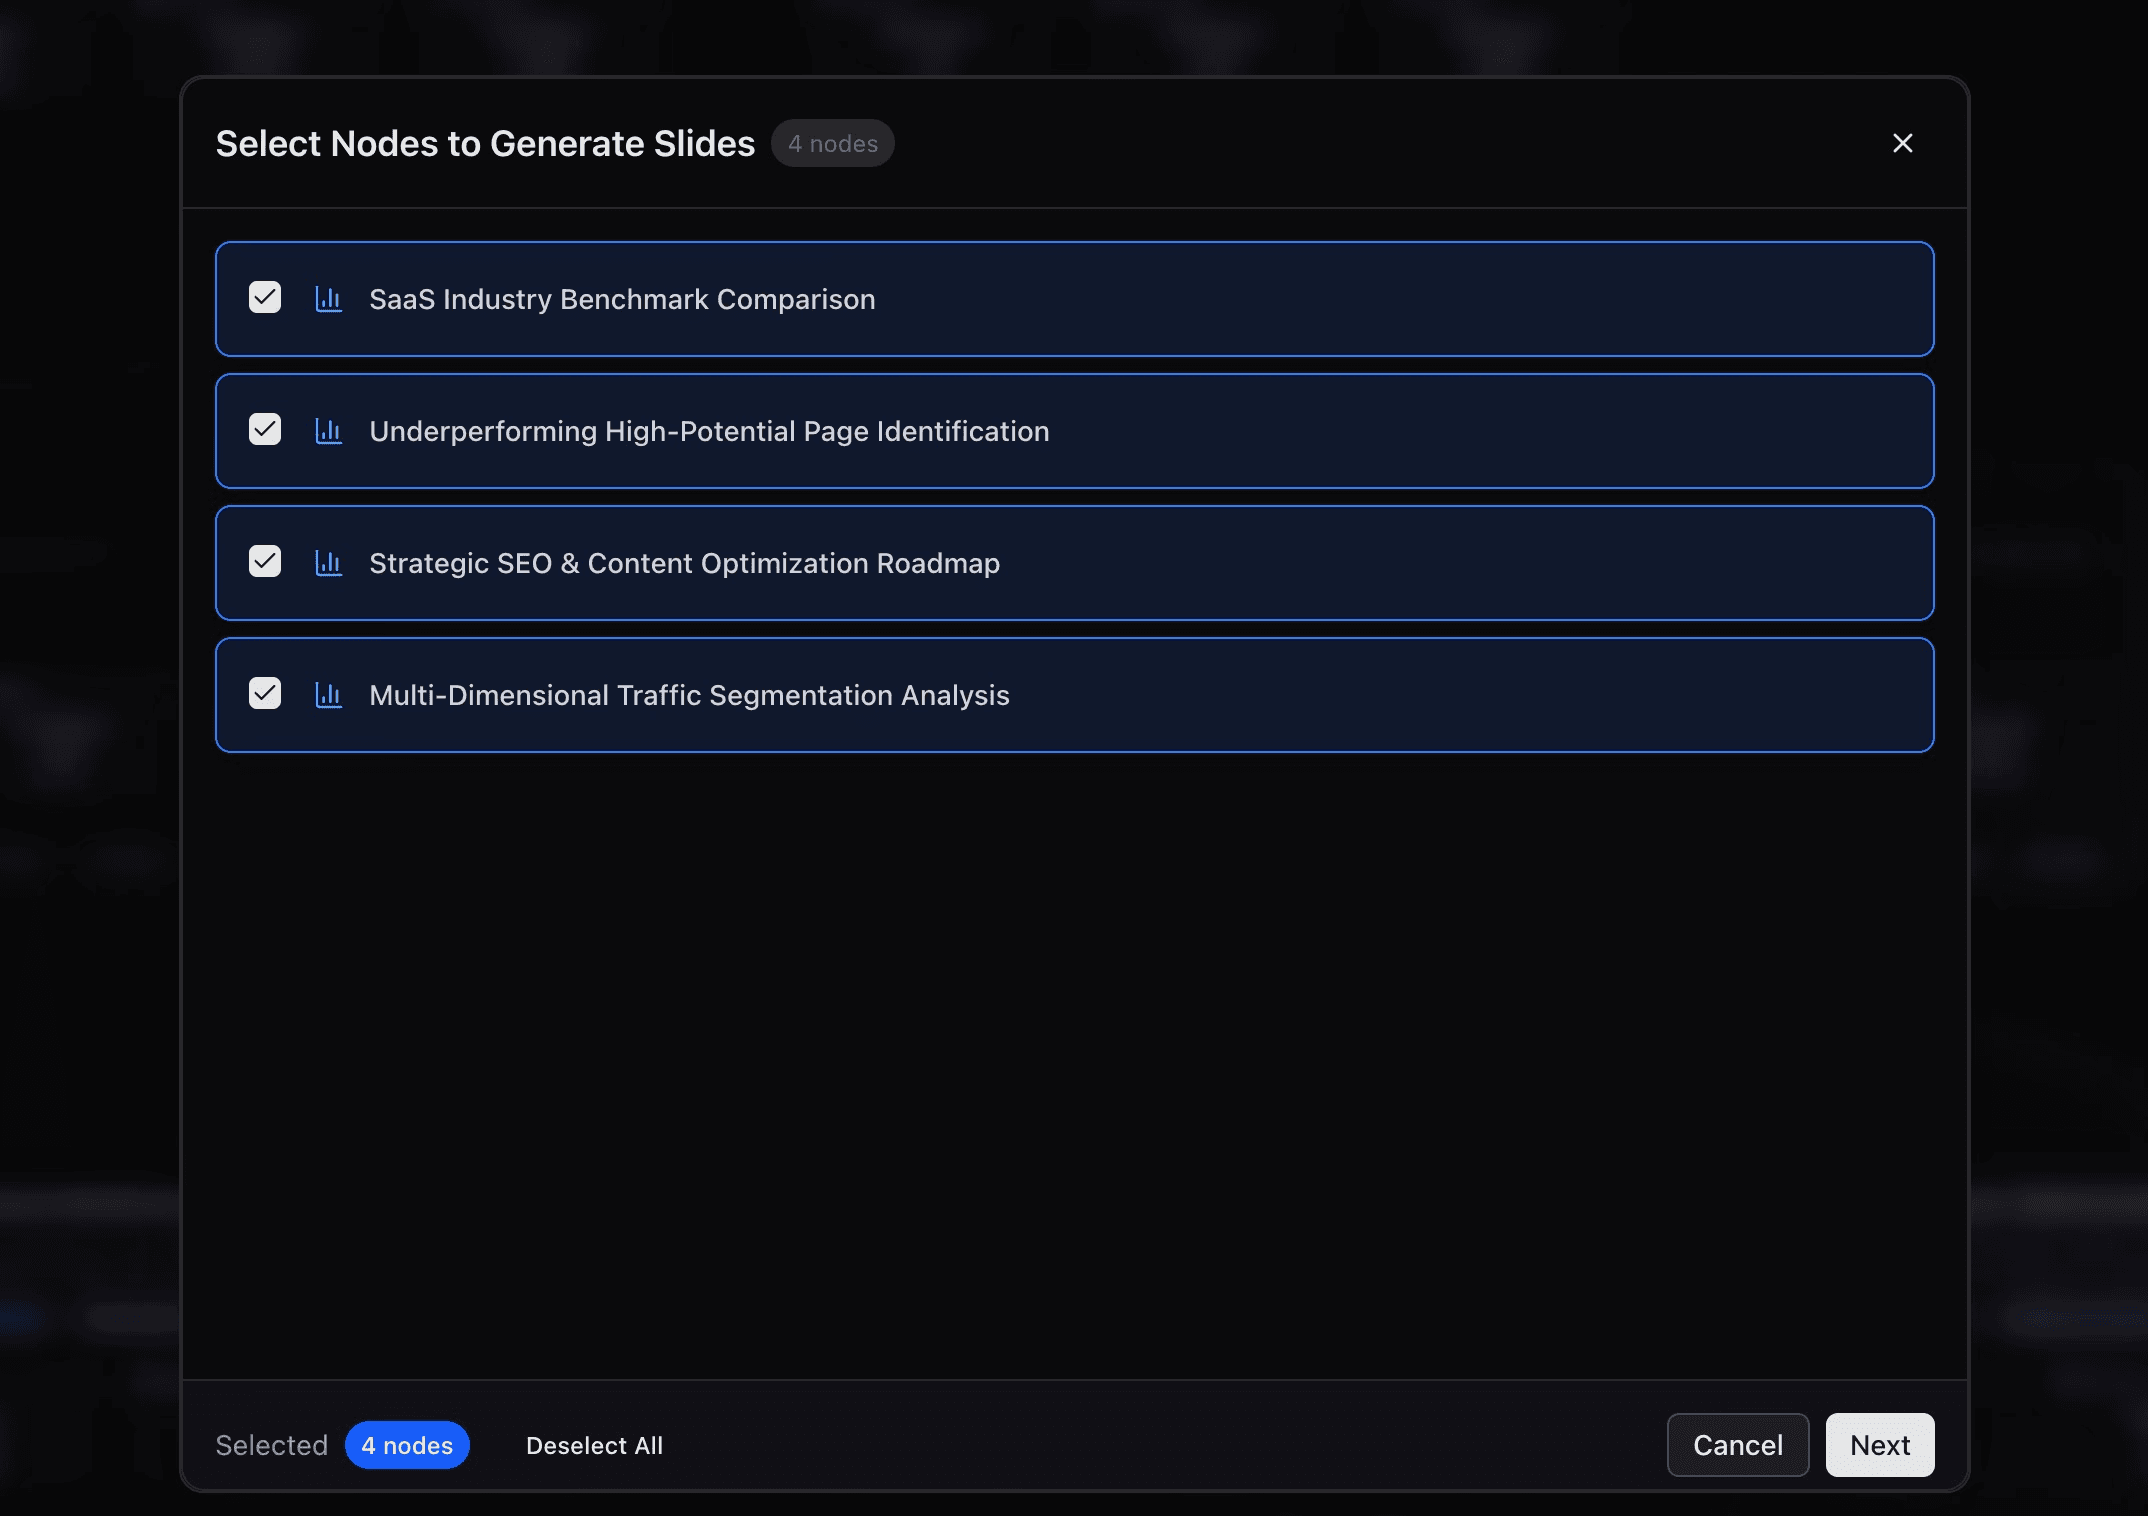
Go to the Favorites list at the bottom, then click the “Generate Slides” button in the top right corner. Select the nodes you want to export and hit Next.
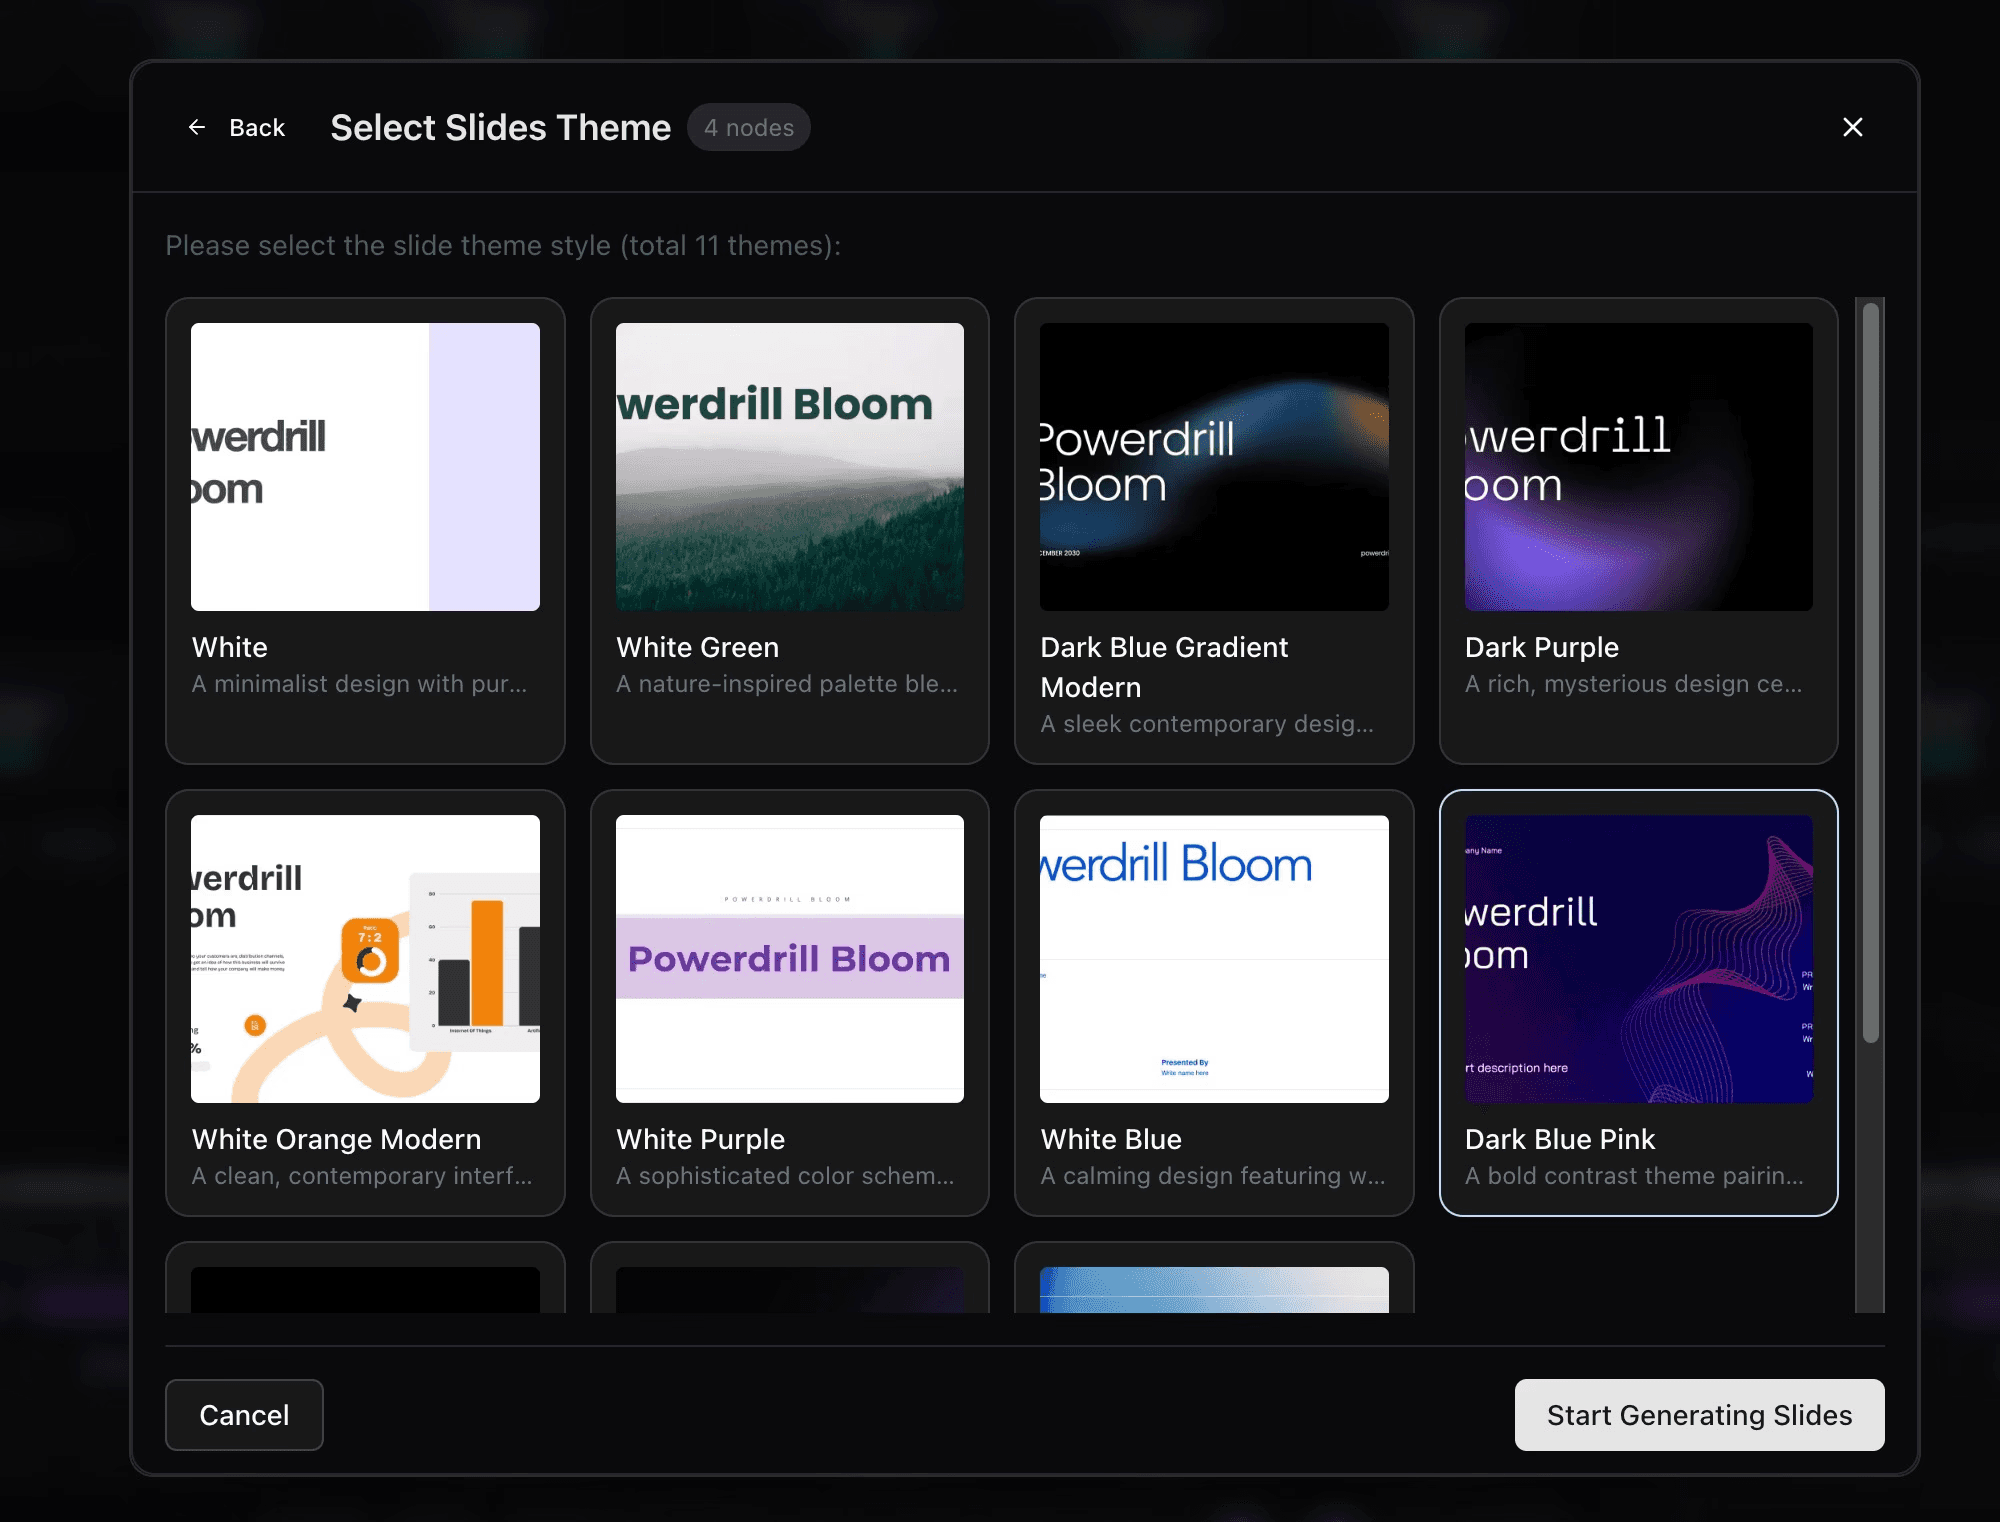
Choose your preferred slide style and wait about a minute. Once your slides are ready, the download will begin automatically.
Congratulations—you've just completed your analysis and created a full data report in slide format!
Here’s an example of what the generated slides look like:
Conclusion
As the fashion landscape across Europe becomes increasingly dynamic and competitive, the ability to interpret and act on data is no longer optional—it’s a defining advantage. Leveraging advanced analytics tools like Powerdrill Bloom allows brands to go beyond reactive strategies and adopt a proactive, trend-driven approach. From understanding nuanced consumer behavior to optimizing pricing and stock levels, data-driven insights are unlocking a new era of precision and creativity in fashion decision-making.
In a world where speed and relevance dictate success, those who can see the future through data will lead it.


