
Why Vehicle Price Data Analysis Matters
The automotive market is evolving at unprecedented speed. With shifts in electric vehicle (EV) adoption, fuel price volatility, and changing consumer behaviors, understanding how car prices fluctuate—and why—is now critical for:
Fleet managers optimizing resale timing
Automotive OEMs adjusting pricing strategies
Dealerships enhancing inventory valuation
Financiers & insurers refining residual value models
Traditional spreadsheet-based methods are too slow, too shallow, and not scalable. This is where AI-powered data analytics platforms come into play—especially those built for autonomous, canvas-based exploration.
What can Bloom AI do for you?
Powerdrill Bloom AI is a next-generation AI data analytics SaaS platform designed for non-technical teams and data-driven decision makers.
Unlike rigid BI tools or isolated notebooks, Bloom AI offers a canvas-based analytics workspace, where AI agents automatically explore, visualize, and explain your data.
Key Features:
No-Code Interface: Drag, drop, and explore your dataset without SQL or Python.
Autonomous Insight Generation: Let AI agents uncover hidden trends and anomalies for you.
Collaborative Canvas: All analyses live in a visual, shareable space—perfect for teams.
Modular AI Agents: Four intelligent agents work as a data analysis team.
Meet Your AI Data Analysis Team
Powerdrill Bloom AI simulates a full-stack analytics team with its 4 modular agents:
Agent Name | Role | Core Function |
Derek - Data Detective | Pattern hunter | Detects correlations, outliers, and clusters |
Eric - Data Engineer | Data preparation expert | Cleans, joins, and transforms datasets |
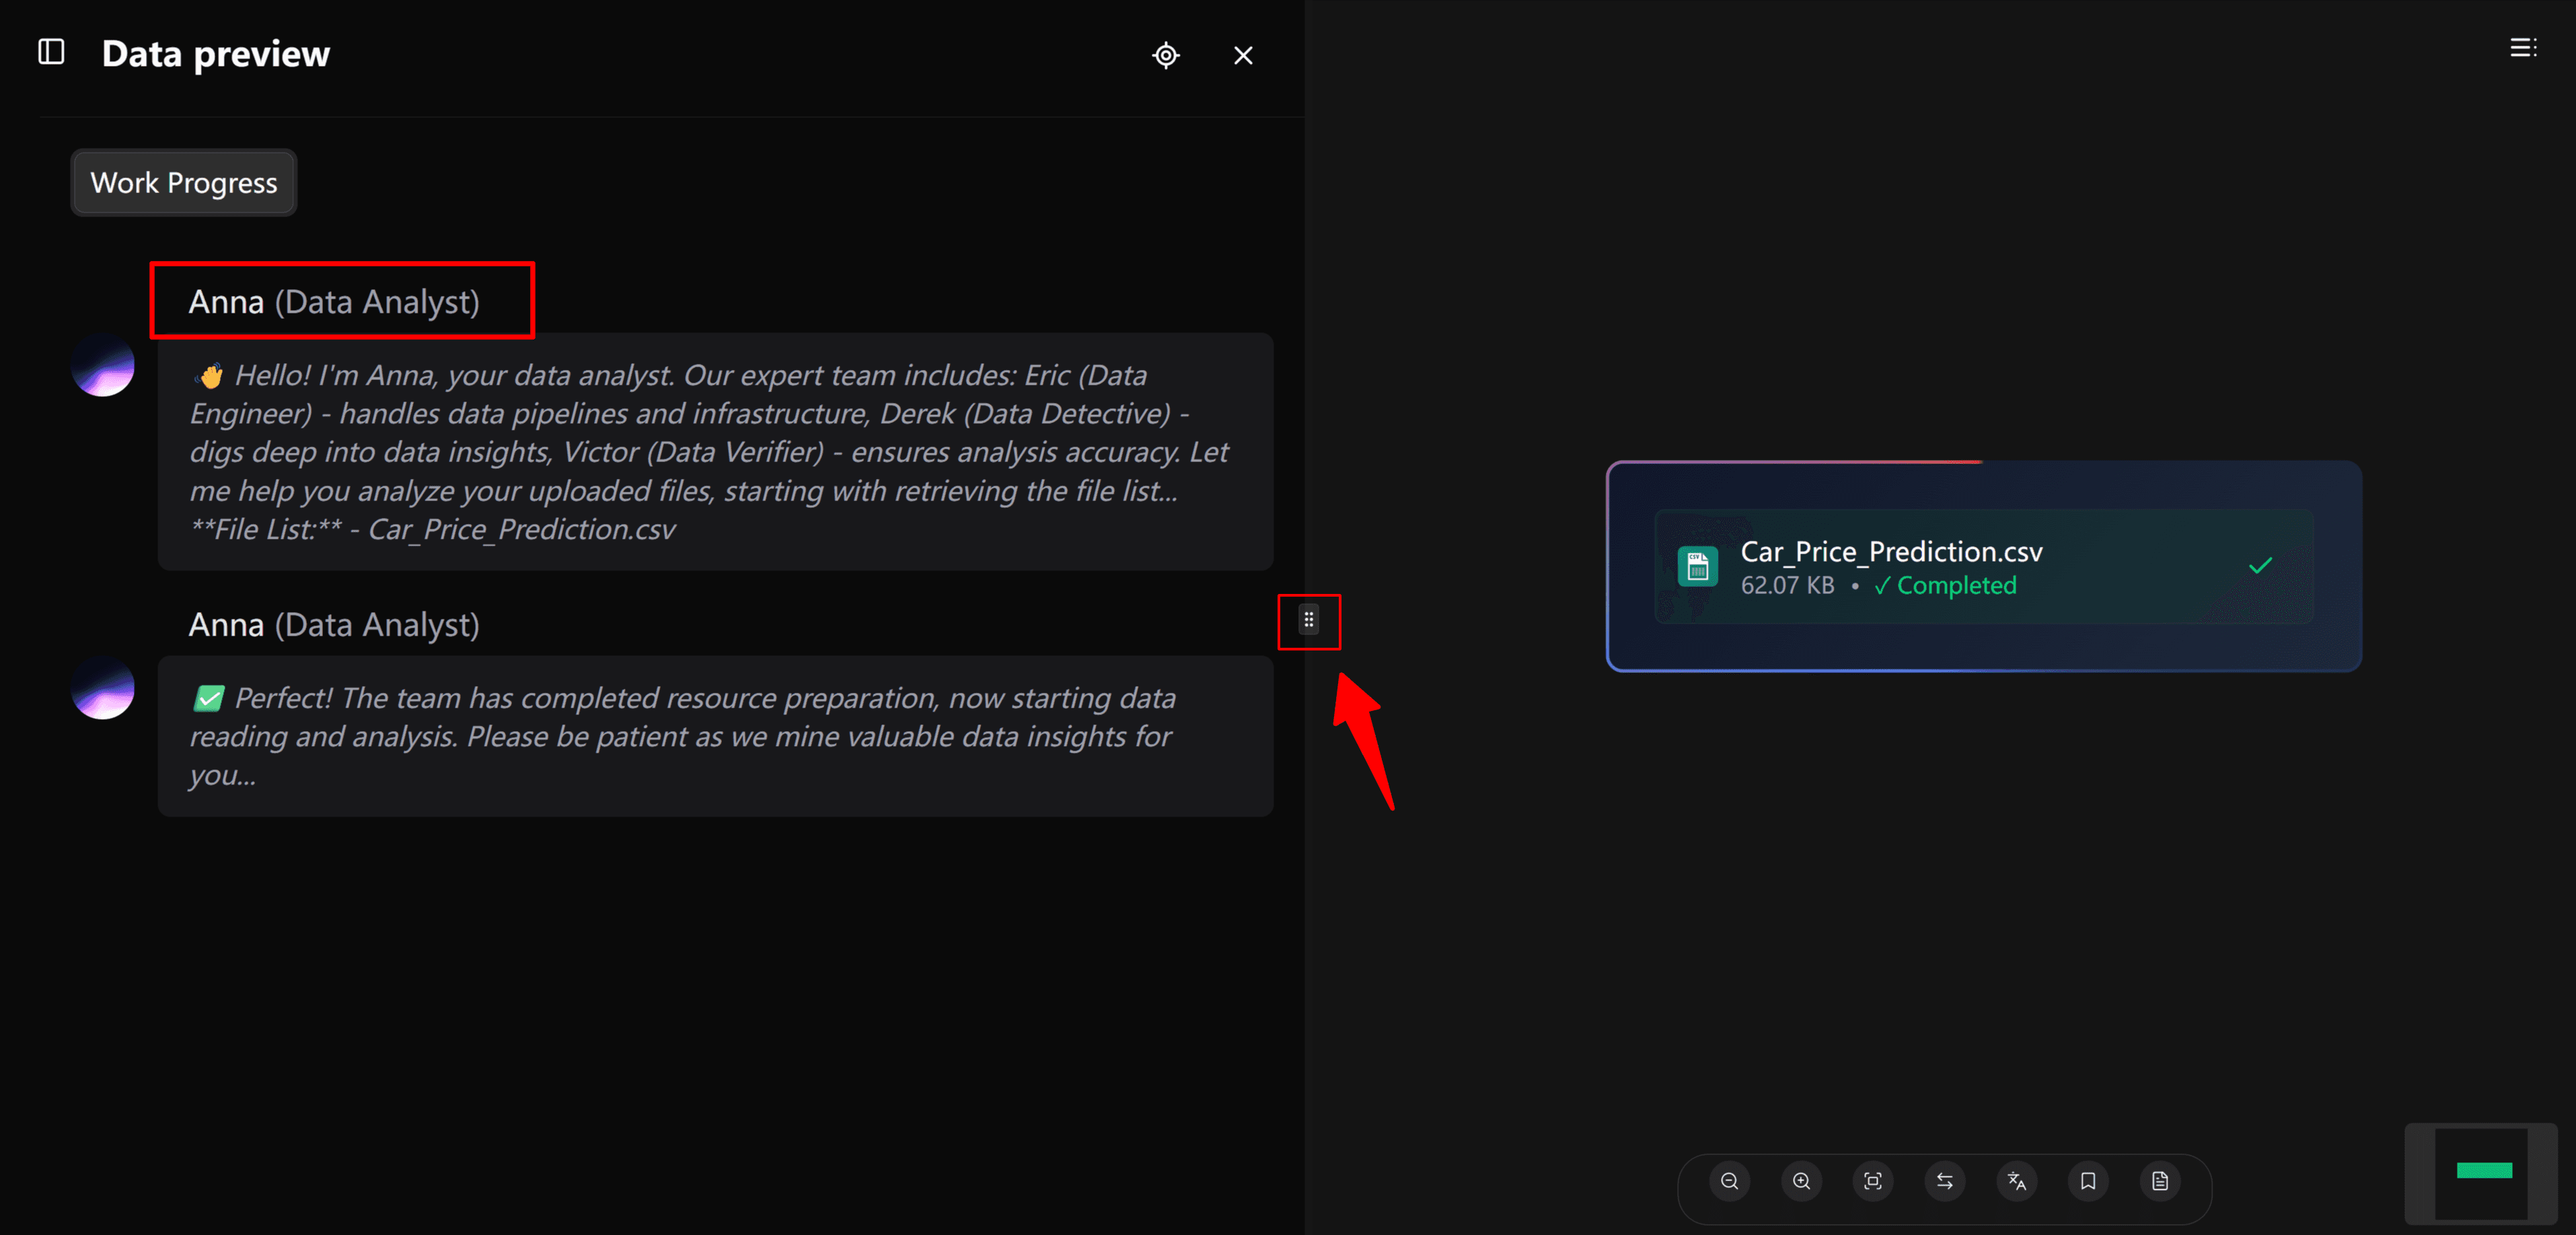
Anna - Data Analyst | Insight synthesizer | Builds summaries, trend analysis, and visuals |
Victor - Data Verifier | Quality assurance & validation | Confirms statistical significance and logic |
Each AI agent plays its role autonomously, while working together seamlessly inside the canvas-based workspace.
How to Use Powerdrill Bloom AI to Analyze Car Price Data
Let’s walk through a real-world example: analyzing a car price prediction dataset to extract actionable insights. Here’s how Bloom AI can make this fast, intelligent, and accurate.
Step 1: Upload Your Dataset
To start your data analysis journey:
Click the “Start Blooming” button on the homepage.

Upload the dataset(s) you want to analyze. Bloom AI supports:
File types:
.CSV,.XLS,.XLSXMultiple files simultaneously (for combined analysis)
Maximum file size per file: 20MB

Bloom AI will automatically detect and process column types, missing values, and formats.
Step 2: Begin Automatic Data Analysis
Once uploaded, Bloom AI’s autonomous analysis engine initiates immediately. It’s powered by four intelligent agents:
Eric - Data Engineer: Cleans and structures your data
Derek - Data Detective: Searches for patterns, correlations, and clusters
Anna - Data Analyst: Synthesizes visual insights and metrics
Victor - Data Verifier: Confirms statistical accuracy and flags anomalies
You can adjust the canvas scale by dragging the middle button.
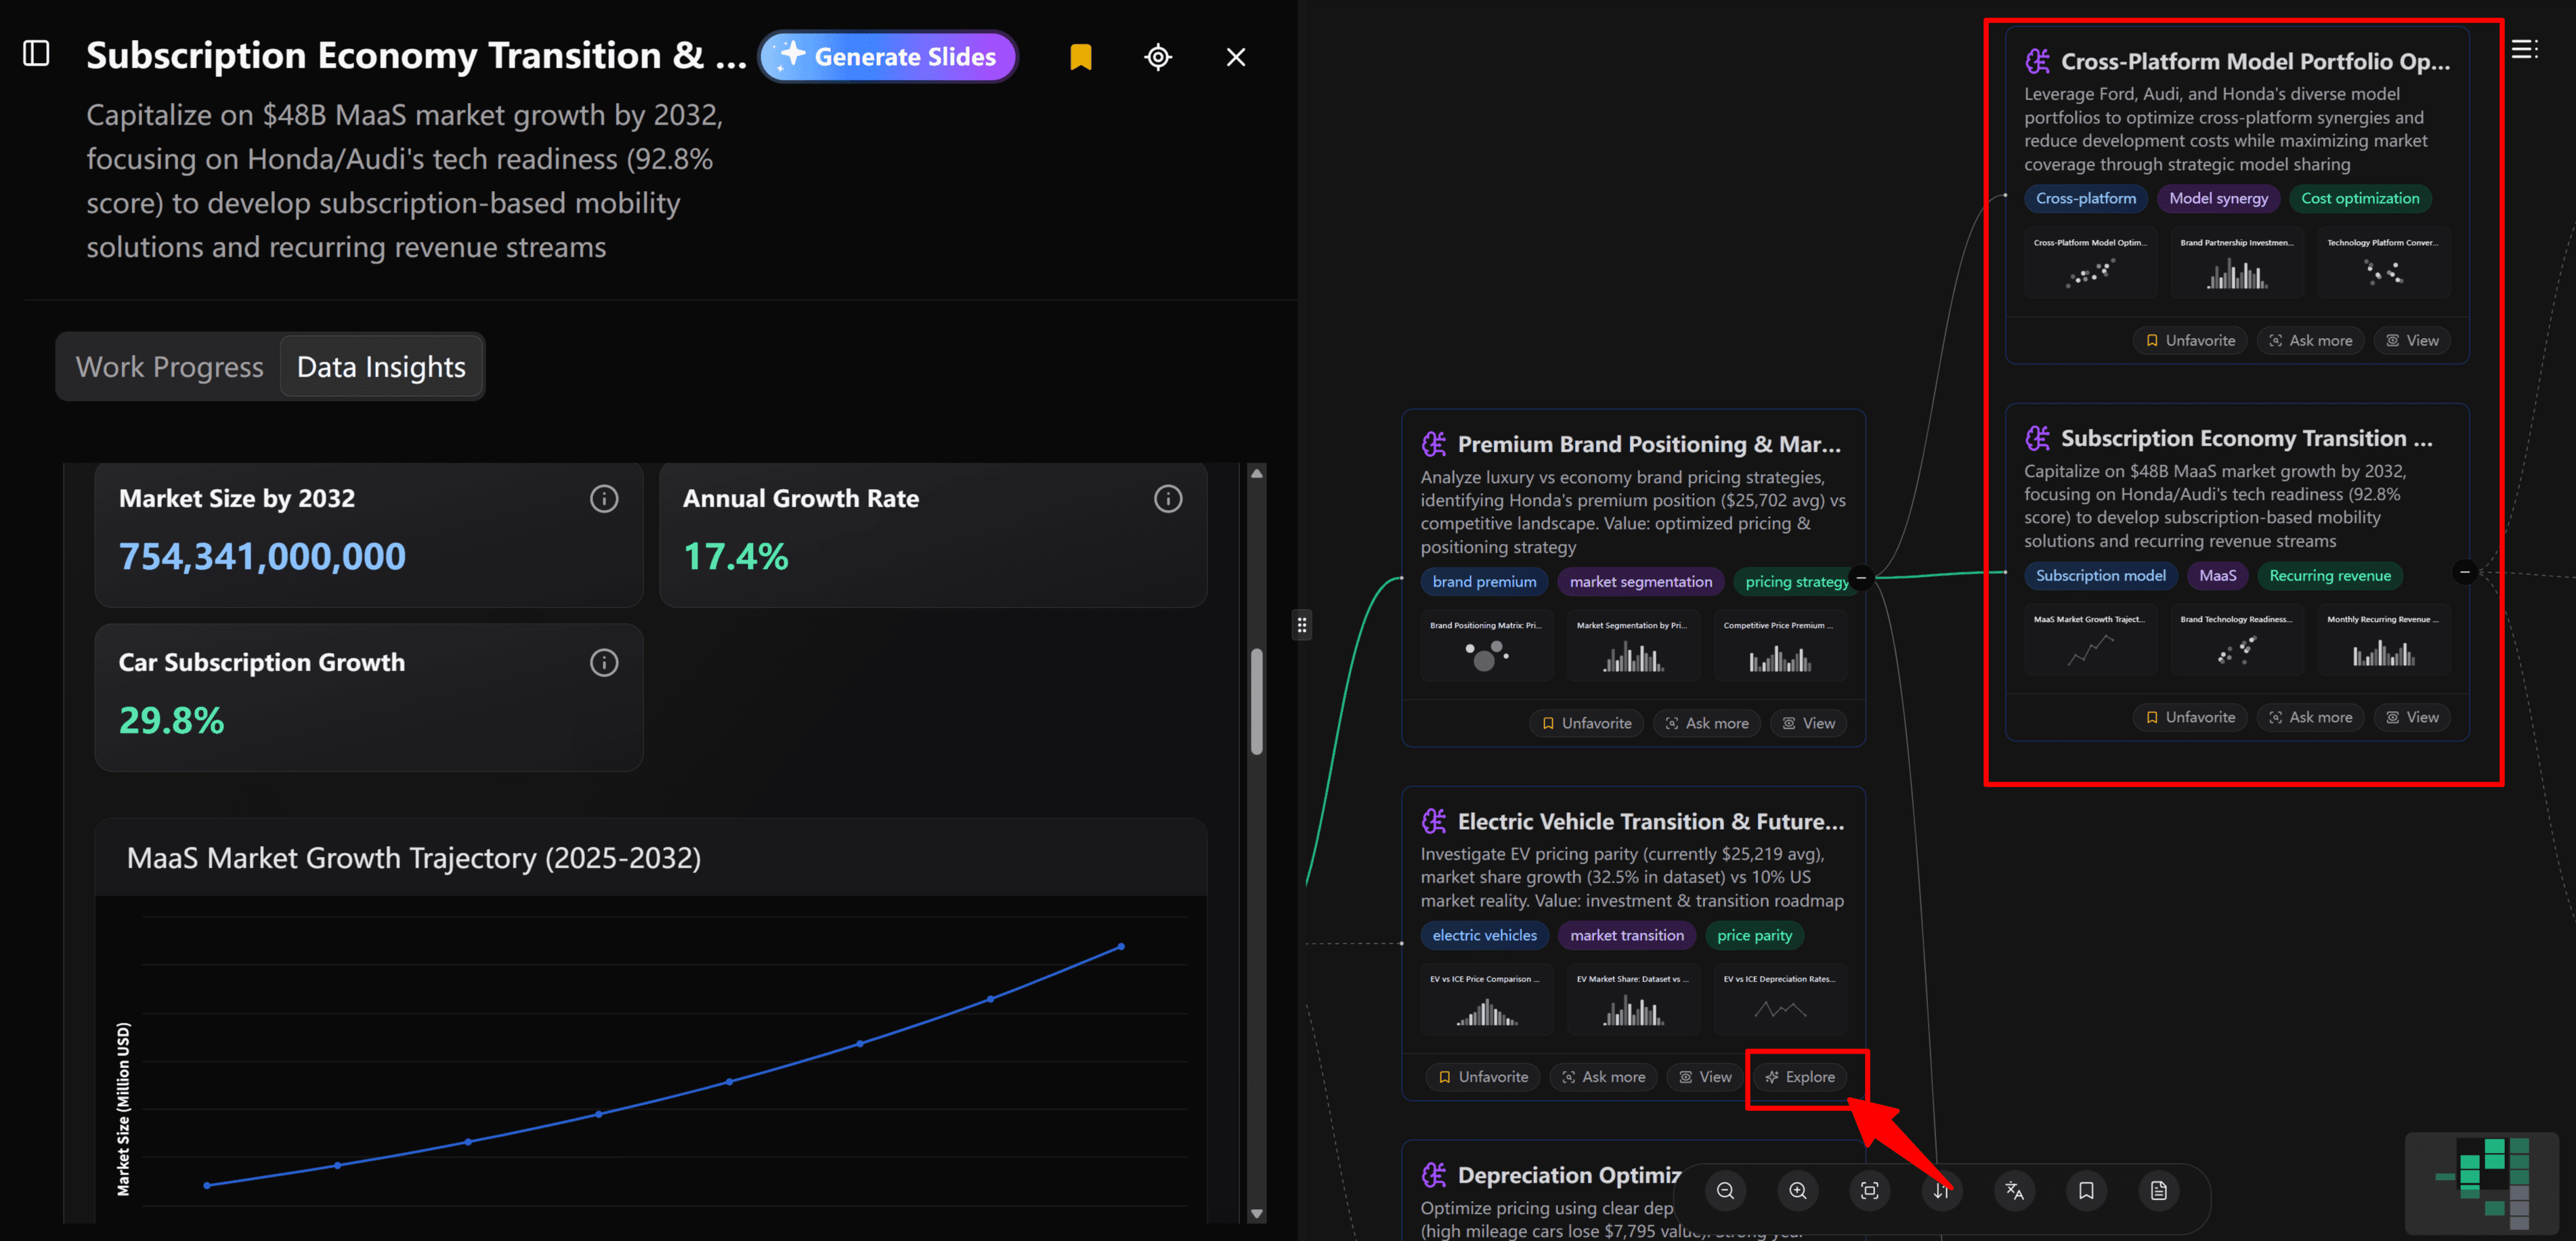
You don’t need to write queries or build dashboards manually. After a short processing time, your canvas will display a live data insight report categorized under three major analytical themes.
Using the car price dataset as an example, the Core Analytical Directions include:
Brand Positioning & Market Segmentation
Understand which brands retain value, dominate high-end pricing, or underperform in premium tiers.Electric Vehicles vs Traditional Fuel
Compare electric, petrol, and diesel vehicles in terms of pricing, depreciation, and adoption.Depreciation and Lifecycle Value Optimization
Uncover ideal resale periods, analyze usage-based value loss, and manage total cost of ownership more effectively.

Each theme includes charts, summaries, and AI-generated observations—ready for decision-making.
Step 3: Explore Deep-Dive Insights
Powerdrill Bloom AI doesn’t stop at surface-level summaries. You can initiate in-depth exploration at any time by:
Clicking the “Explore” button under any insight or theme
Allowing the AI to run targeted analysis on that specific angle
Viewing auto-generated questions, hypotheses, charts, and validations
For example:
Explore "Brand Depreciation Patterns" to compare value retention curves for BMW vs Honda.
Dive into "EV Adoption Trends" to see how market share and price premiums have shifted from 2000 to 2025.
Investigate "Mileage-Based Depreciation" to discover how usage affects resale value over time.
Exploration is fully automated—your agents will adjust statistical models, run relevant groupings, and visualize new patterns based on your click.
What You Can Discover from Car Pricing Data
Using a real dataset on car prices, Bloom AI delivered a comprehensive analysis without any manual scripting. Highlights include:
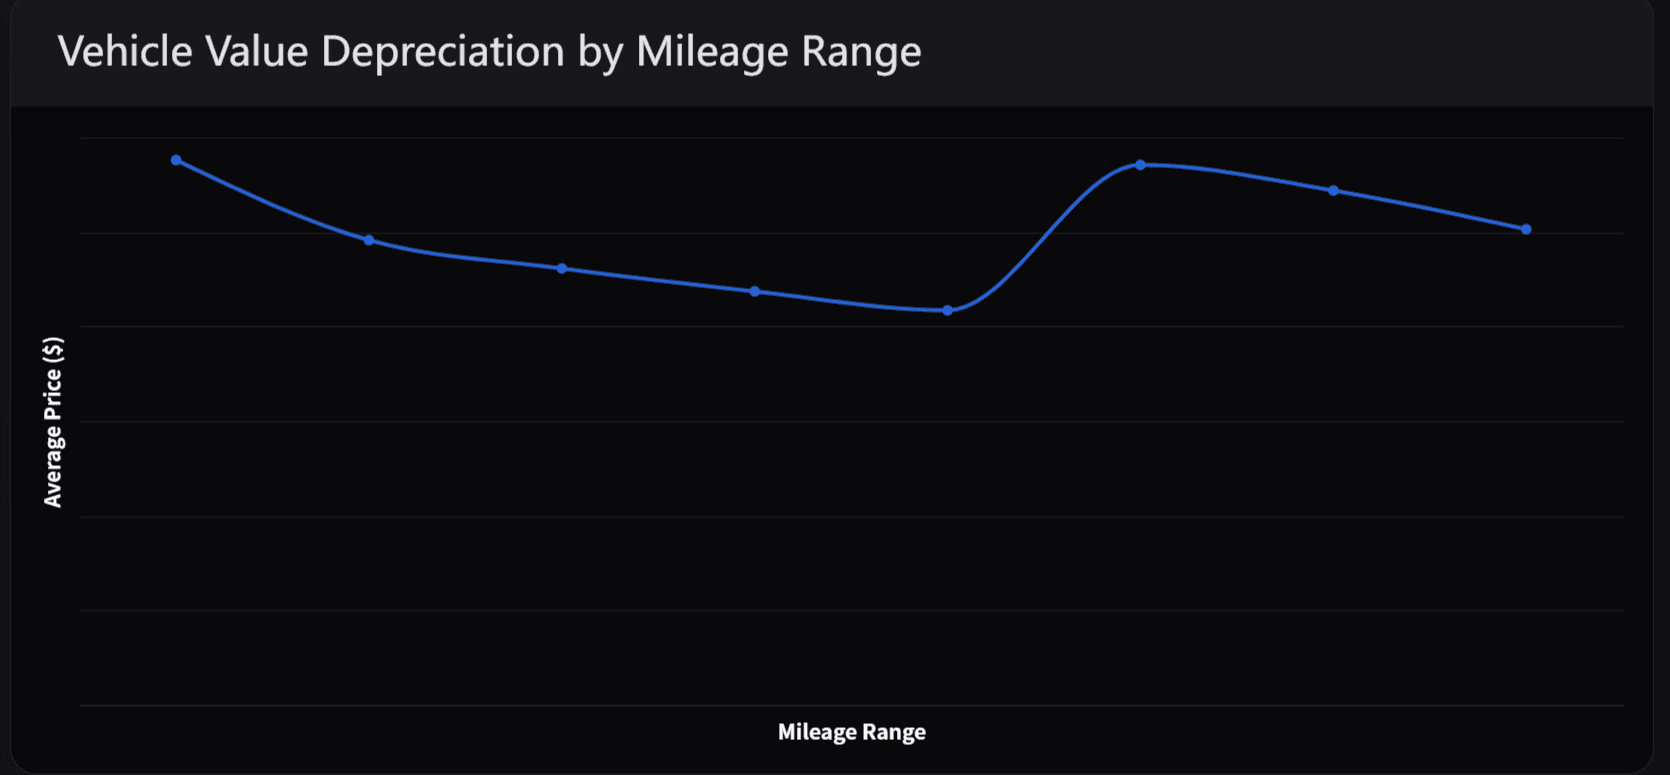
Depreciation Insight: Vehicle value drops sharply after 15 years, with annual depreciation rates increasing to 13%. Best resale timing is around 9 years of age.
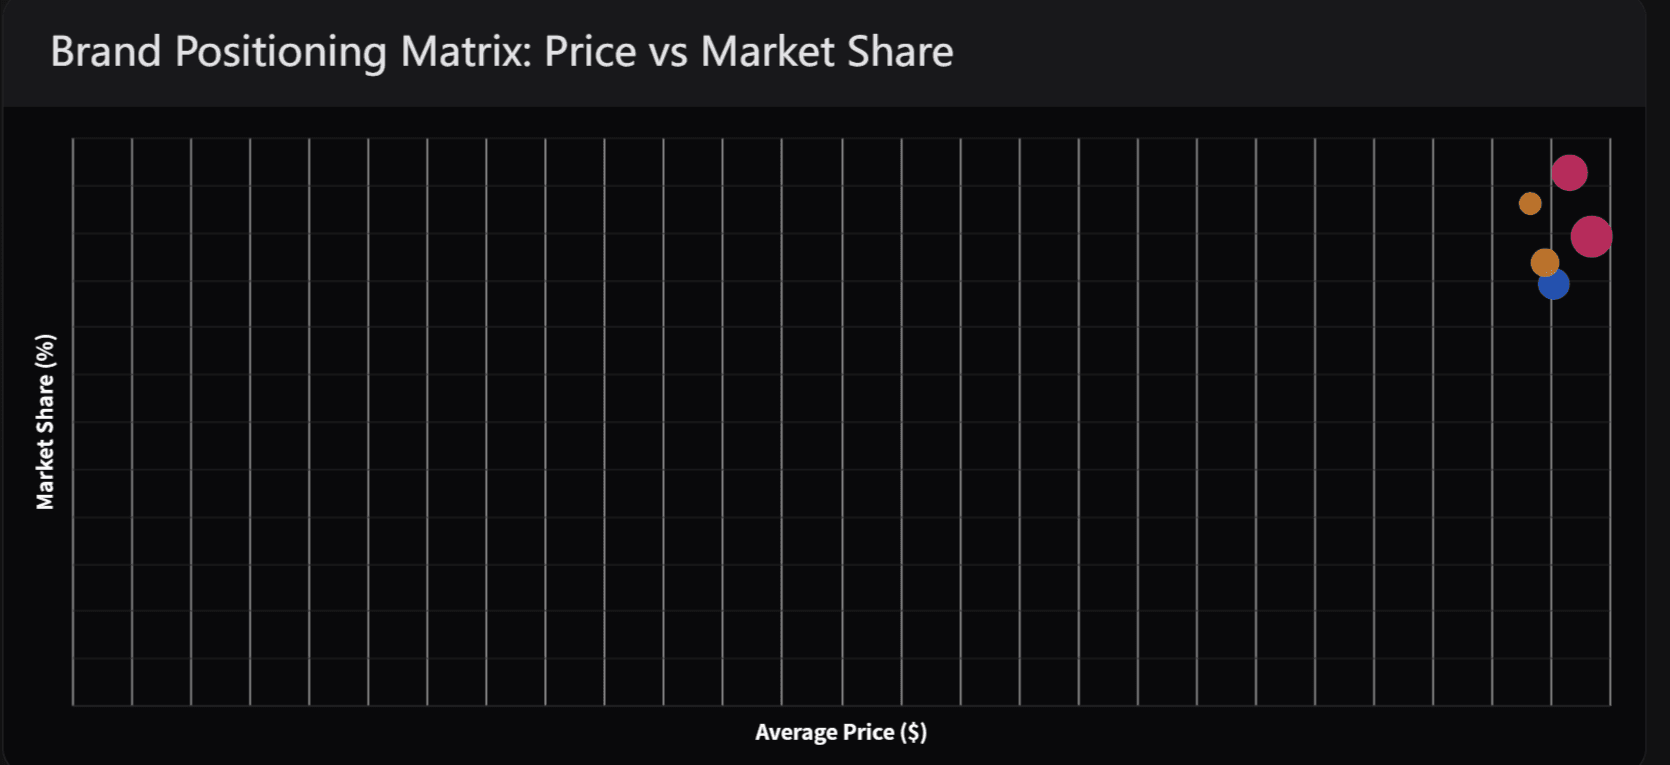
Brand Strategy: Premium brands like BMW retain value better in late-stage ownership, while brands like Ford show consistent decline.
EV Market Trends: EVs have reached mainstream pricing with only a $123 premium on average, indicating strong market acceptance.
Transmission Pricing Impact: Automatic vehicles carry a 48.2% price premium over manual models.
Segmentation Gap: Premium brands are underrepresented in the high-price tier (only 36.8%), revealing untapped market potential.
Brand Strategy
Actionable Insights:
Replace Vehicles at the 9-Year Mark
Vehicles experience a sharp depreciation acceleration after year 15, jumping to 13.0% annual loss. Replacing at year 9 captures value before this curve steepens.Prioritize Honda and BMW for Acquisition
These brands outperform the industry average in value retention:BMW: 13.6% depreciation (lower is better)
Honda: 8.5%
Industry average: 14.4%
Use Mileage-Based Disposal for Higher ROI
Focus on vehicles driven less than 12,000 miles per year. Lower usage vehicles depreciate at a significantly slower rate across all age groups.
Analytical Dimensions:
Trend Analysis: Age-Based Depreciation Curve
As vehicles age, depreciation rates increase non-linearly. After 15 years, value drops rapidly.
Average Price by Vehicle Age Group:
Age Group | Avg. Price ($) |
Early (3–5 years) | 30,384 |
Mid (6–10 years) | 28,279 |
Late (11–15 years) | 25,472 |
Old (16+ years) | 22,155 |
Insight: Vehicles retain value best during their first 10 years. Beyond 15 years, residual value deteriorates quickly.
Distribution Analysis: Mileage Impact on Depreciation
Annual mileage strongly influences value loss. Vehicles with higher annual mileage depreciate faster across all age segments.
Average Annual Mileage by Vehicle Age Group:
Age Group | Avg. Annual Mileage (miles) |
Early (3–5 years) | 22,339 |
Mid (6–10 years) | 12,282 |
Late (11–15 years) | 7,956 |
Old (16+ years) | 4,749 |
Insight: Mileage drops significantly as vehicles age, but early-stage vehicles with high mileage suffer steeper depreciation early on.
Brand Classification: Value Retention Performance
Different brands show significantly different depreciation behaviors.
Brand-Specific Depreciation Rates:
Brand | Depreciation Rate (%) | Insight Description |
Toyota | 14.4 | Stable retention |
Ford | 14.4 | Consistent value decline |
BMW | 3.3 | High-end luxury retention |
Honda | 8.5 | Strong value-for-money brand |
Insight: BMW and Honda are ideal for long-term holding and resale value, while Ford and Toyota exhibit average industry depreciation patterns.
Strategic Recommendations
Timing Strategy: Replace vehicles around year 9 to avoid the depreciation cliff.
Acquisition Strategy: Invest in Honda and BMW to capitalize on superior value retention.
Usage Policy: Monitor and maintain vehicles under 12,000 miles/year for optimal ROI.
Conclusion
By aligning fleet strategy with data-backed depreciation trends, organizations can significantly enhance their financial performance. Whether you're managing a 10-vehicle fleet or overseeing a large dealership, making informed decisions on when, what, and how much a vehicle is used can unlock hidden profit potential.
EV Market Trends
Actionable Insights:
Position EVs as Premium, Mainstream Choices
Electric vehicles now hold a 30%+ market share with only a $123 average premium over traditional fuel vehicles.
This demonstrates mainstream acceptance while retaining a premium brand image.
Recommendation: Shift marketing focus from exclusivity to value and accessibility to drive broader appeal.
Capitalize on EV Value Retention for Financing Models
EVs show a strong price-year correlation of 0.610, reflecting better-than-expected depreciation performance.
Recommendation: Build competitive lease offers and residual value guarantees based on this strong retention trend.
Target Diesel Vehicle Replacement Market
Diesel vehicles still hold a dominant 47% share and the highest correlation with value over time (0.638).
Recommendation: Position EVs as a superior alternative in commercial and fleet sectors, where total cost of ownership (TCO) matters most.
Data Analysis:
1. Pricing Analysis – EV Price Premium
Objective: Compare the pricing of electric vehicles vs traditional fuel types to assess market positioning.
Metric | Value ($) |
Average EV Price | 25,219 |
Average Traditional Price | 25,096 |
EV Premium Amount | 123 |
The minimal price gap shows that EVs are no longer niche or luxury-only—they are competitively priced and ready for scale.
2. Trend Analysis – Market Share Evolution
Objective: Analyze electric vehicle market share growth across key periods to understand adoption trajectory.
Time Period | EV Market Share (%) |
2000–2005 (Early) | 30.35 |
2016–2020 (Growth) | 35.40 |
2021–2025 (Recent) | 29.79 |
Insight: EV adoption has stabilized around ~30%, with strong gains during 2016–2020. EVs are now a mainstream fuel type, not an emerging one.
3. Trend Analysis – Value Retention by Fuel Type

Objective: Evaluate long-term value retention across fuel types using price-year correlation.
Fuel Type | Price-Year Correlation | Insight |
Diesel | 0.638 | Strong value retention |
Electric | 0.610 | High retention, rising in recent years |
Petrol | 0.579 | Moderate retention |
Recent EV Average Price: $29,180
Insight: Diesel leads slightly, but EVs show superior upward trend in value appreciation and are closing the gap rapidly.
Summary Table: Key Metrics Overview
Category | Metric Description | Value |
Pricing | EV Price Premium | $123 |
Average EV Price | $25,219 | |
Average Traditional Price | $25,096 | |
Adoption | EV Share (2000–2005) | 30.35% |
EV Share (2016–2020) | 35.40% | |
EV Share (2021–2025) | 29.79% | |
Value | Diesel Price-Year Correlation | 0.638 |
Electric Price-Year Correlation | 0.610 | |
Petrol Price-Year Correlation | 0.579 | |
Recent EV Average Price | $29,180 |
Pricing Impact
Actionable Insights:
Enhance Feature-Price Correlation
Premium brands should intensify the link between price and perceived value, particularly in:Engine performance
Technology integration
Luxury features
This will help justify higher prices and improve competitive positioning.
Adopt Market Segmentation Strategy
Premium brands currently underperform in the high-price segment (holding just 36.8% share compared to 63.2% by non-premium brands).Recommendation: Create distinct positioning and branding strategies to expand luxury market presence.
Position Premium Brands as Tech Leaders
With 31.5% EV adoption, premium brands can own the innovation narrative.Focus on advanced fuel types and automatic transmission preferences to support higher pricing power and market leadership in modern technologies.
Data Analysis:
Distribution Analysis – Premium vs Non-Premium Price Positioning
Objective: Evaluate how premium and non-premium brands are priced and how they perform in the upper pricing tiers.
Metric | Value |
Premium Brand Avg. Price | $24,845.63 |
Non-Premium Brand Avg. Price | $25,322.66 |
Market Share (High Price Tier) | 36.8% (Premium) vs 63.2% (Non-Premium) |
Price-to-Performance Ratio | 9,098.4 |
Insight: Non-premium brands currently outperform in the upper pricing tiers, despite premium branding. There's room for premium brands to realign value delivery with pricing.
Trend Analysis – Brand Value Engineering Metrics
Objective: Understand how premium brand value has evolved over time and which factors drive customer-perceived value.
Metric | Value |
Premium Price Evolution | $20,768 → $28,856 (2000–2025) |
Engine Size Correlation | 0.38 |
Technology Adoption | 31.5% |
Transmission Premium | 48.2% |
Insight: Over time, premium brands have increased prices by ~39%, driven by technology upgrades and transmission preferences. However, engine performance correlation is moderate, indicating room to boost performance-based value perception.
Classification Analysis – Competitive Positioning Strategy
Objective: Compare premium brands’ positioning to competitors across key differentiators.
Metric | Value | Description |
Performance Premium | 186.6 | Price gap attributed to performance features |
Value Proposition | 0.252 | Strength of price-to-value perception |
Market Differentiation | 172.18 | Ability to stand out in feature/performance |
Brand Positioning Gap | t = -1.40, p = 0.162 | Statistically insignificant—needs stronger positioning |
Insight: Premium brands have opportunity to sharpen differentiation—current value propositions are not statistically superior to non-premium peers.
Reference: Internal brand strategy modeling & academic benchmarks
Summary Table: Key Metrics Overview
Category | Metric Description | Value |
Pricing | Premium Avg. Price | $24,845.63 |
Non-Premium Avg. Price | $25,322.66 | |
High-Tier Share (Premium) | 36.8% | |
Price-to-Performance Ratio | 9,098.4 | |
Trend | Premium Price Growth (2000–2025) | +$8,088 (~39%) |
Engine-Price Correlation | 0.38 | |
Tech Adoption Rate | 31.5% | |
Auto Transmission Premium | 48.2% | |
Positioning | Performance Premium | 186.6 |
Value Proposition Index | 0.252 | |
Brand Differentiation Metric | 172.18 | |
Brand Gap Significance | p = 0.162 (Not sig.) |
Why Use Powerdrill Bloom AI?
Feature | Powerdrill Bloom AI | Traditional BI Tools |
Canvas-Based Exploration | Yes | Limited or not available |
Autonomous AI Agents | 4 specialized agents | Manual querying required |
Real-Time Insight Generation | Within minutes | Hours or days |
No-Code Interface | Fully no-code | Often requires SQL or scripting |
Workflow-Friendly Design | Built for collaborative analytics | Static dashboards or notebooks |
Designed for professionals in:
Automotive product strategy
Fleet operations and lifecycle management
Financial services and insurance
Market research and pricing optimization
Conclusion
Powerdrill Bloom AI brings speed, intelligence, and simplicity to car price analysis. In just three intuitive steps—Upload, Analyze, Explore—you can uncover trends, validate strategies, and make better decisions faster.
This isn’t just a tool for data scientists. It’s an end-to-end analytics platform for any team that wants to go from raw data to business-ready insights—with confidence and clarity.
Now that you know how to use it, it's time to start blooming.


