
Introduction
Sales analysis has always been at the core of retail strategy. From deciding product placements in stores to identifying which collections deserve more investment, the ability to understand sales data directly impacts revenue and growth. However, traditional sales analysis is often time-consuming, requiring manual reporting, spreadsheet crunching, and repetitive dashboard setups. For fast-moving industries like fashion retail, where trends shift quickly and decisions must be made almost in real time, this lag can mean missed opportunities.
This is where AI-powered analytics tools like Powerdrill Bloom come in. Instead of manually dissecting data, Bloom leverages artificial intelligence to automatically generate insights, highlight growth opportunities, and visualize trends. With just a simple data upload, teams can move from raw numbers to actionable strategies — all without needing technical expertise or hours of manual work.
In this article, we'll walk through a real-world use case: analyzing Zara sales data with Powerdrill Bloom. You'll see how Bloom turns a standard sales dataset into clear, data-driven recommendations.
Dataset Overview: Zara_Sales_Analysis.csv
To demonstrate Bloom in action, we use a sample dataset named Zara_Sales_Analysis.csv. This dataset contains sales performance records across several dimensions that are highly relevant for retail analysis, including:
Product categories (e.g., men's jackets, women's apparel)
Store placement (aisle vs. front of store)
Seasonality and growth trends
Price bands (low-tier, mid-tier, premium)
Unit volumes and relative market share
These fields reflect the everyday challenges a fashion retailer faces: how to optimize store layout, how to balance men's and women's collections, and how to price strategically across different ranges.
By uploading this dataset into Powerdrill Bloom, we can instantly uncover hidden patterns — such as which products thrive in front-of-store placements, or how men's and women's categories differ in growth potential. Instead of manually creating pivot tables or charts, Bloom does the heavy lifting, surfacing insights that drive better decisions.
Step 1: Upload and Explore with Powerdrill Bloom
The first step in sales analysis with AI is as simple as uploading your dataset. In Powerdrill Bloom, you just drag and drop your CSV file — in this case, Zara_Sales_Analysis.csv — and the platform immediately begins processing. There’s no need to write SQL queries, configure dashboards, or manually define metrics.
Log in to bloom.powerdrill.ai.
Click "Start Blooming", select your desired language, and upload your file.

Once the file is uploaded, Bloom automatically scans the dataset, detects column types (such as product categories, sales volumes, placement, and price ranges), and prepares it for exploration. Within seconds, you're presented with an interactive overview of your data, where AI suggests the most relevant angles to explore.
For example:
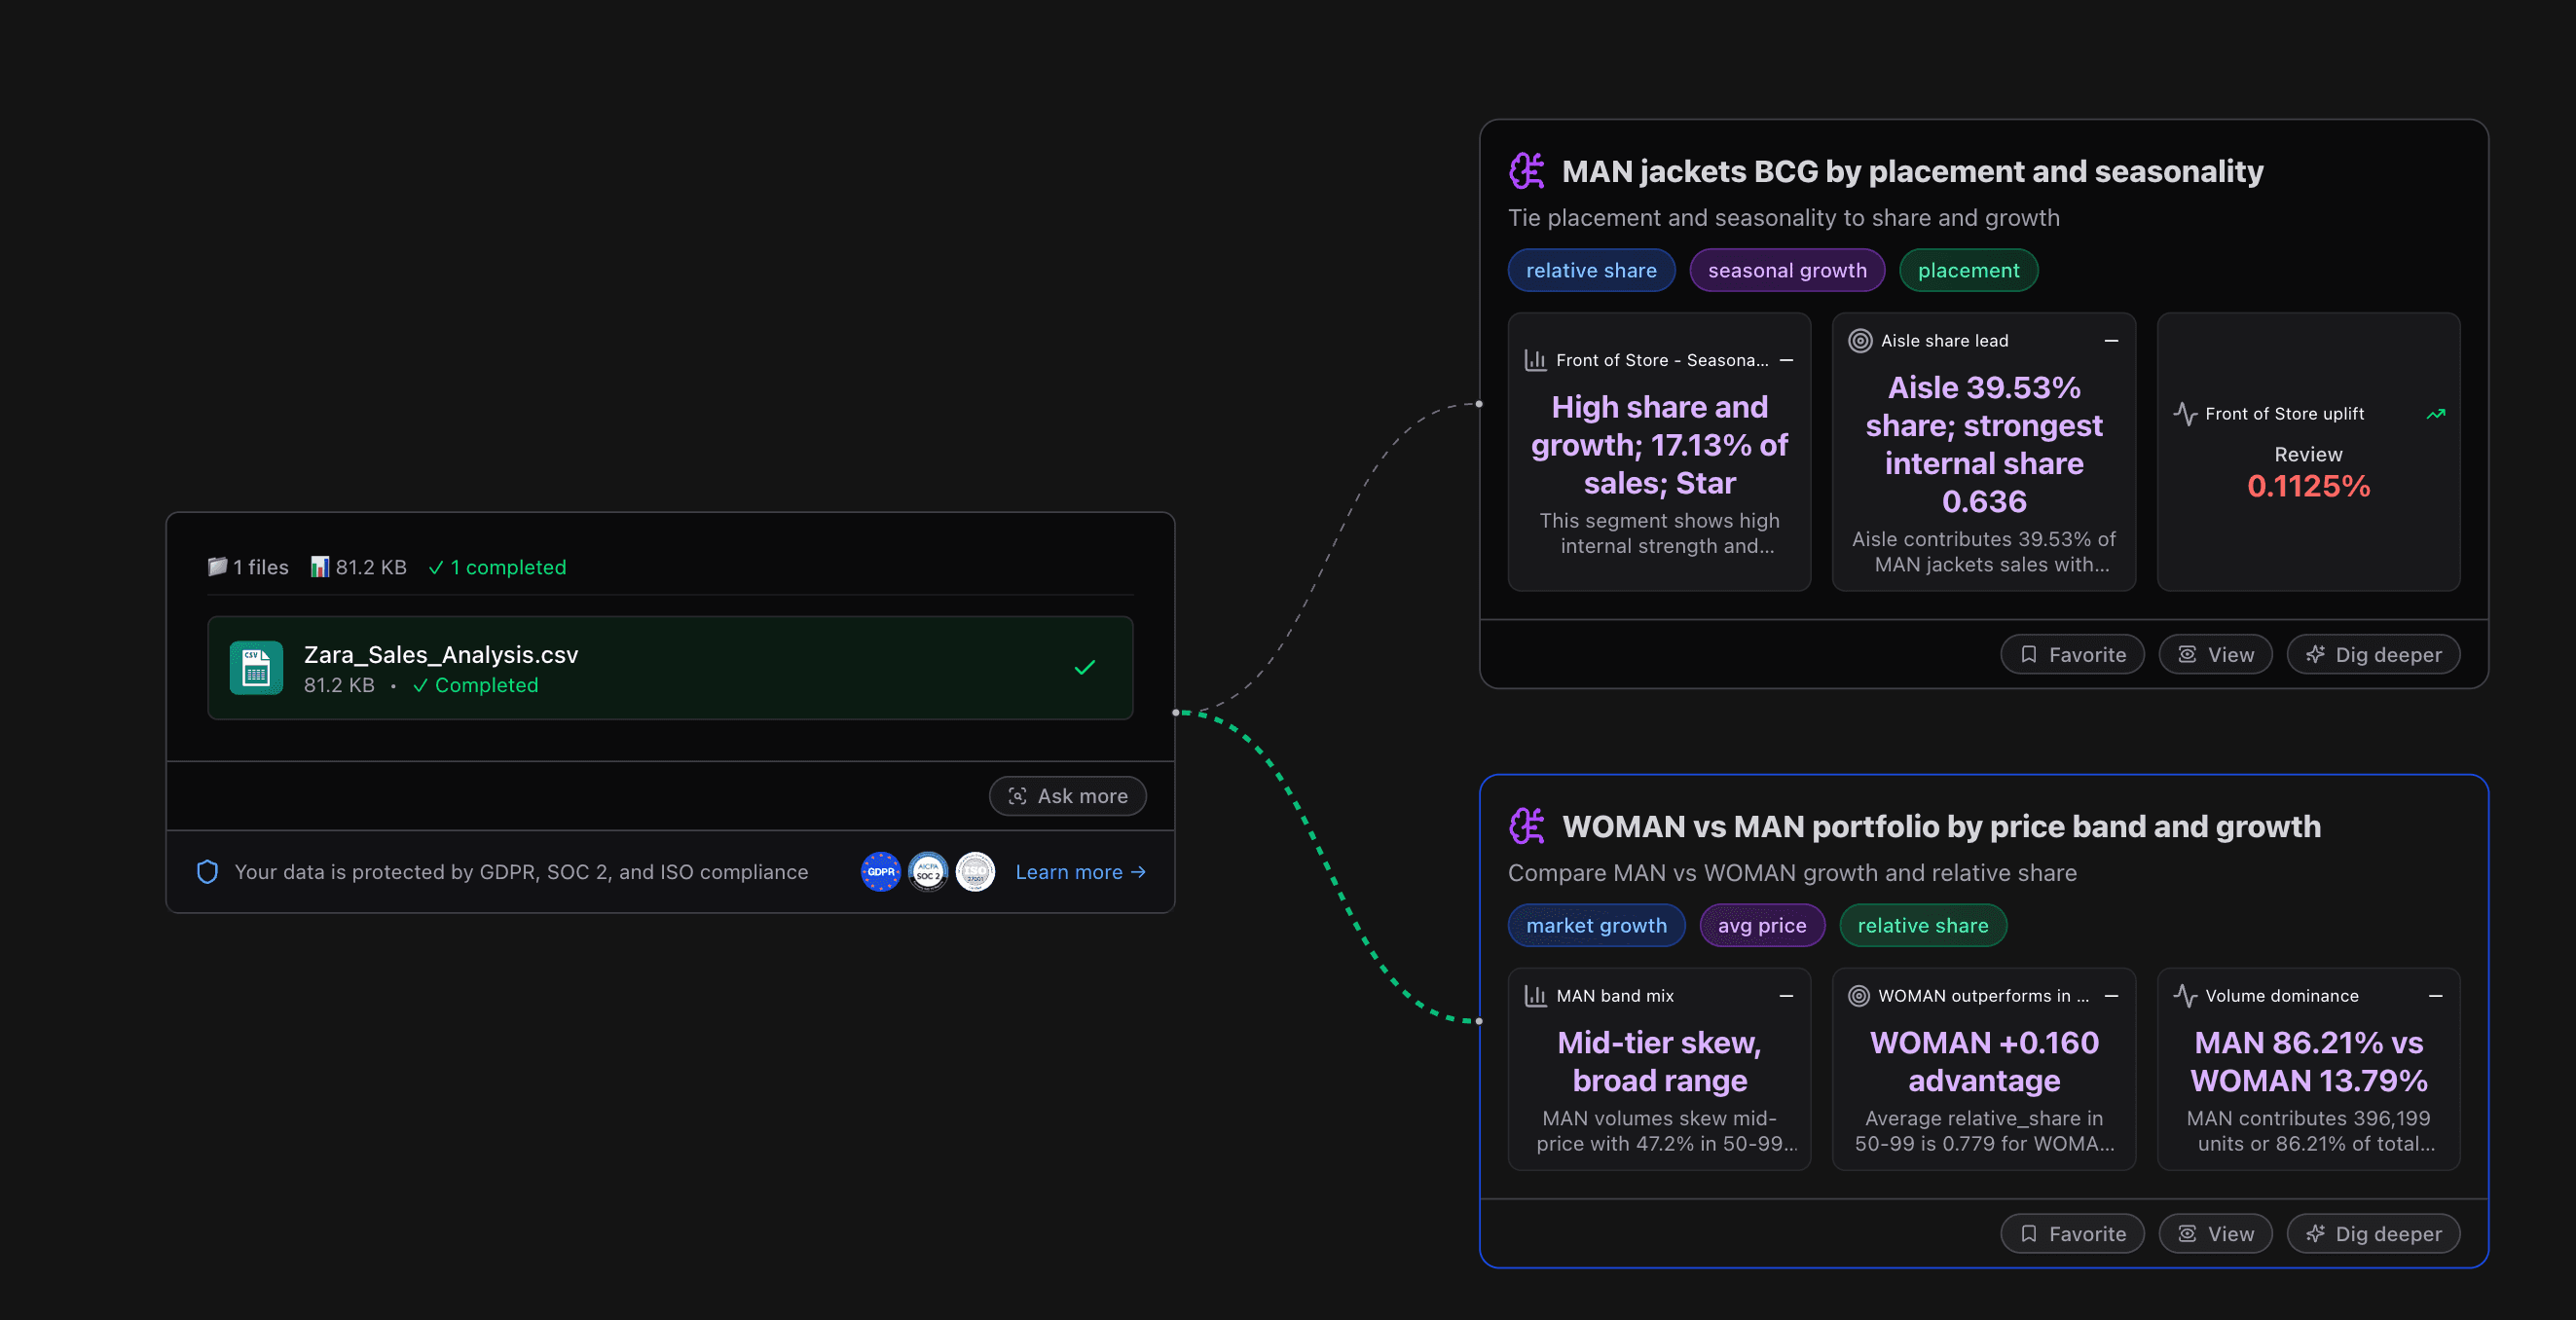
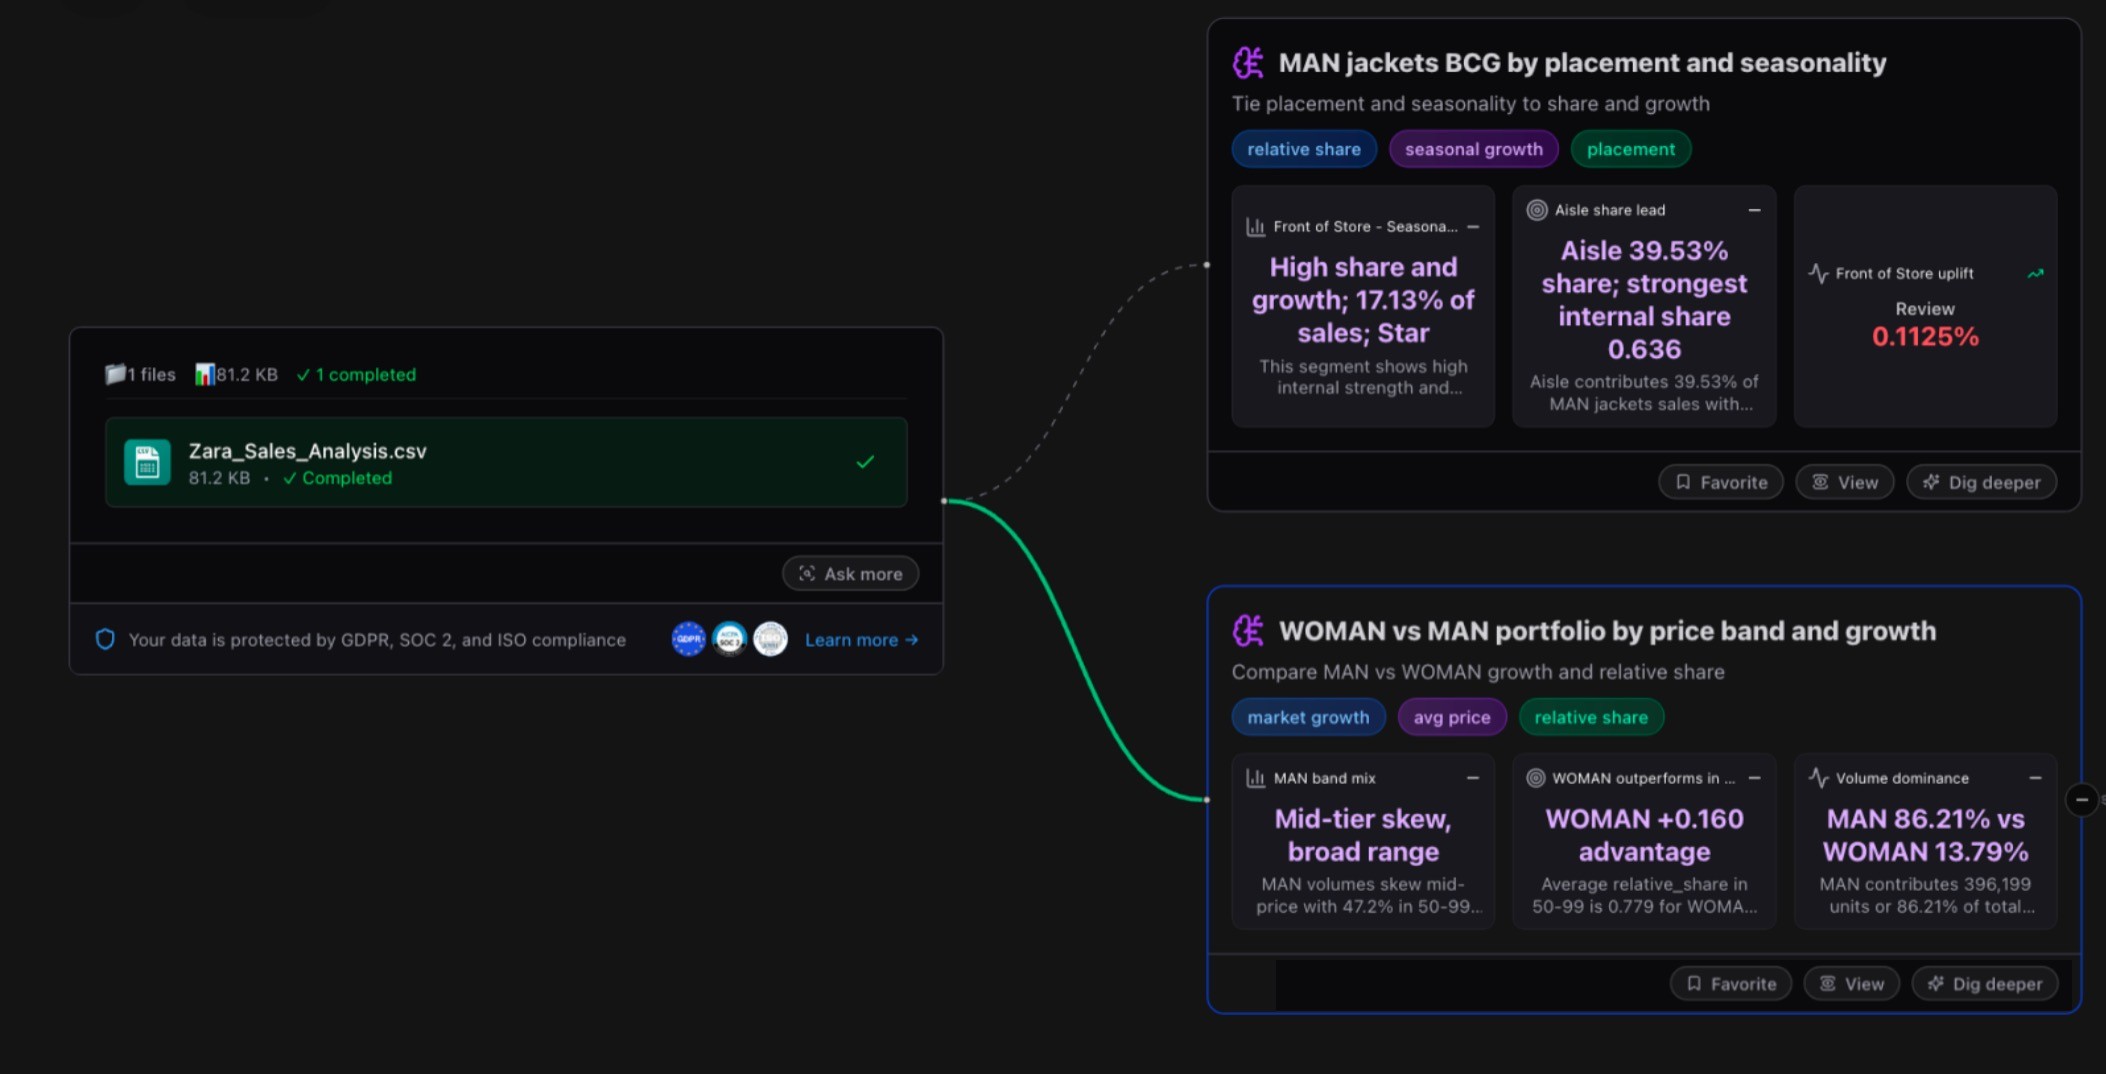
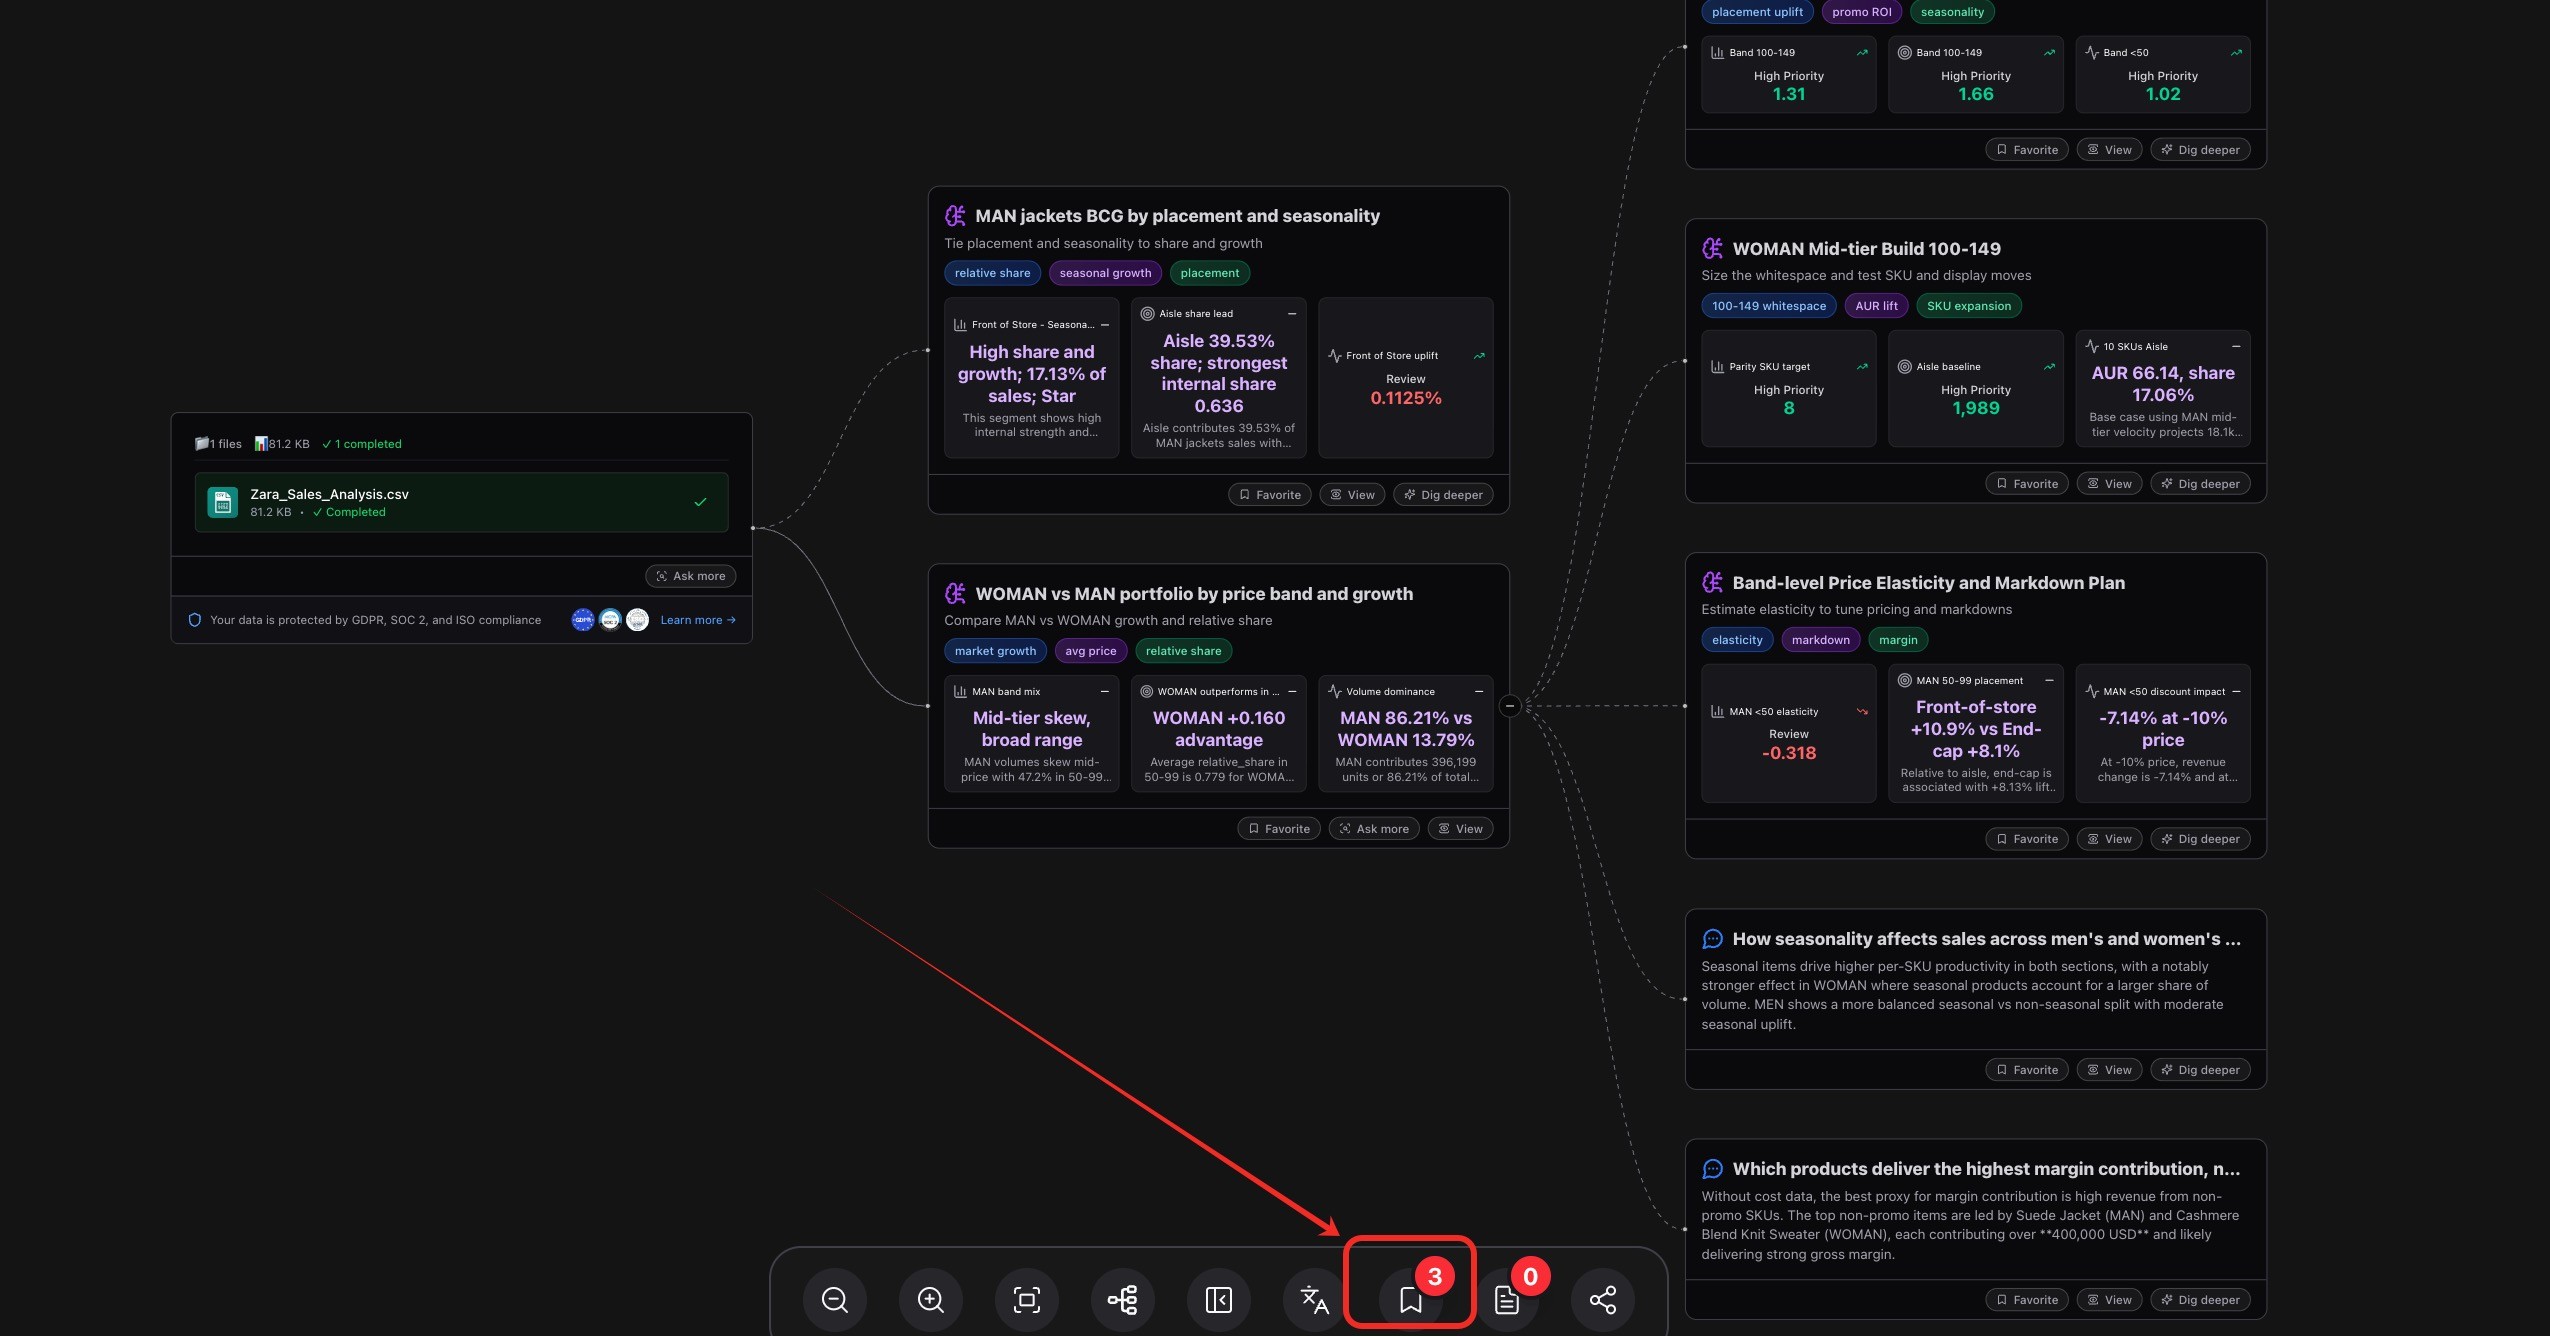
The platform immediately highlighted two interesting perspectives:
MAN Jackets by Placement and Seasonality
Bloom identified that men’s jackets displayed at the front of the store achieved 17.13% sales growth, positioning them as a “Star” segment with both high share and momentum. Meanwhile, jackets placed in the aisle contributed the largest internal share (39.53%), making aisle placement the most dominant sales driver. Bloom even quantified the uplift from front-of-store placement at 0.1125%, a detail that would normally take manual calculation to uncover.WOMAN vs. MAN Portfolio by Price Band and Growth
Bloom also compared men’s and women’s product lines across price tiers. The analysis showed that while men’s products dominate overall sales (86.21% vs. 13.79%), women’s products actually outperform in the mid-tier price range, holding a relative advantage of +0.160. This finding suggests that even though men’s volumes are higher, women’s mid-tier assortment is more competitive and could be scaled further.
These insights were generated automatically within seconds, turning a raw CSV file into clear business intelligence. Instead of manually slicing the data, Powerdrill Bloom proactively surfaces the patterns that matter most.
If you're interested in any node, click "View" in the lower right corner. Then, you can view the details:
In the details panel, you can view both actionable insights and data visualizations, giving you a more intuitive understanding of how each insight is derived.
Step 2: Explore Deeper
Now, we can dig deeper to see what else can you get from WOMAN vs MAN portfolio by price band and growth.
Click "Dig deeper" in the lower right corner of the card.
After uncovering the first layer of insights, Powerdrill Bloom allows you to dig deeper into specific patterns. This step goes beyond surface-level comparisons to quantify opportunities and guide strategic moves.
From the Zara dataset, Bloom surfaced several advanced insights when drilling down:
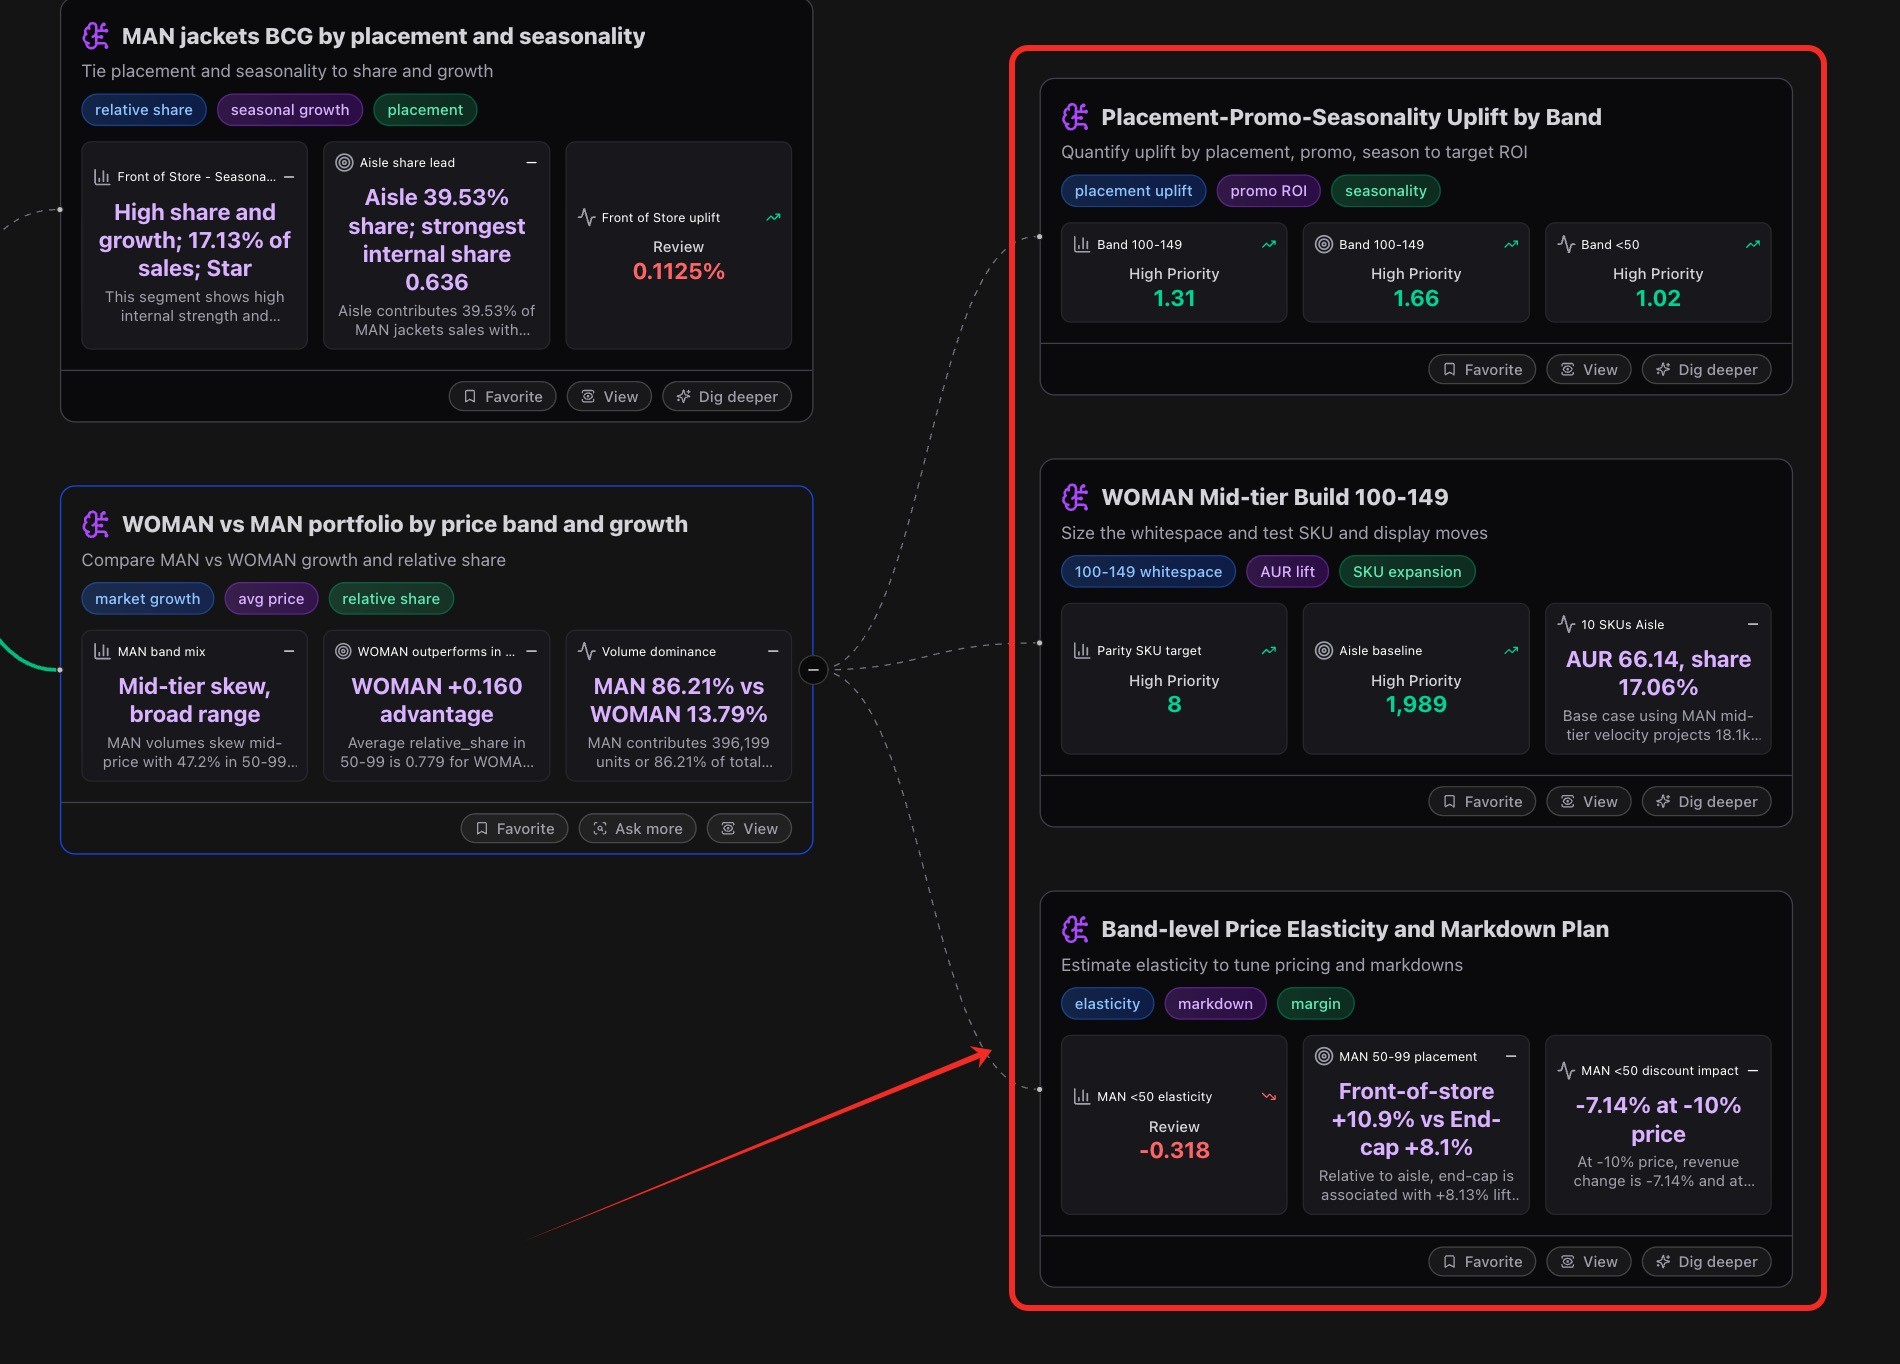
Placement–Promo–Seasonality Uplift by Band
Bloom quantified how placement and promotions drive uplift across price bands.Band 100–149: ROI uplift of 1.31 (high priority).
Band 50–99: Even higher uplift at 1.66, highlighting strong responsiveness.
Band <50: Uplift still positive at 1.02, though less pronounced.
These results show how promotional efficiency varies by price tier, helping prioritize where to invest marketing spend.
WOMAN Mid-Tier Build (100–149)
Bloom identified whitespace opportunities for women’s products in the mid-tier band.Recommended parity SKU target: 8 and a baseline uplift potential of 1,989 units.
AUR (Average Unit Retail) of 66.14, contributing 17.06% share in the tested range.
This suggests that expanding the WOMAN portfolio in the 100–149 band could significantly rebalance sales and capture unmet demand.
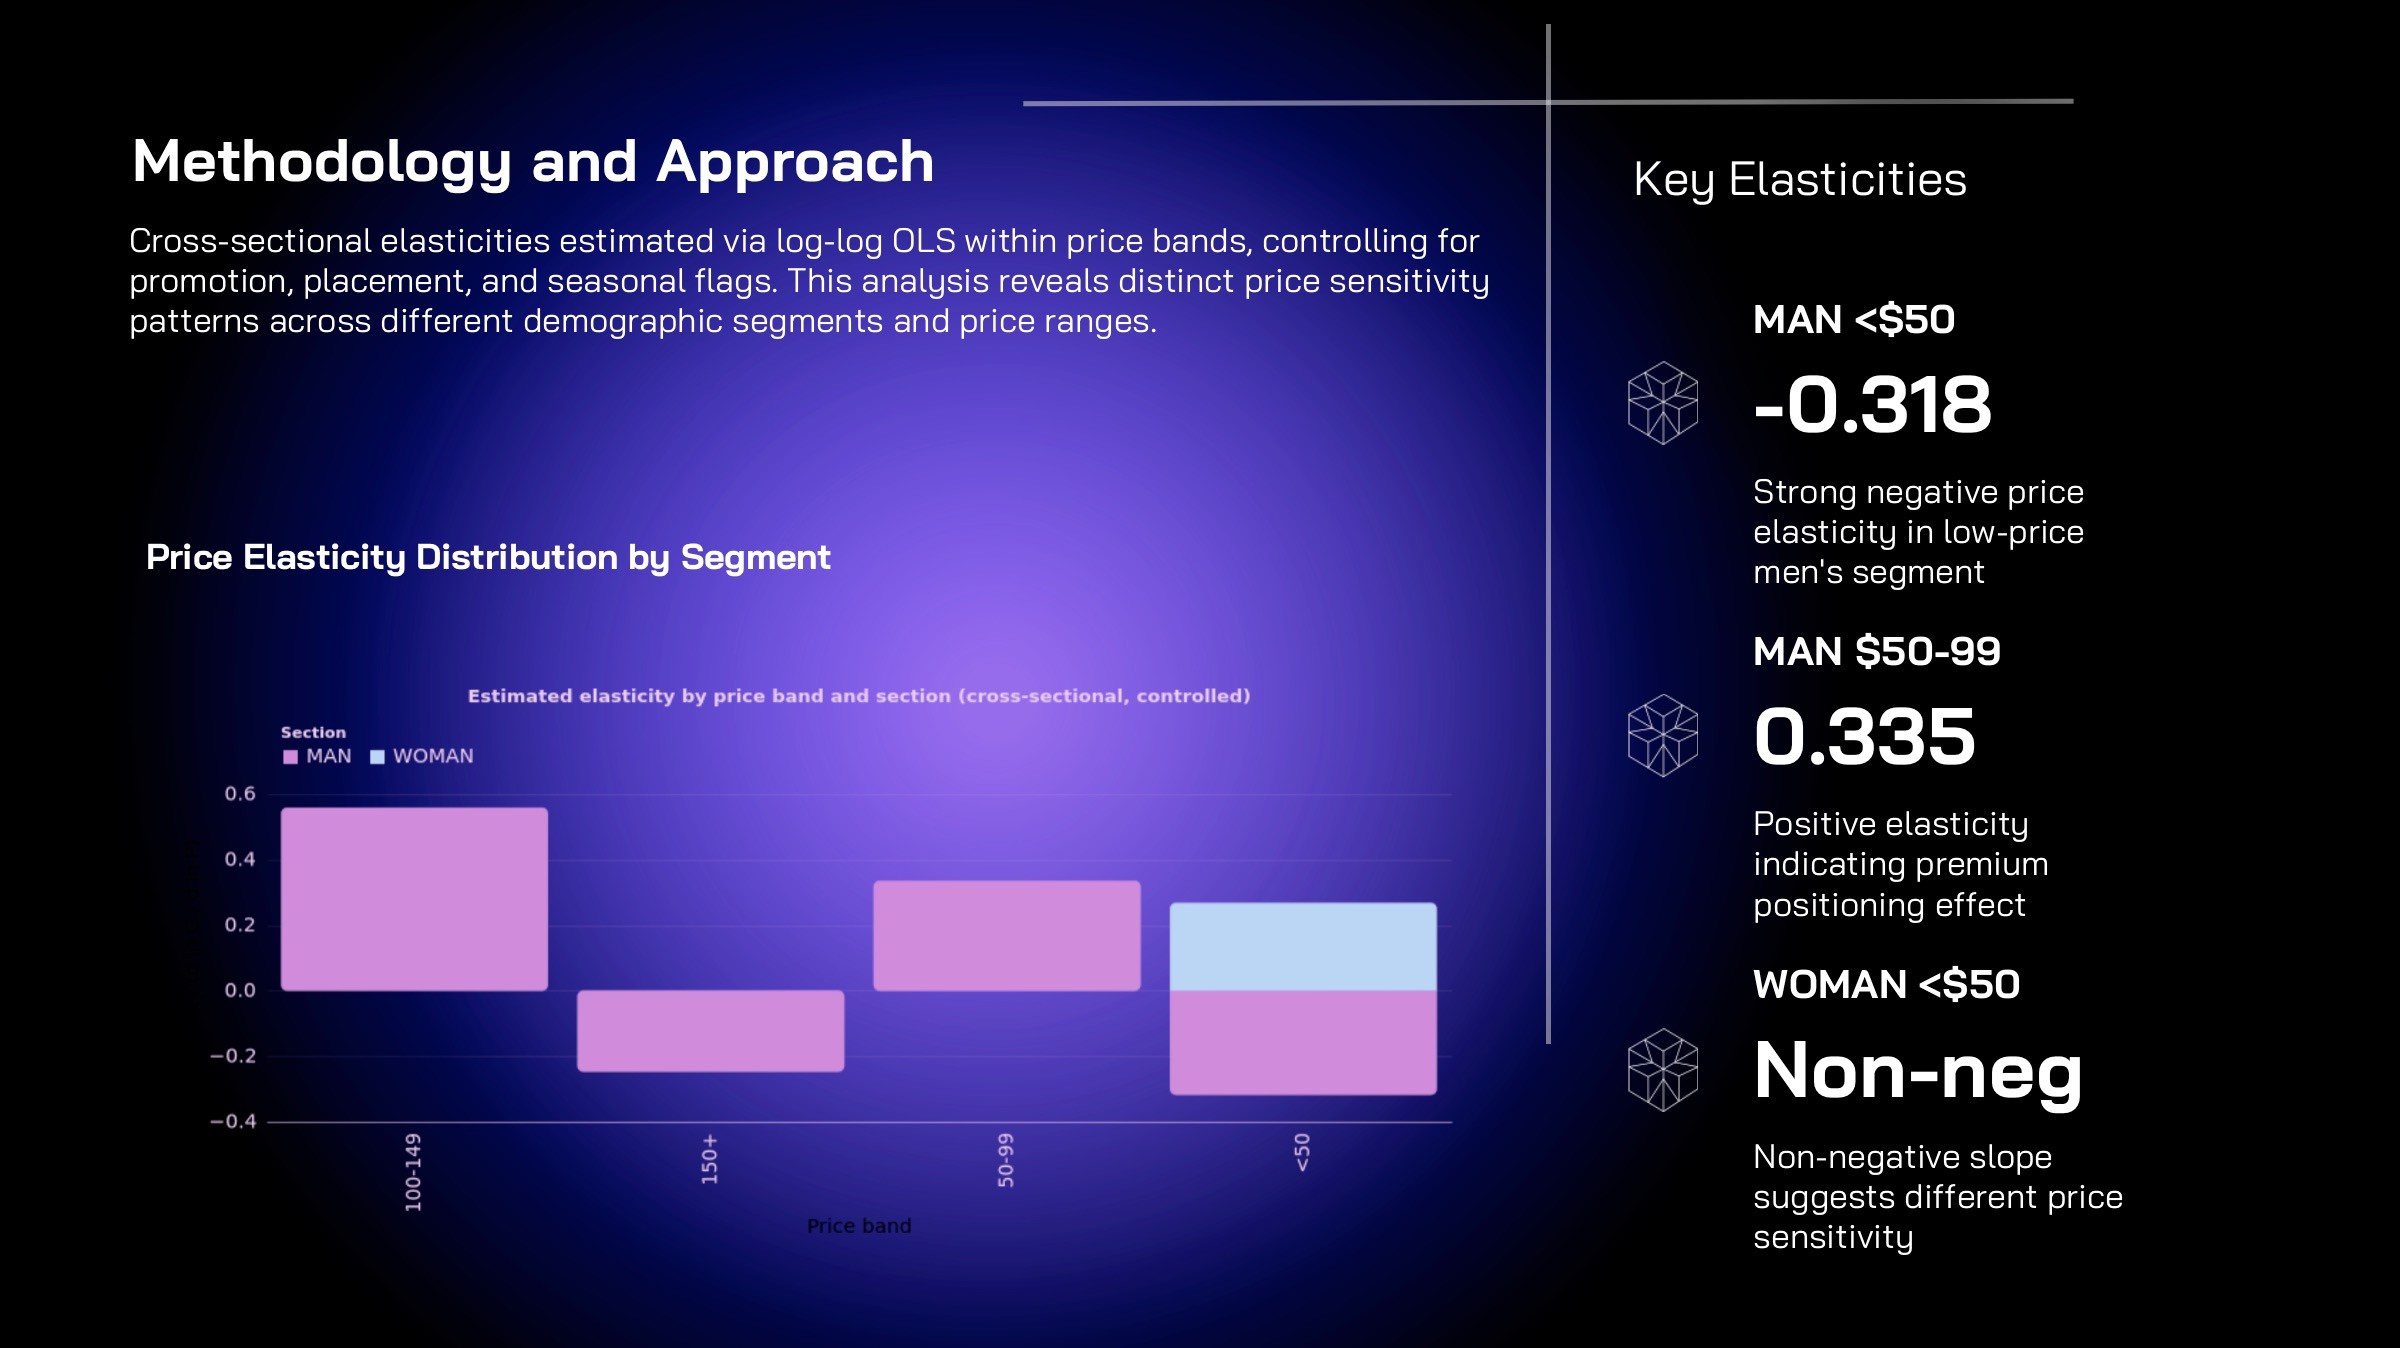
Band-Level Price Elasticity and Markdown Plan
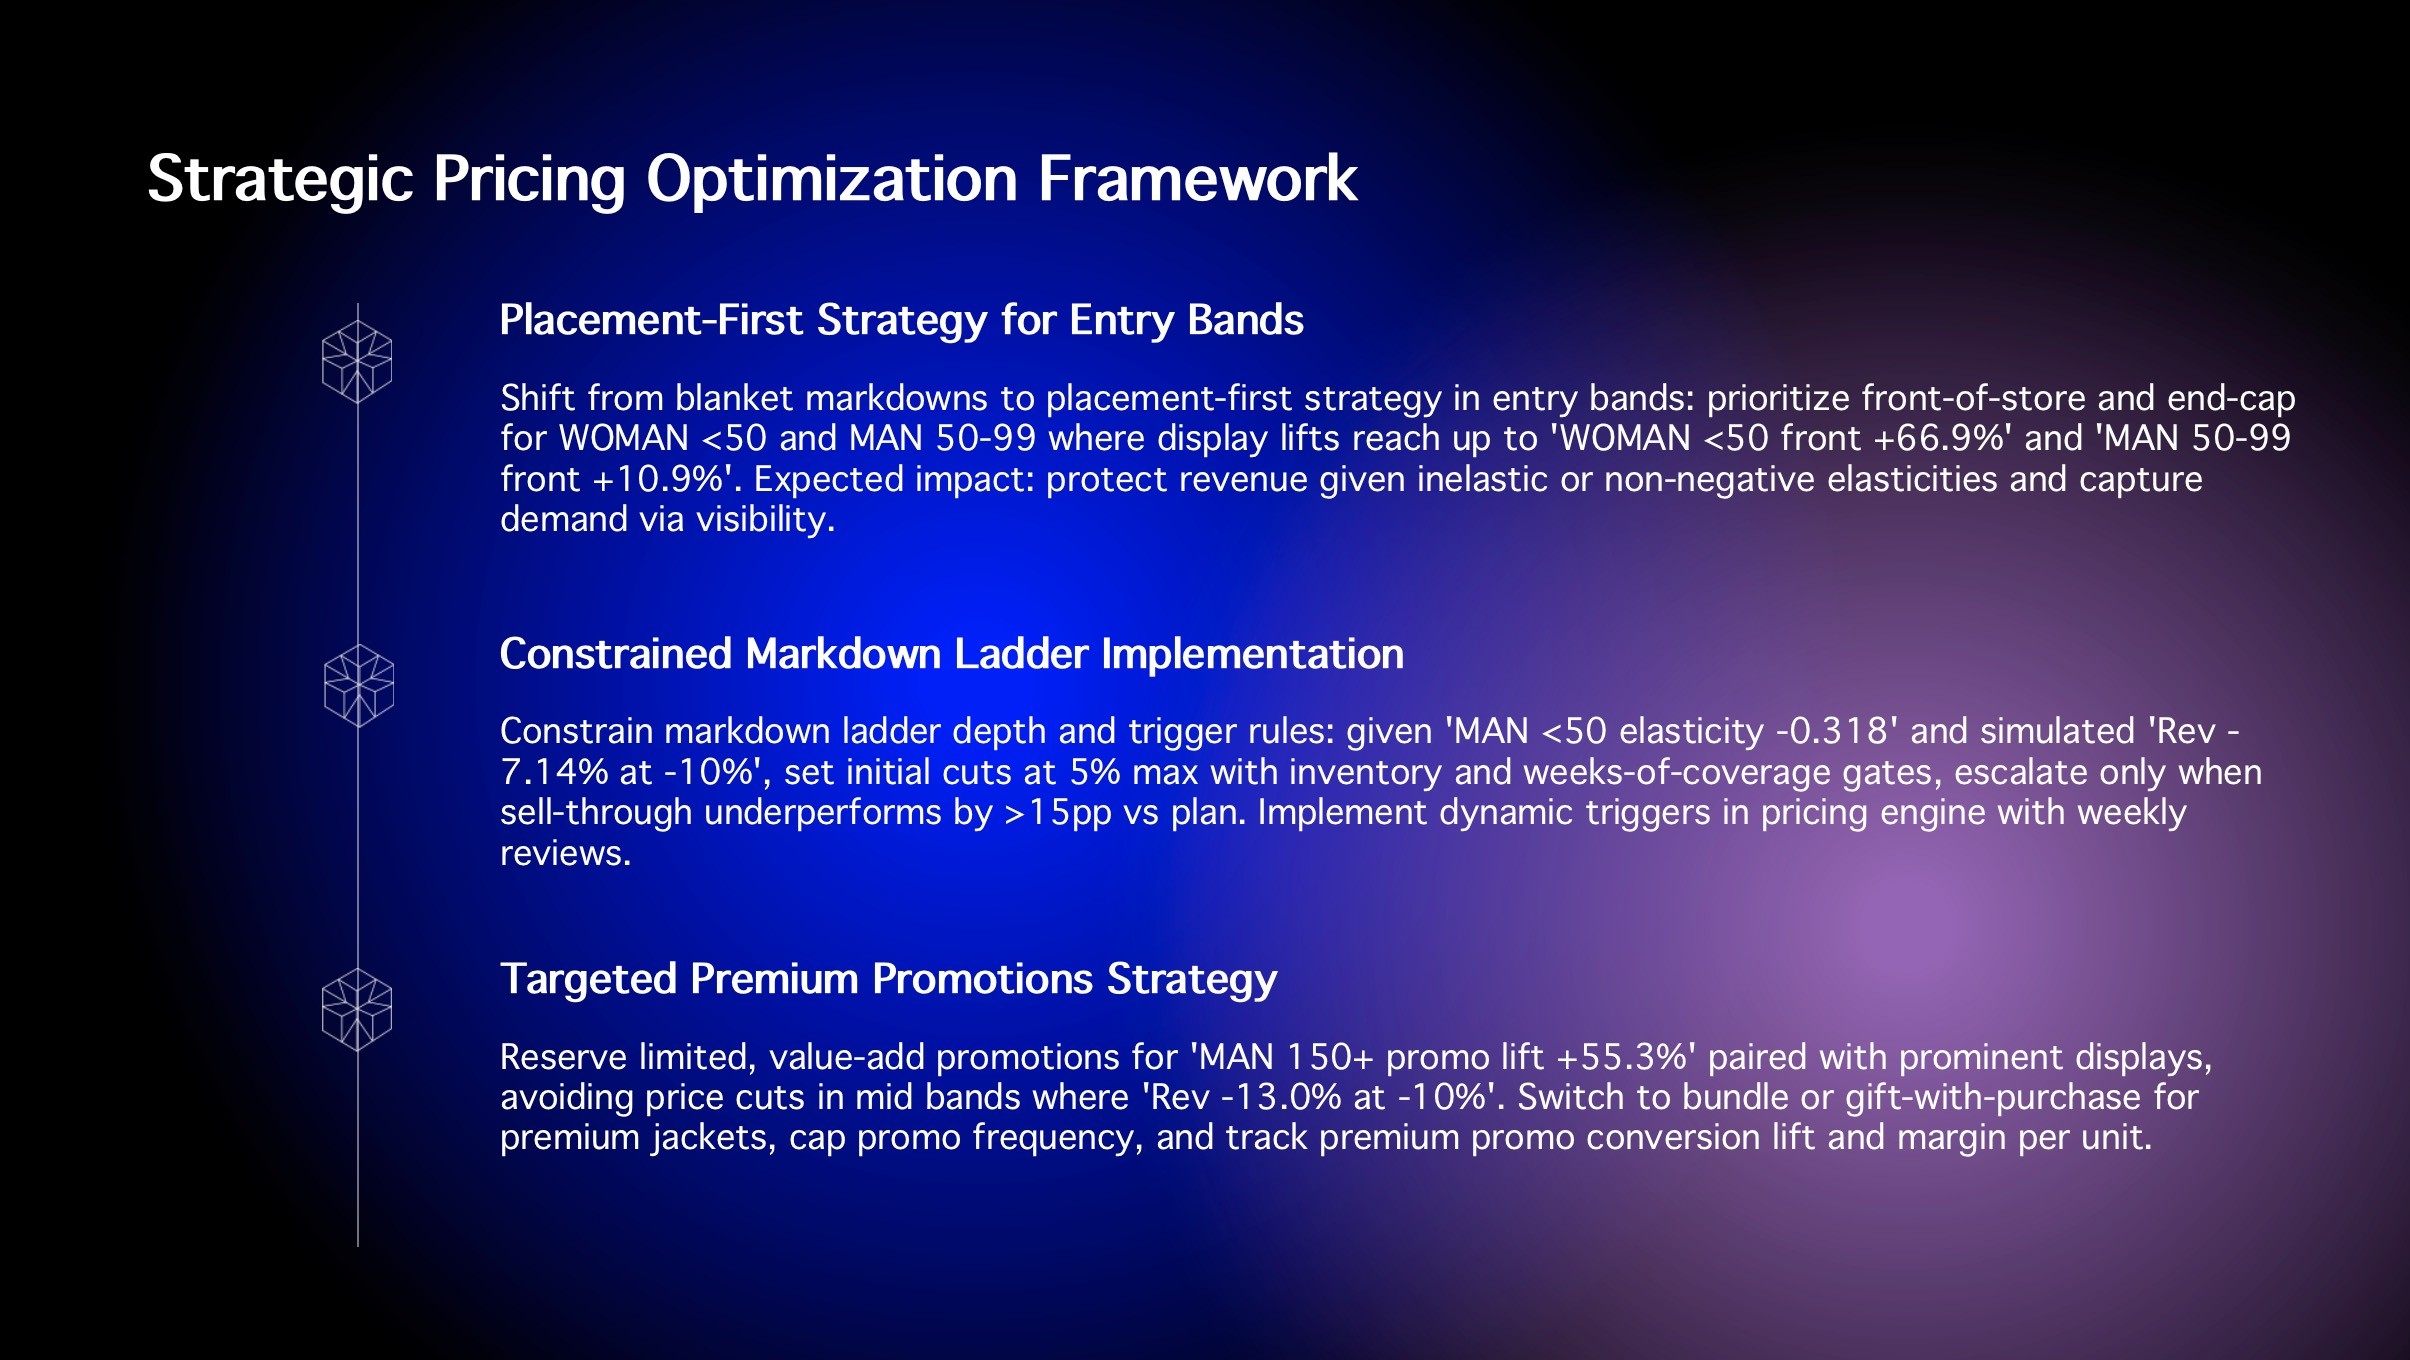
Pricing insights revealed how elasticity and markdowns influence revenue.For men’s products under <50 price band, elasticity was negative (–0.318), indicating vulnerability to price cuts.
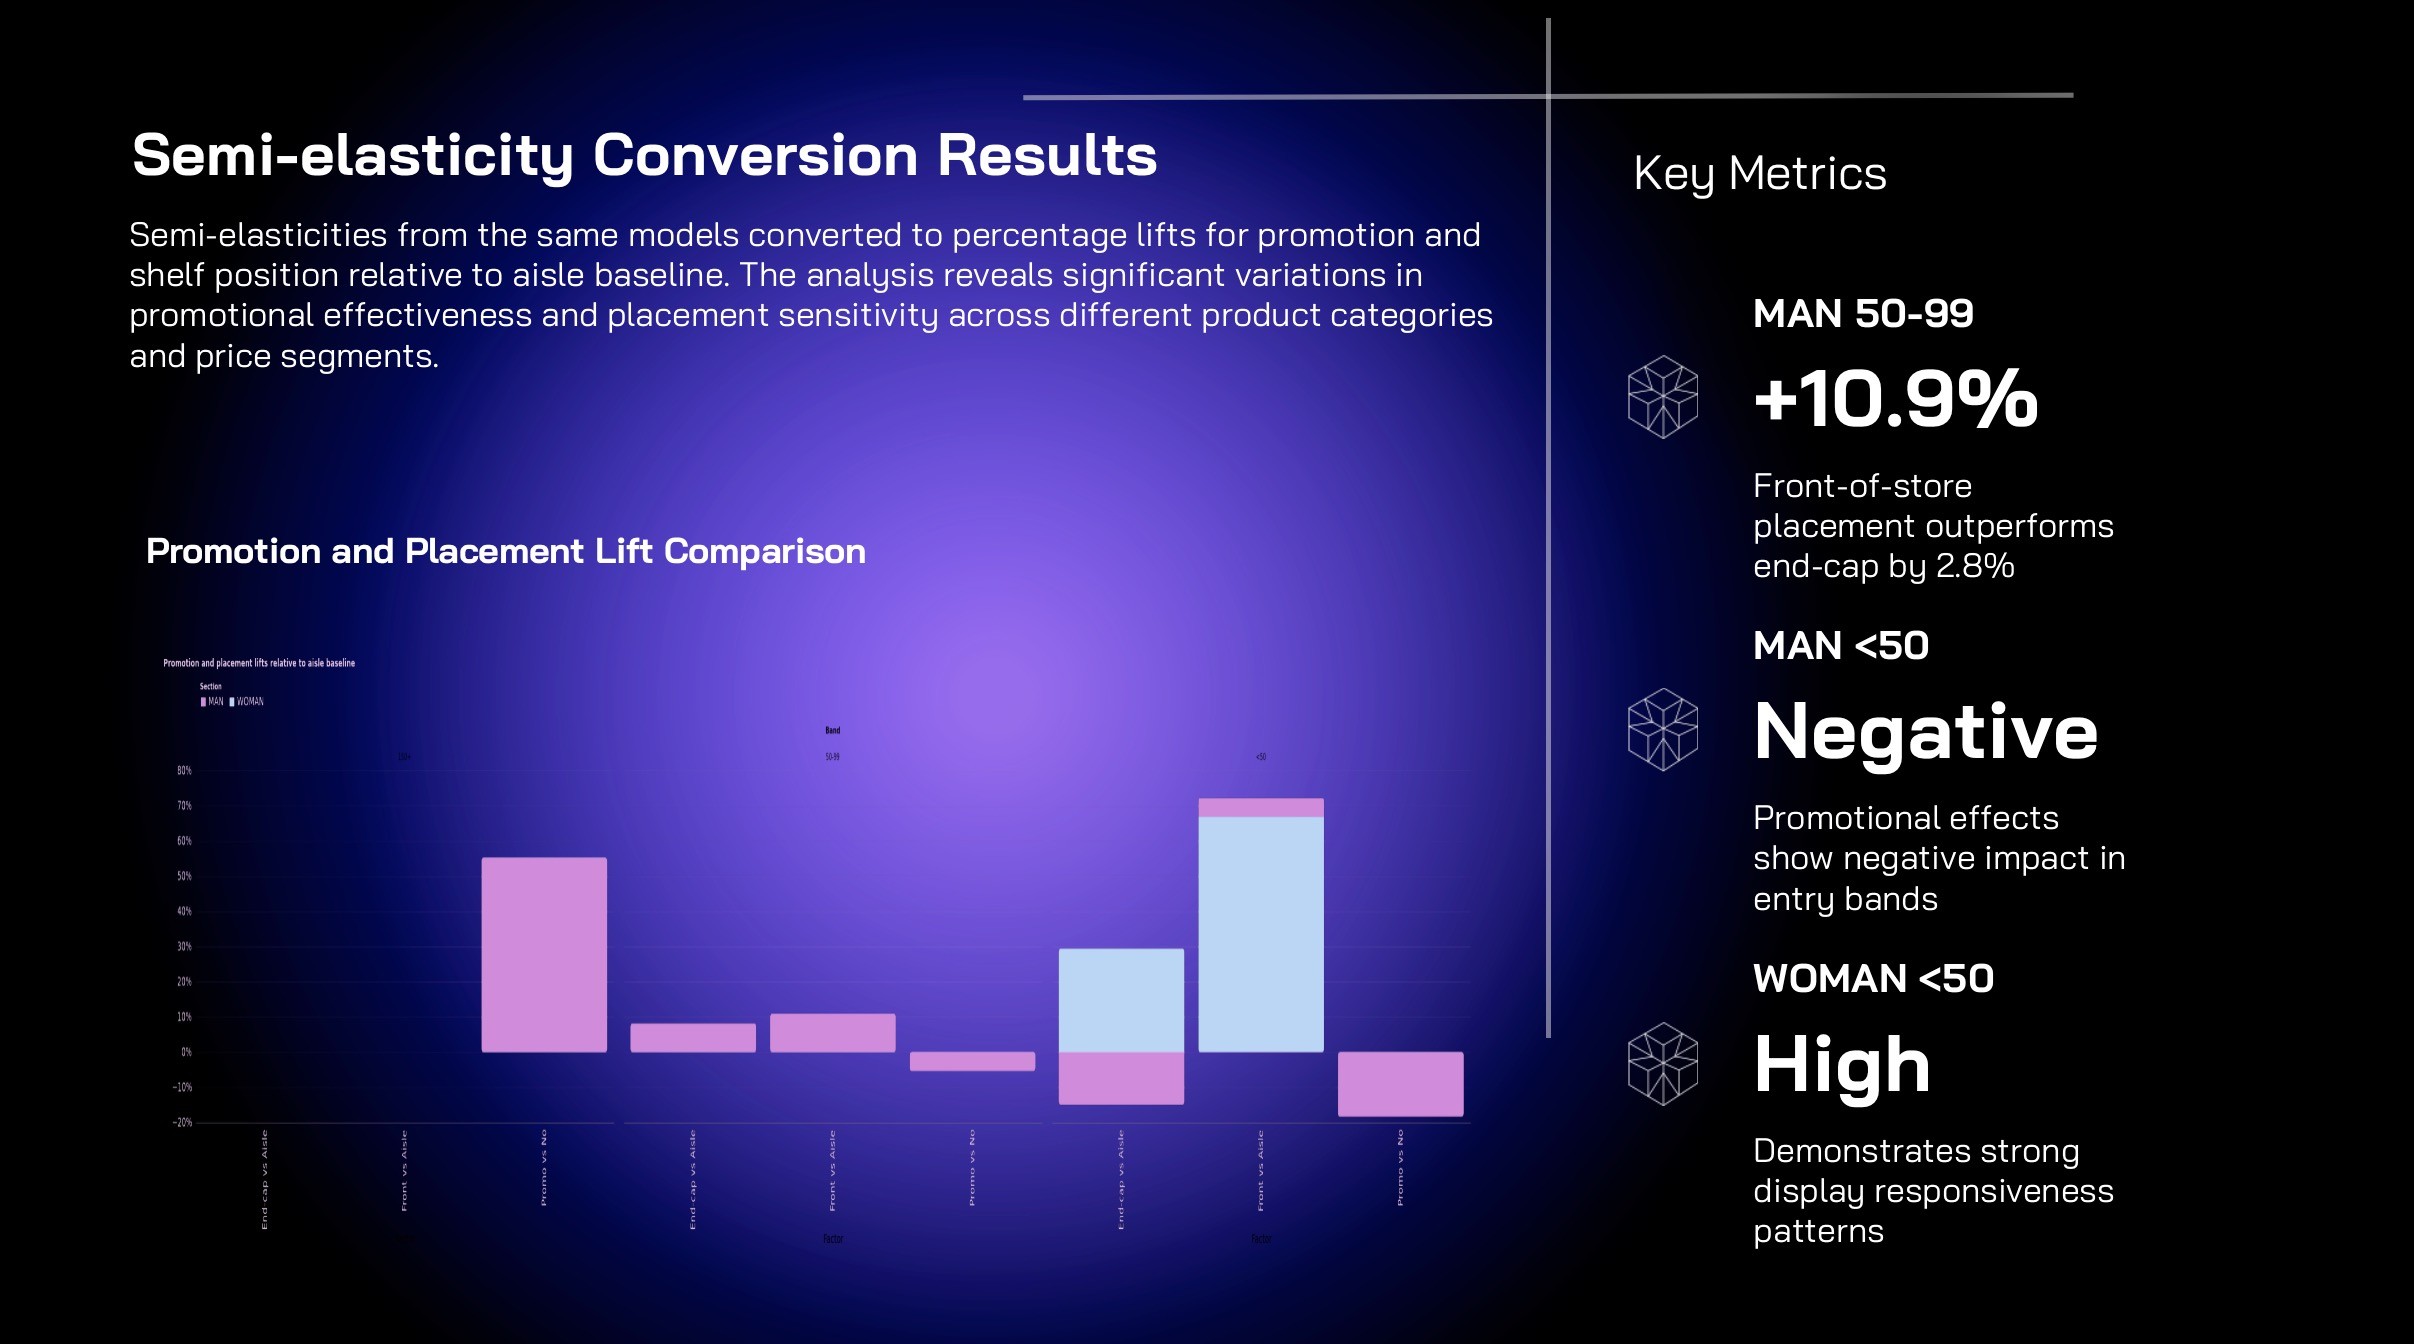
For the 50–99 band, Bloom quantified uplift by placement: Front-of-store +10.9% vs End-cap +8.1%, showing display location’s impact on sales.
Markdown simulation showed a –7.14% revenue drop at –10% discount, emphasizing the risks of aggressive markdowns in this category.
Together, these deeper insights move the analysis from “what happened” to “what to do next.” Bloom not only highlights performance drivers but also simulates outcomes, helping teams make smarter decisions around placement, promotions, pricing, and portfolio expansion.
Step 3: Ask More
Not every area of interest is captured in the initial AI exploration. That’s where Ask More comes in. With a single click, you can raise your own questions and guide Bloom toward the topics you care about most.

For example, suppose the current analysis focused heavily on placement and price bands, but you also want to understand:
How seasonality affects sales across men's and women's categories.
Which products deliver the highest margin contribution, not just sales volume.
How store promotions interact with pricing to influence uplift.
By clicking Ask More, you can type or select questions directly, and Bloom will generate tailored insights on demand.
Let's try the first one to see what you can get from Bloom.
After the analysis is complete, click "View" to see the details.

Step 4: Create Presentations
Once you've explored your data and uncovered meaningful insights, the next step is sharing them with your team. Powerdrill Bloom makes this effortless by allowing you to save your favorite insights and turn them into ready-to-present slides.
Here's how it works:
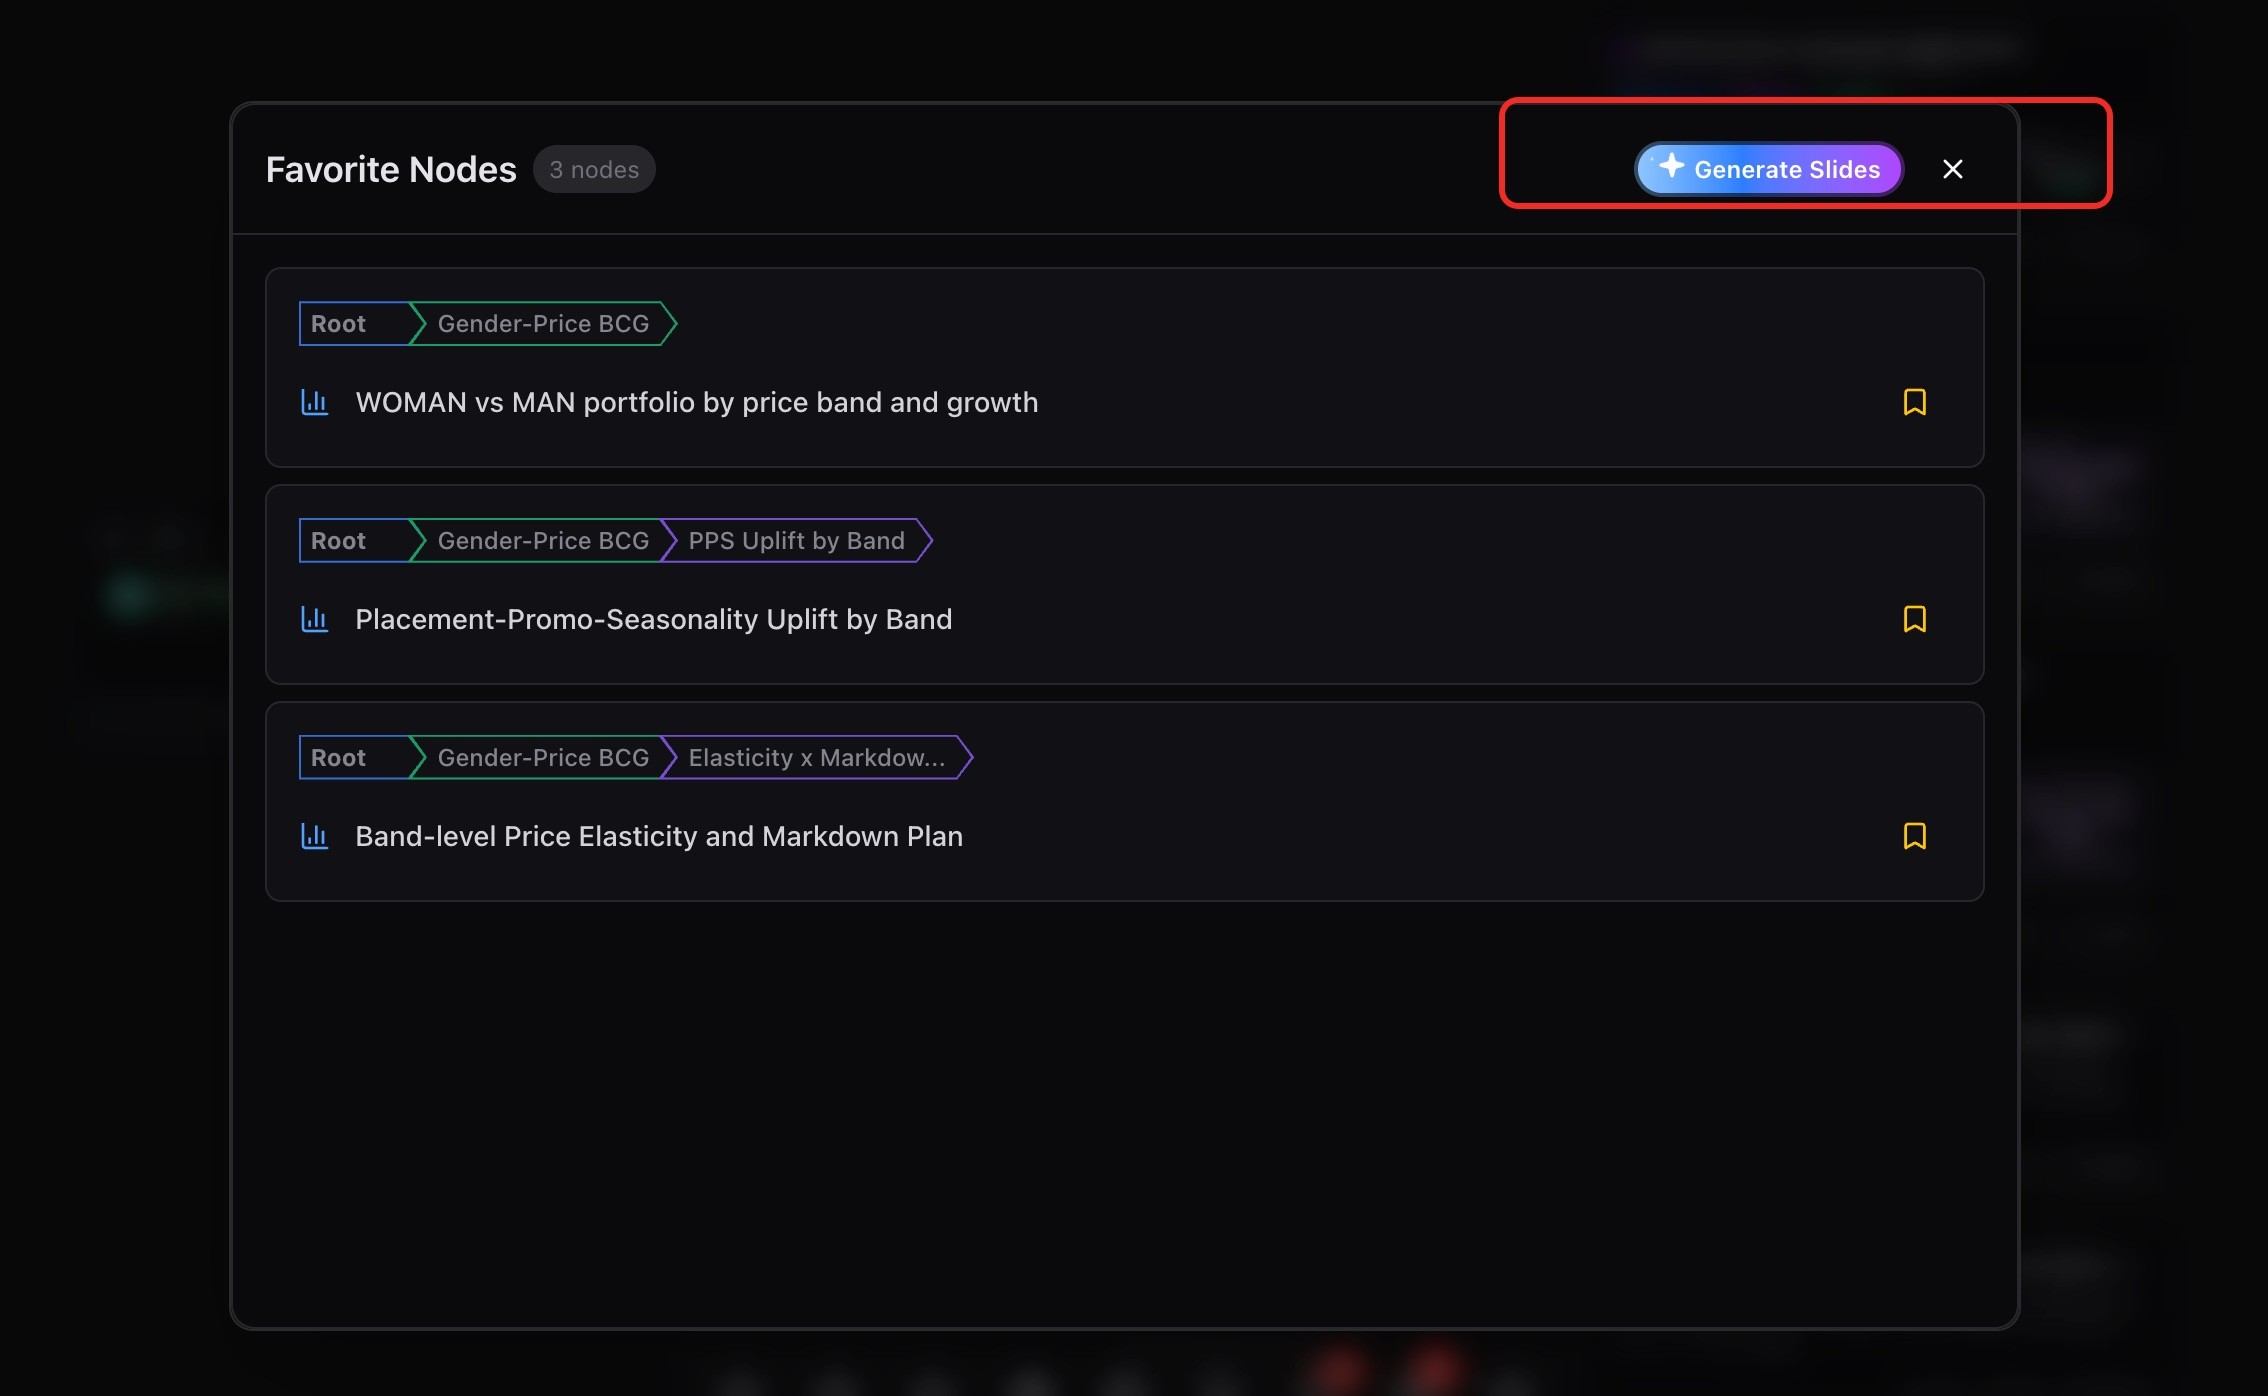
Click “Favorite” on each card you’d like to include in your presentation.
Open “Favorite Nodes” at the bottom of the screen.
Select “Generate Slides.”
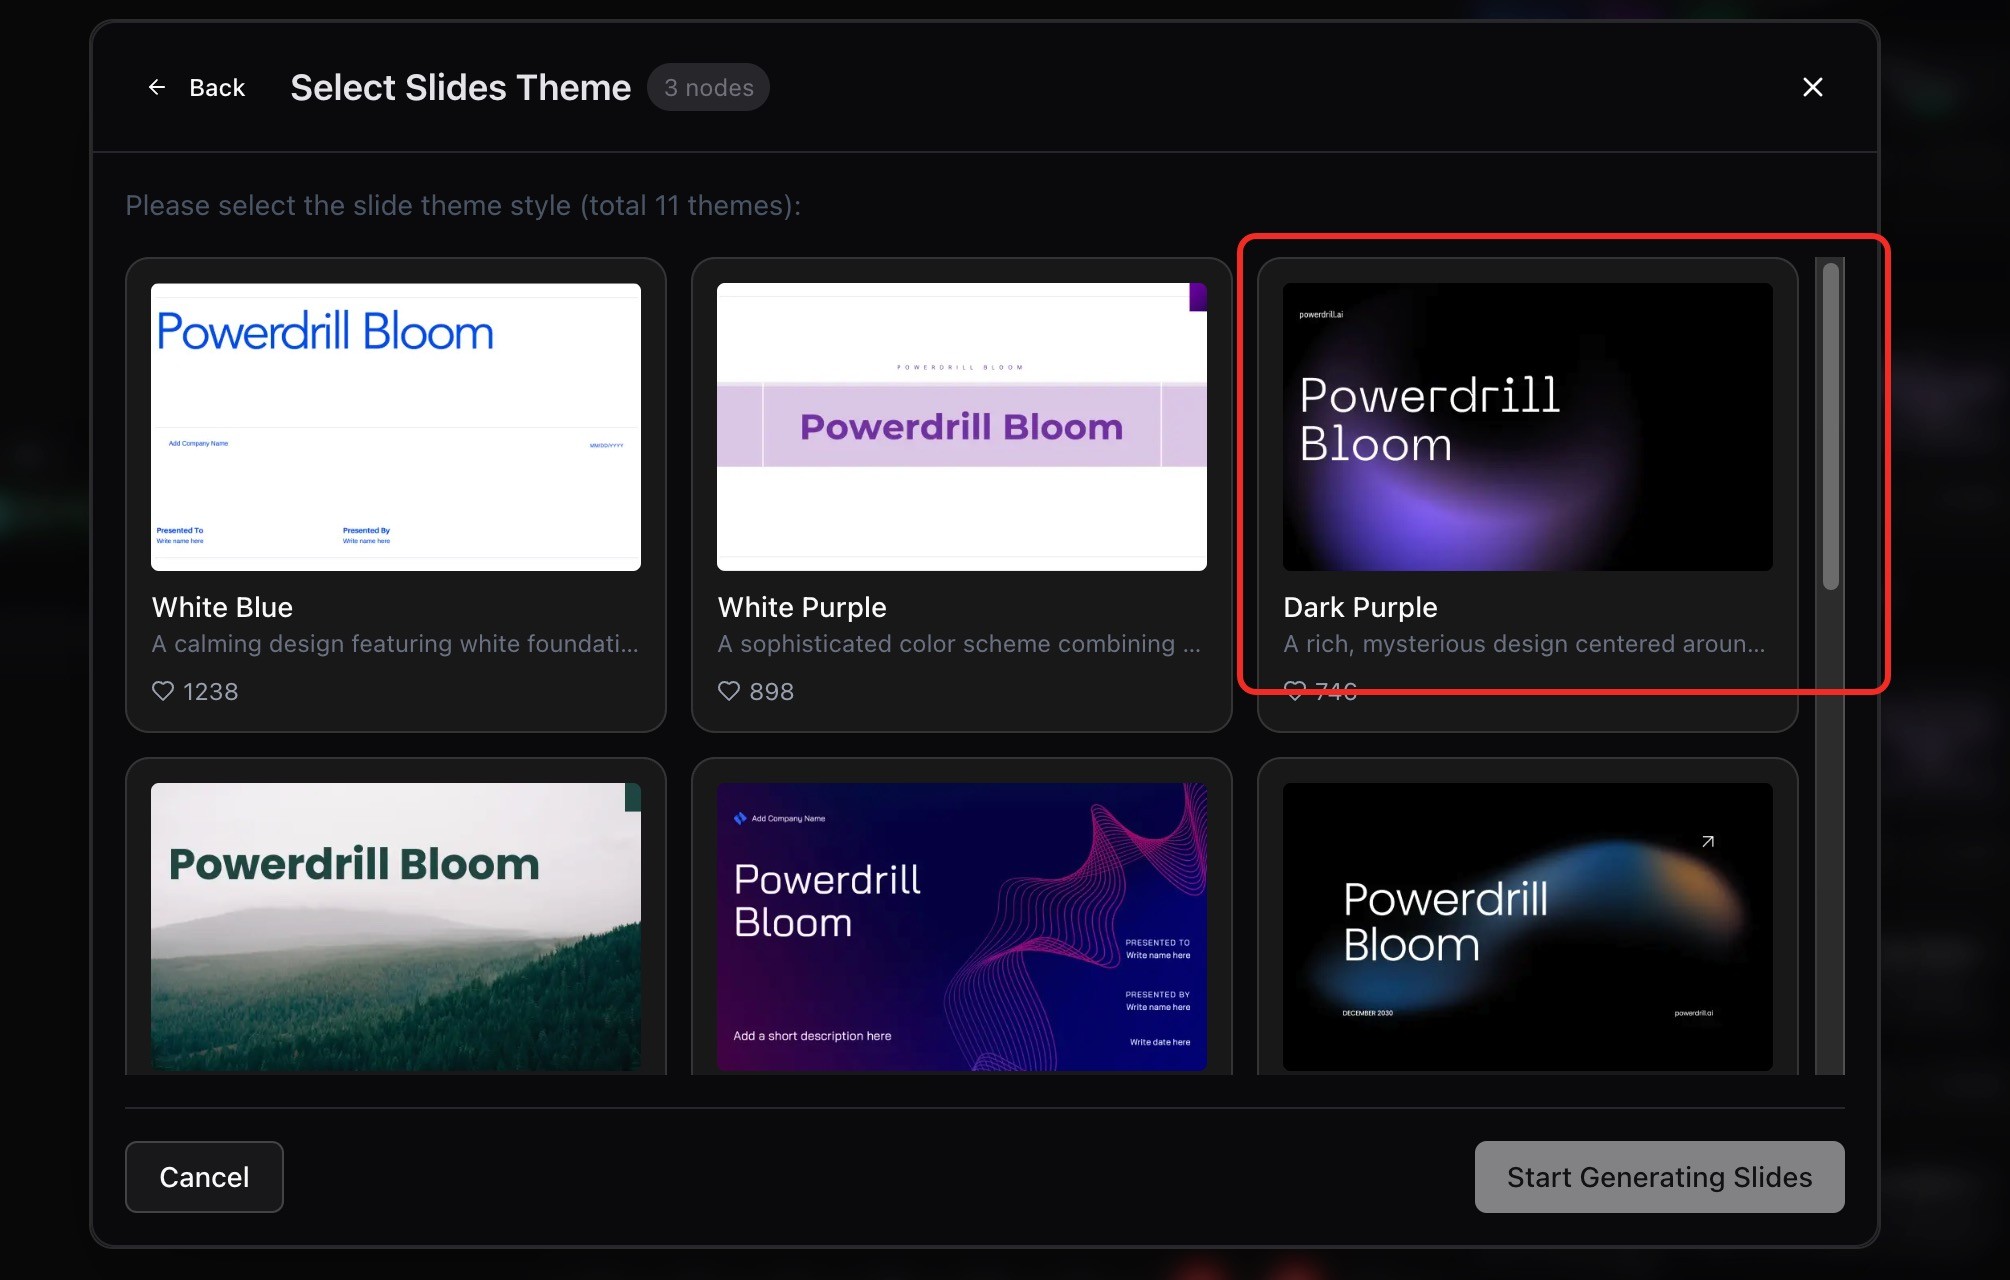
Choose the nodes you want to add and click “Next.”

Pick a PPT theme and click “Start Generating Slides.”
Once the deck is generated, simply go to “Slides Generation” at the bottom to download your presentation.
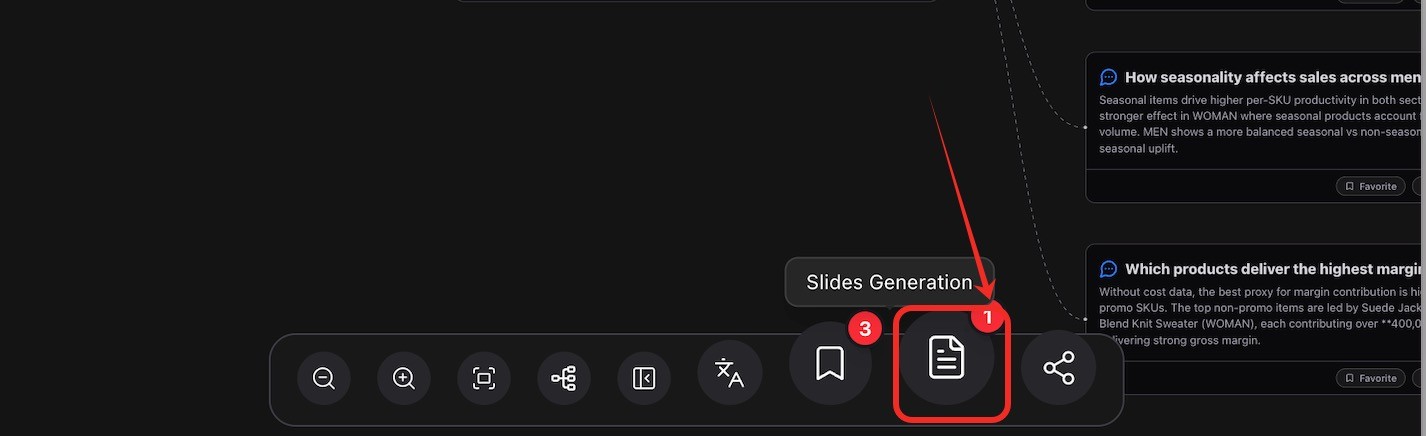
The result is a polished, professional slide deck — automatically built from your chosen insights.
Conclusion
Sales analysis no longer has to be a slow, manual process filled with spreadsheets and static dashboards. With Powerdrill Bloom, you can upload raw data, let AI uncover insights, dig deeper into patterns, and even ask custom questions in real time. Every step — from identifying growth opportunities to testing pricing strategies — happens within a single, interactive workflow.
What makes Bloom especially powerful is how easily these insights can be shared. By saving your favorite nodes and exporting them into a presentation, you can transform complex analytics into clear, compelling stories for your team.
The Zara dataset example demonstrates how Bloom empowers businesses to:
Pinpoint growth drivers (like men’s jackets in seasonal placements).
Detect competitive advantages (such as WOMAN outperforming in mid-tier pricing).
Simulate pricing and promotion strategies with measurable ROI impact.
Translate findings into action-ready presentations.
In short, Powerdrill Bloom turns sales data into strategy — helping retailers and business leaders make smarter, faster, and more confident decisions.


