How to Categorize Data in Excel in One Click with Powerdrill
Ma Li, Flora
Dec 23, 2024
Introduction
Categorizing data in Excel is a fundamental task for efficient data management and analysis. It enables users to navigate vast datasets, simplify searches, and create compelling visuals such as charts and graphs. However, traditional methods of categorization often involve tedious manual efforts, which can lead to errors and fatigue. Fortunately, with Powerdrill’s AI-powered capabilities, data categorization becomes a seamless and highly efficient process. In this blog, you’ll learn how to categorize Excel data quickly and accurately using Powerdrill.
Understanding Data Categorization in Excel
What is Data Categorization?
Data categorization in Excel refers to organizing and classifying raw data into meaningful groups based on specific criteria. For instance, a dataset containing customer feedback can be categorized into themes such as product quality, customer service, or user experience. Categorized data facilitates better analysis, making it easier to identify trends and generate actionable insights. If you're just getting started, learning how to categorize in Excel can provide a solid foundation before diving into more advanced tools.
Popular Tools for Data Categorization
Several tools are available to assist with data categorization, including:
Microsoft Excel: Excel’s built-in tools like filters and pivot tables offer basic categorization functionalities. However, they often require manual setup and can be time-consuming for large datasets.
Powerdrill AI: A robust, AI-powered tool designed for advanced data analysis. Powerdrill automates the categorization process using machine learning algorithms, significantly reducing manual effort and enhancing accuracy.
Step-by-Step Guide to Categorizing Excel Data with Powerdrill
Step 1. Upload your data
The dataset used in the example is "uber_reviews_without_reviewid", a public dataset downloaded from Kaggle. It contains over 12,000 customer reviews of the Uber app collected from the Google Play Store. The reviews provide insights into user experiences, including ratings, feedback on services, and developer responses.
In this blog, we'll explore the most common areas where users express complaints.
After signing in/up to Powerdrill, go to the text box at the bottom of the homepage. Click Add Files, and select A new dataset, and drag and drop your file(s) into the dropbox.
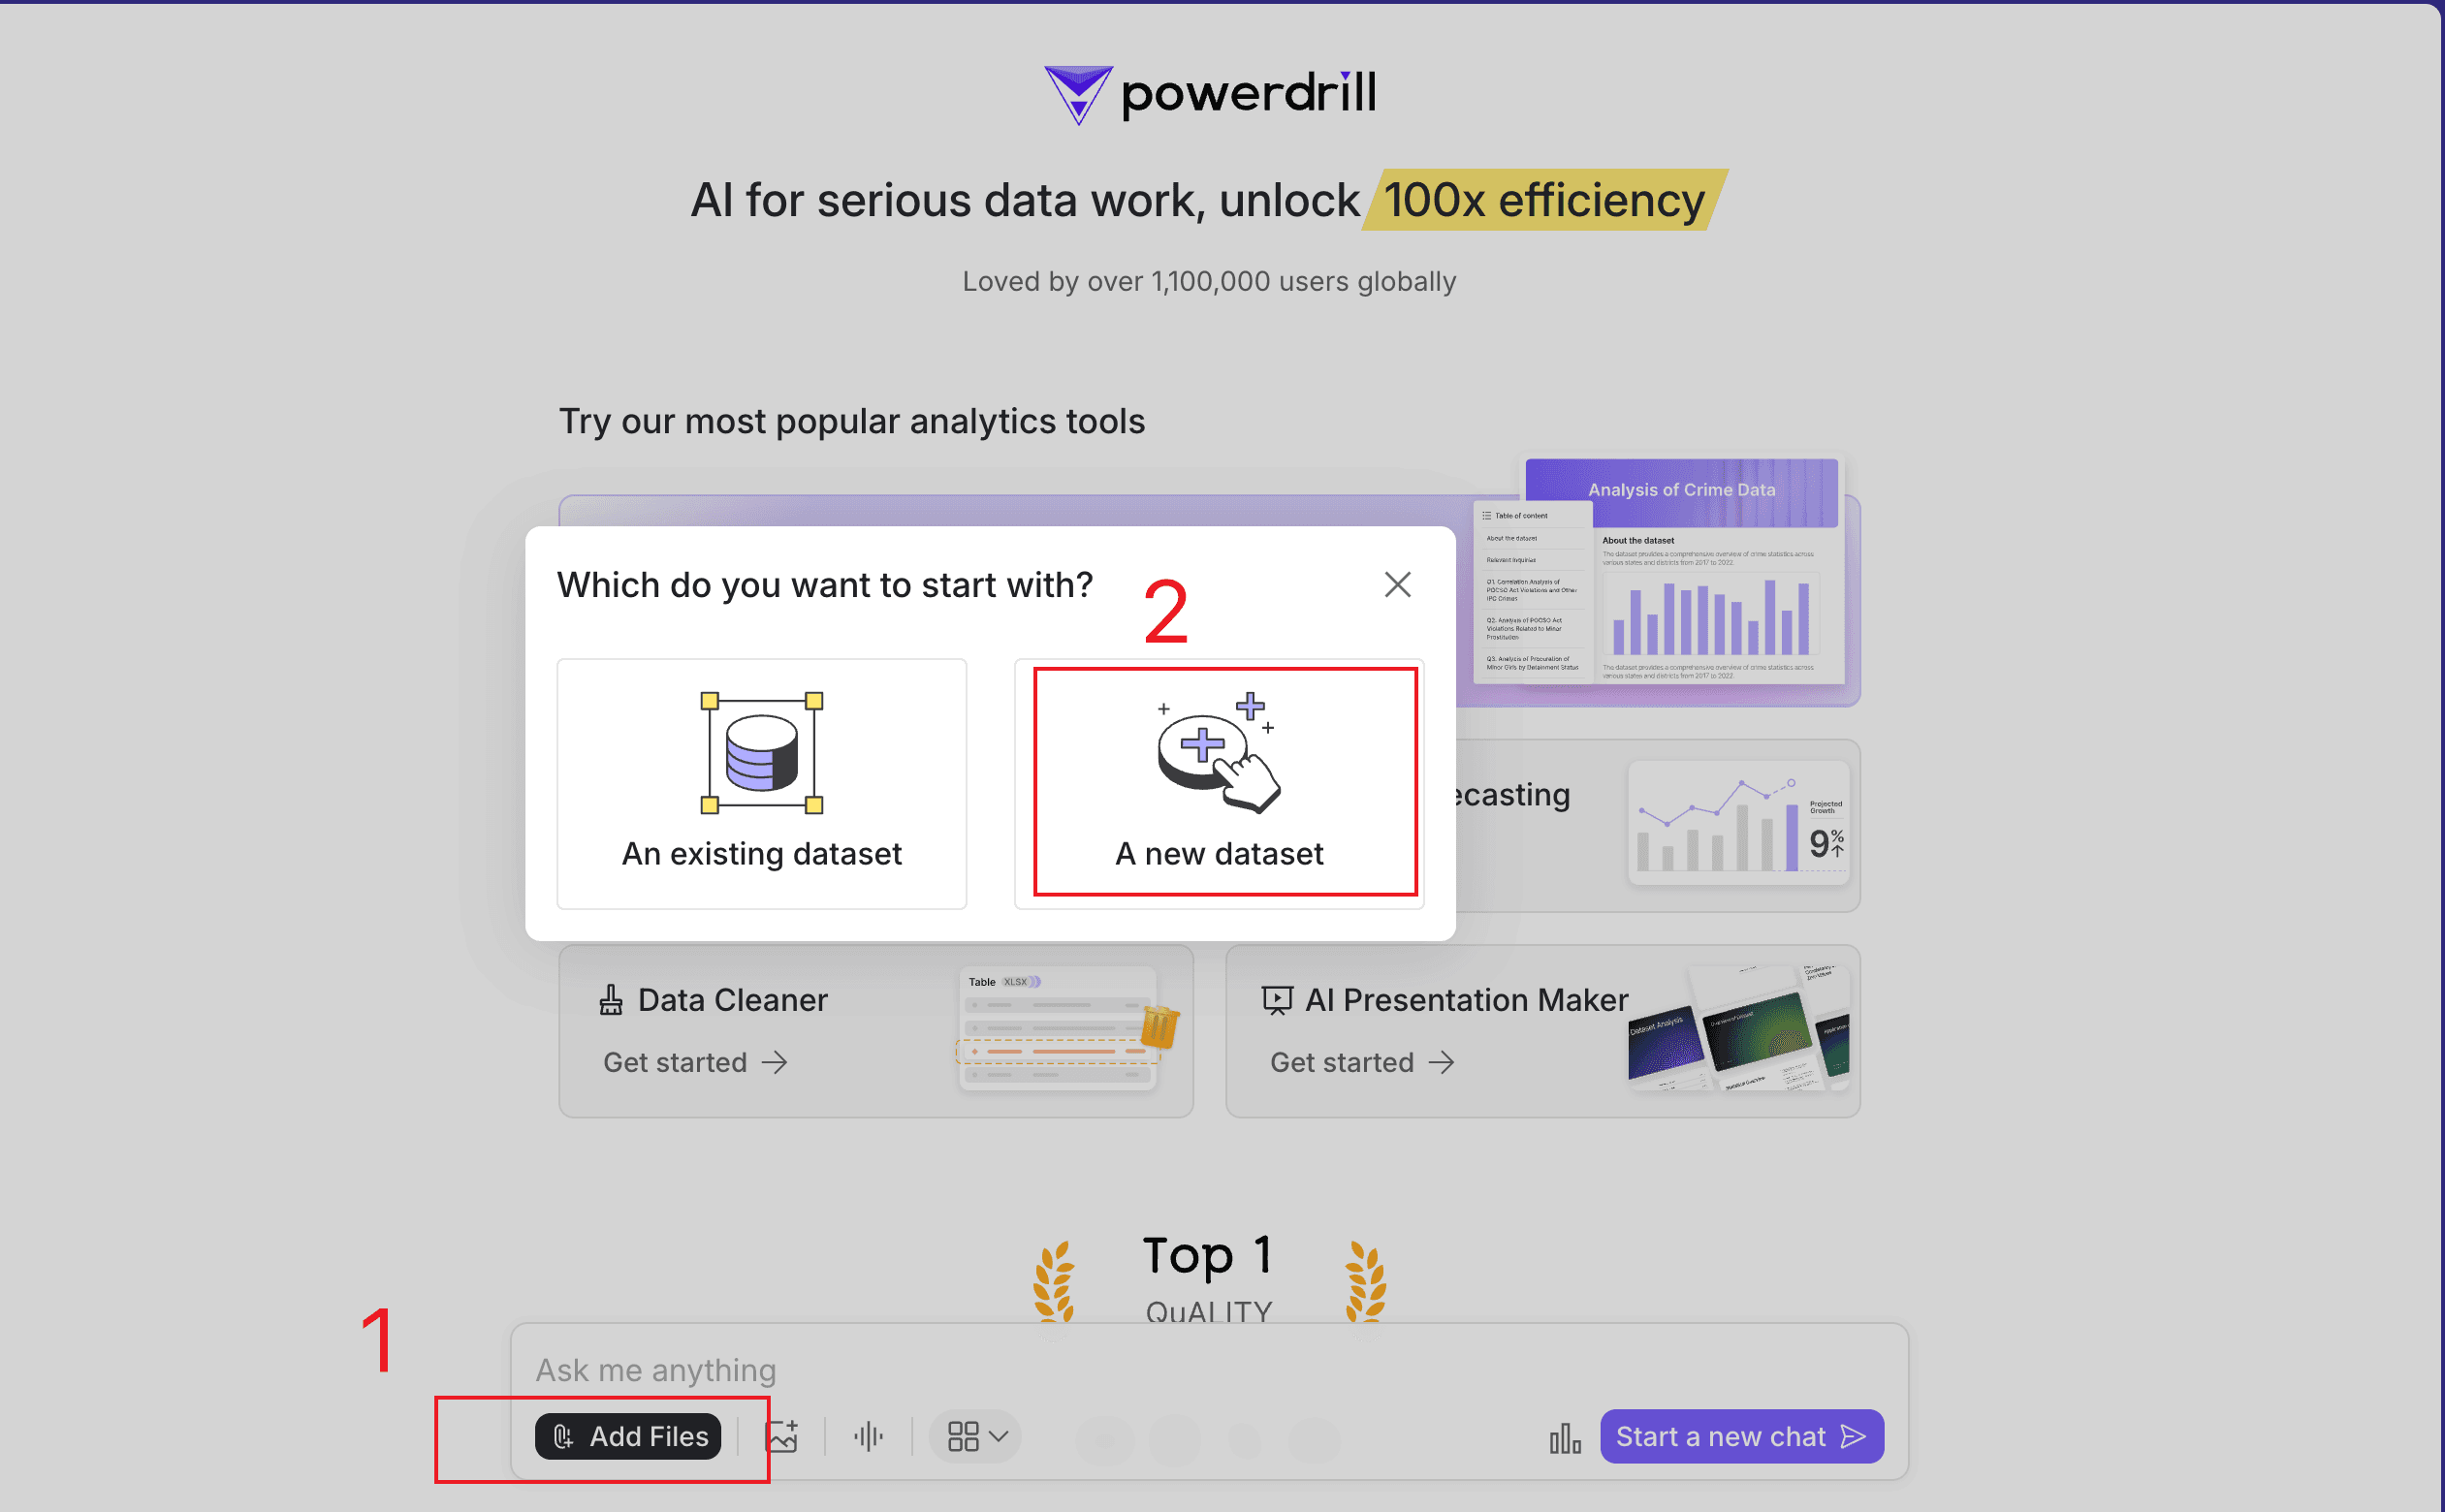
Up to 10 files can be uploaded at a time.
Step 2. Ask Powerdrill to categorize your data
Ask Powerdrill to filter negative feedback first. For example, message Powerdrill Filter by "Score" to keep only rows with values "1" or "2".
Here's Powerdrill's response.
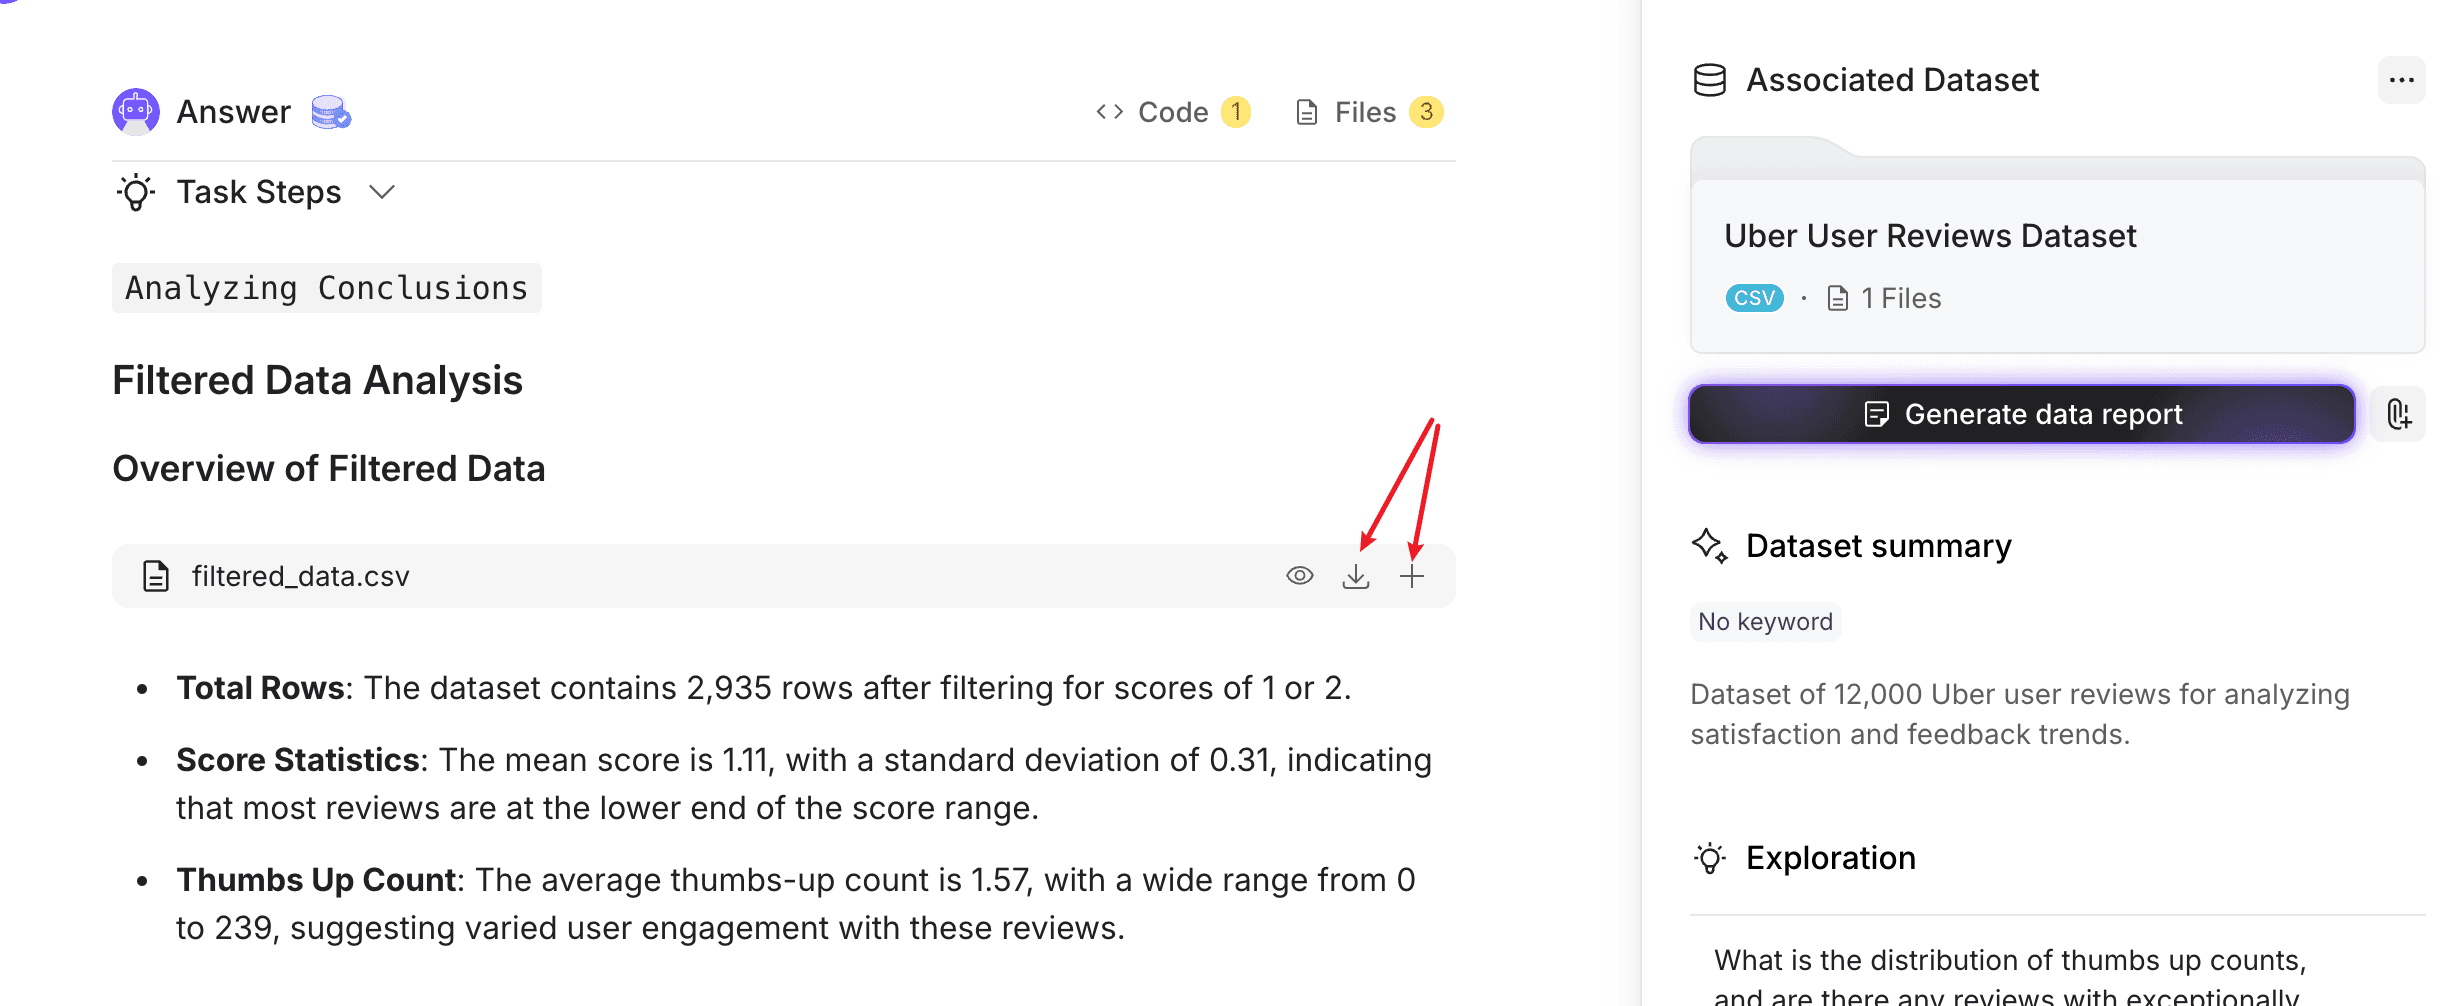
Choose to download the .csv file and create a new dataset by repeating step 1. Alternatively, simply click the + button to add it to the current dataset. Clearly, the latter option is much more convenient.
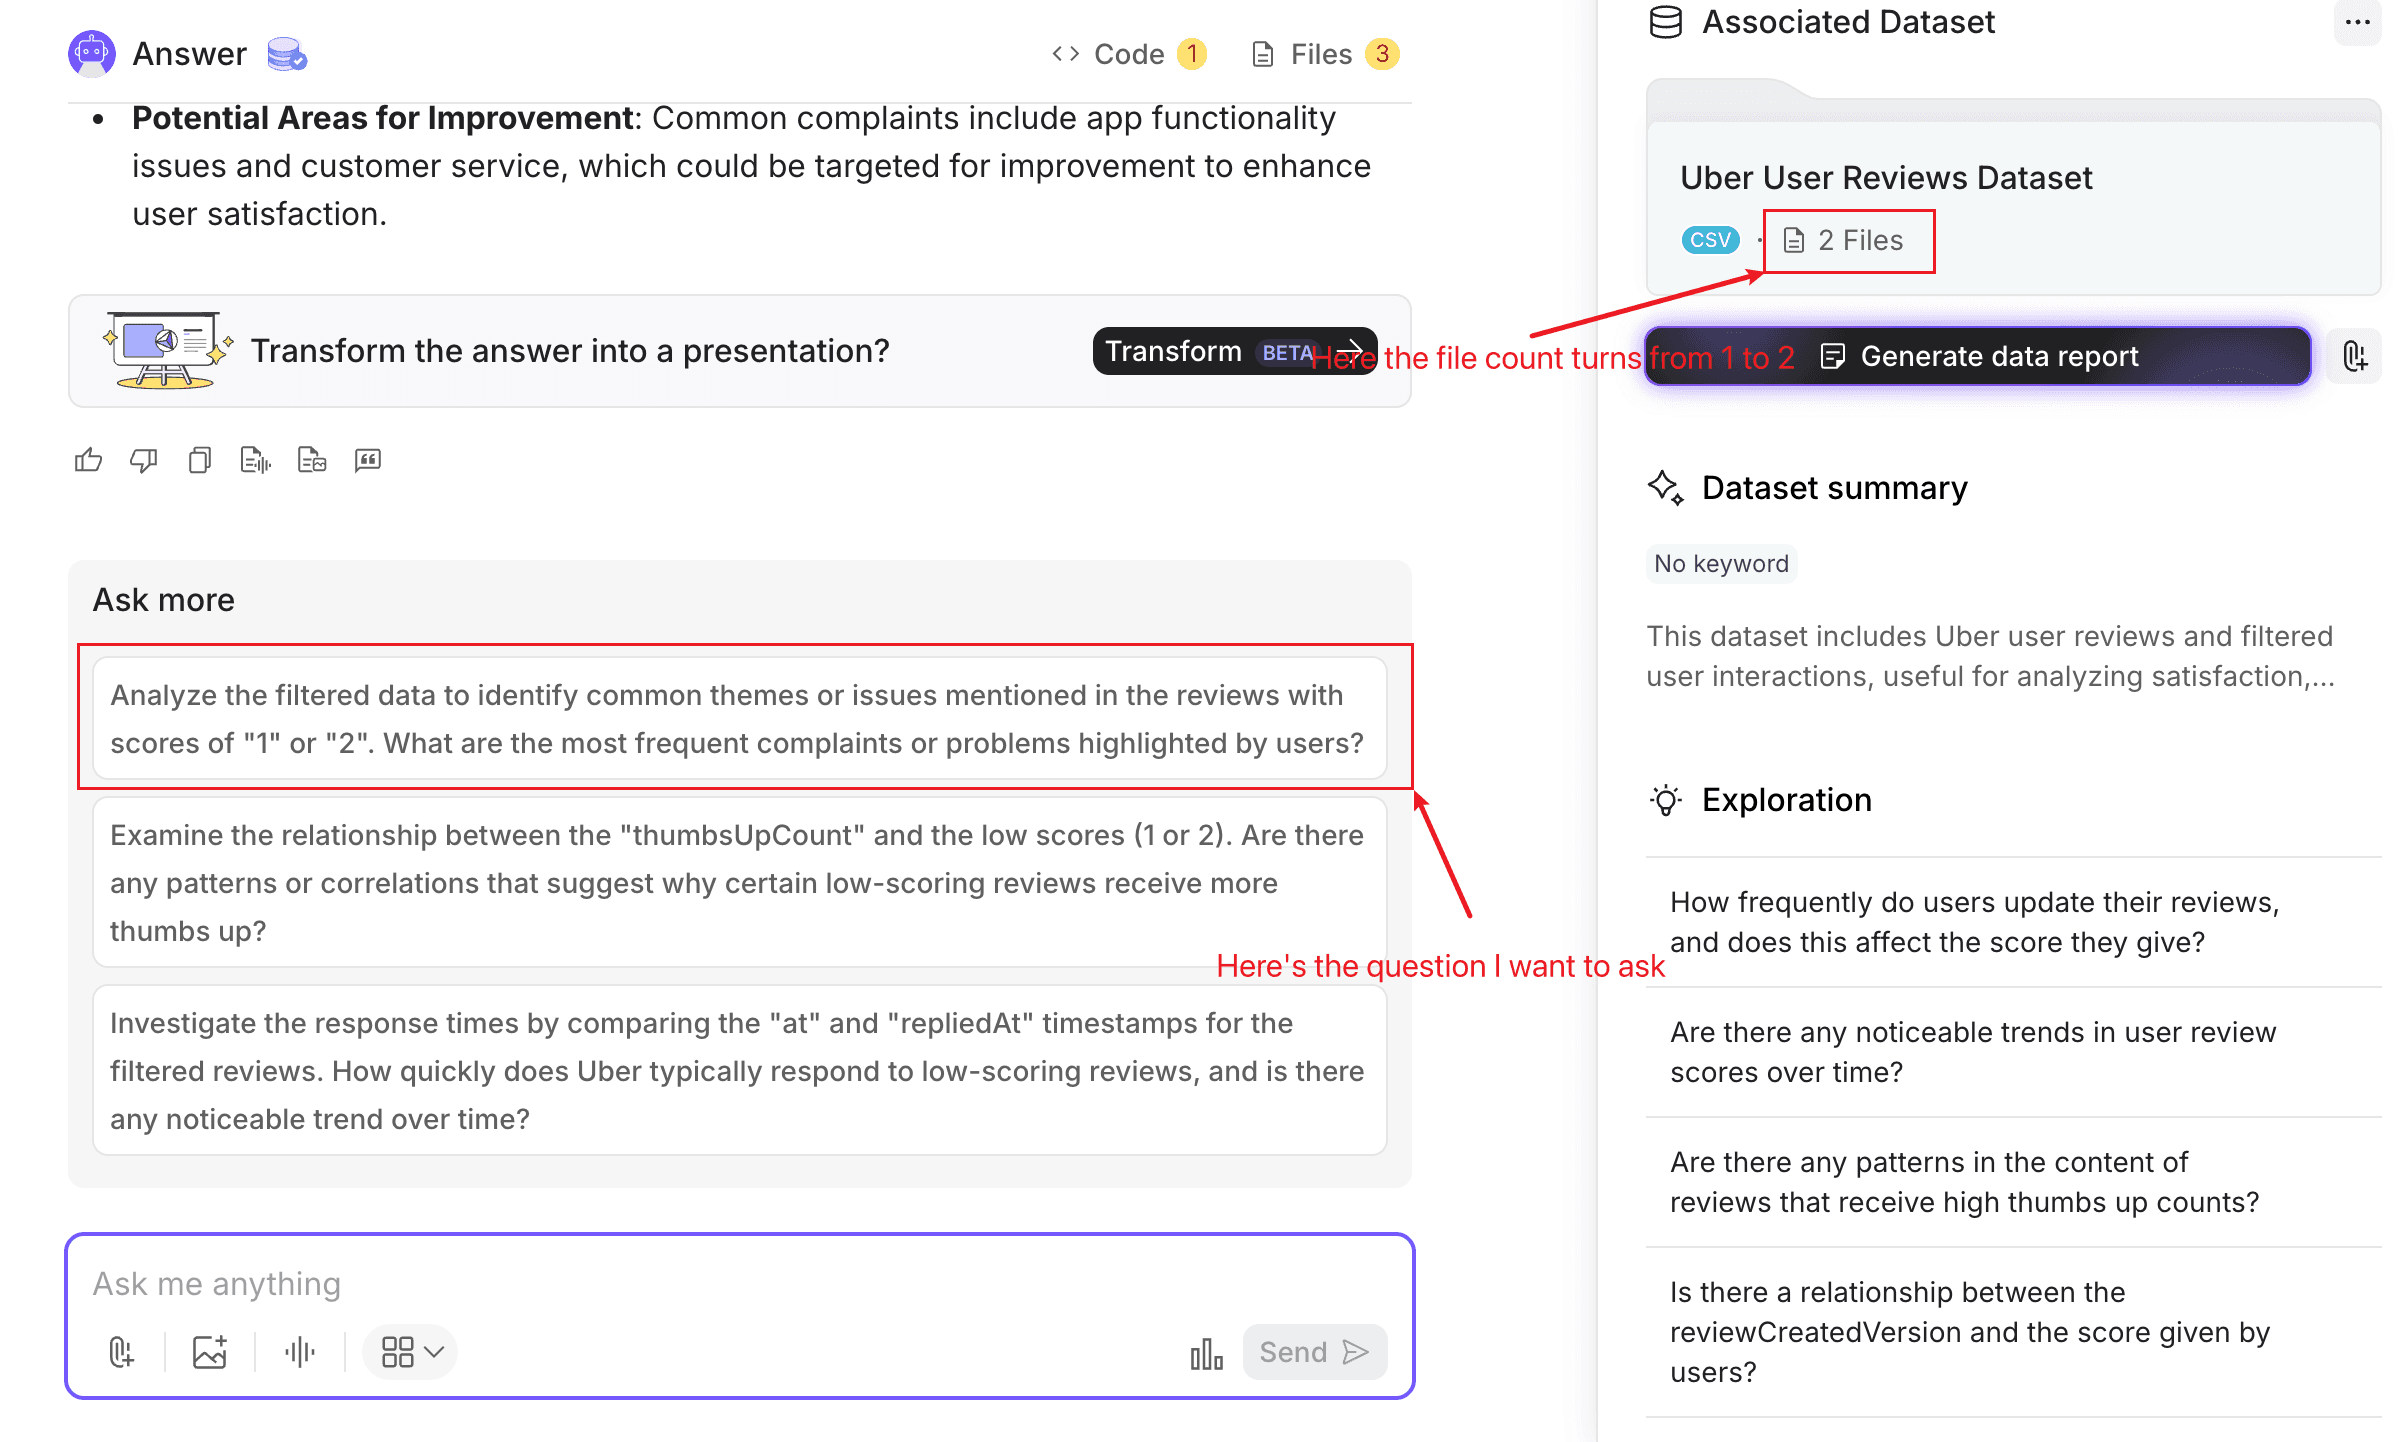
After the file is added to the dataset, the "Ask more" section displays the exact question I want to ask: I don't even need to type anything—just click the question!

Based on Powerdrill's answer, start next question:
Categorize the content in "content" from the following aspects: Uber app's functionality, ride experience, driver behavior, and service quality. For these hard to categorize, mark them as "Unknown". And then, sort them by category, and then visualize the result.
Here's the answer provided by Powerdrill:
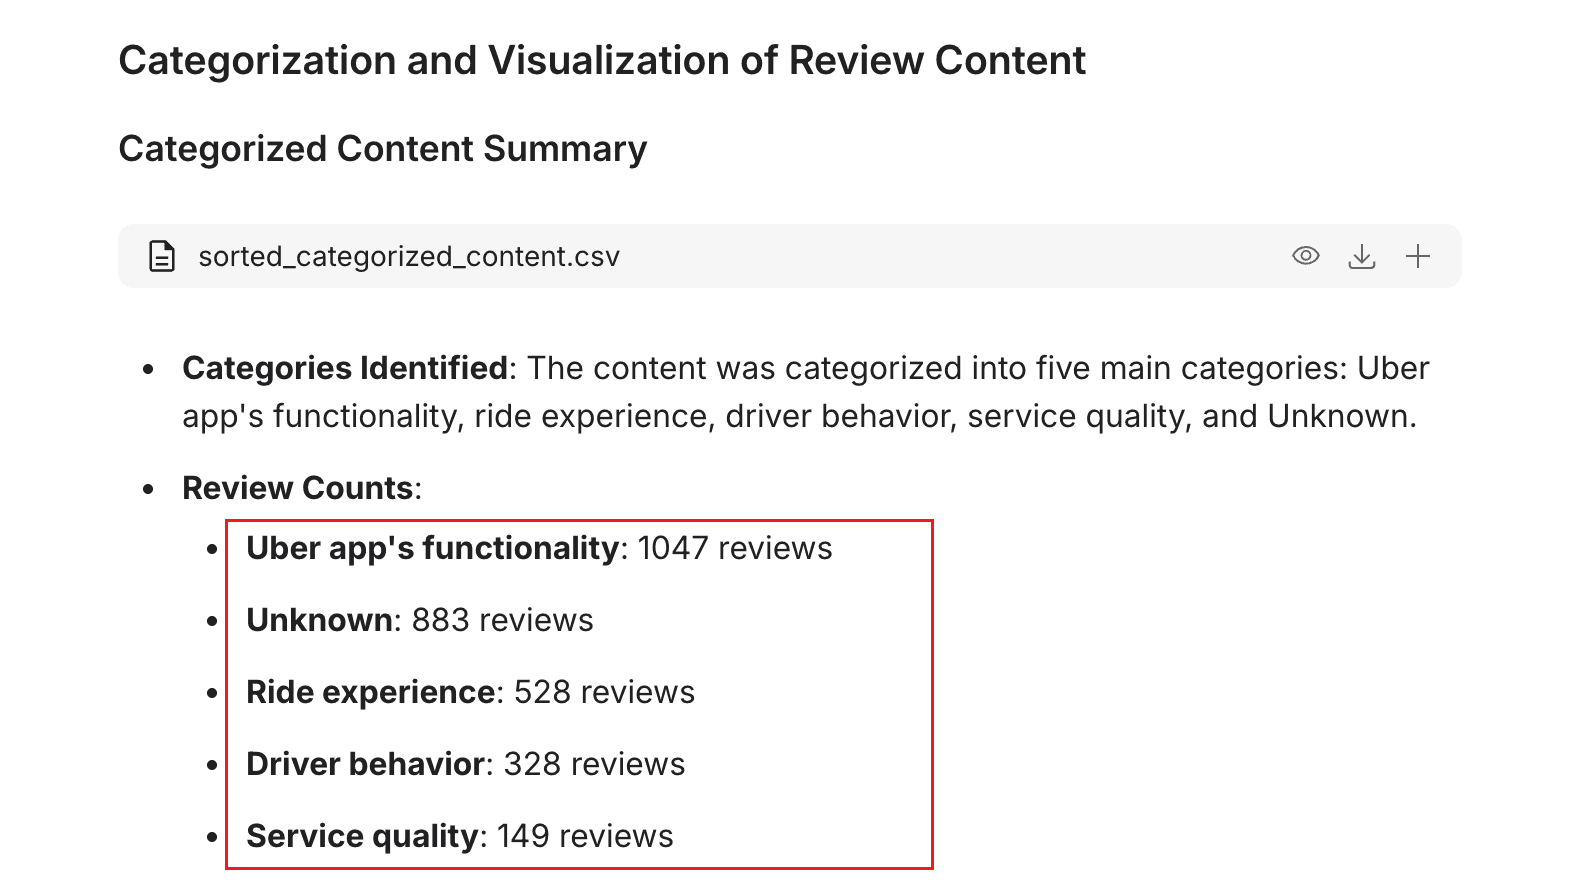
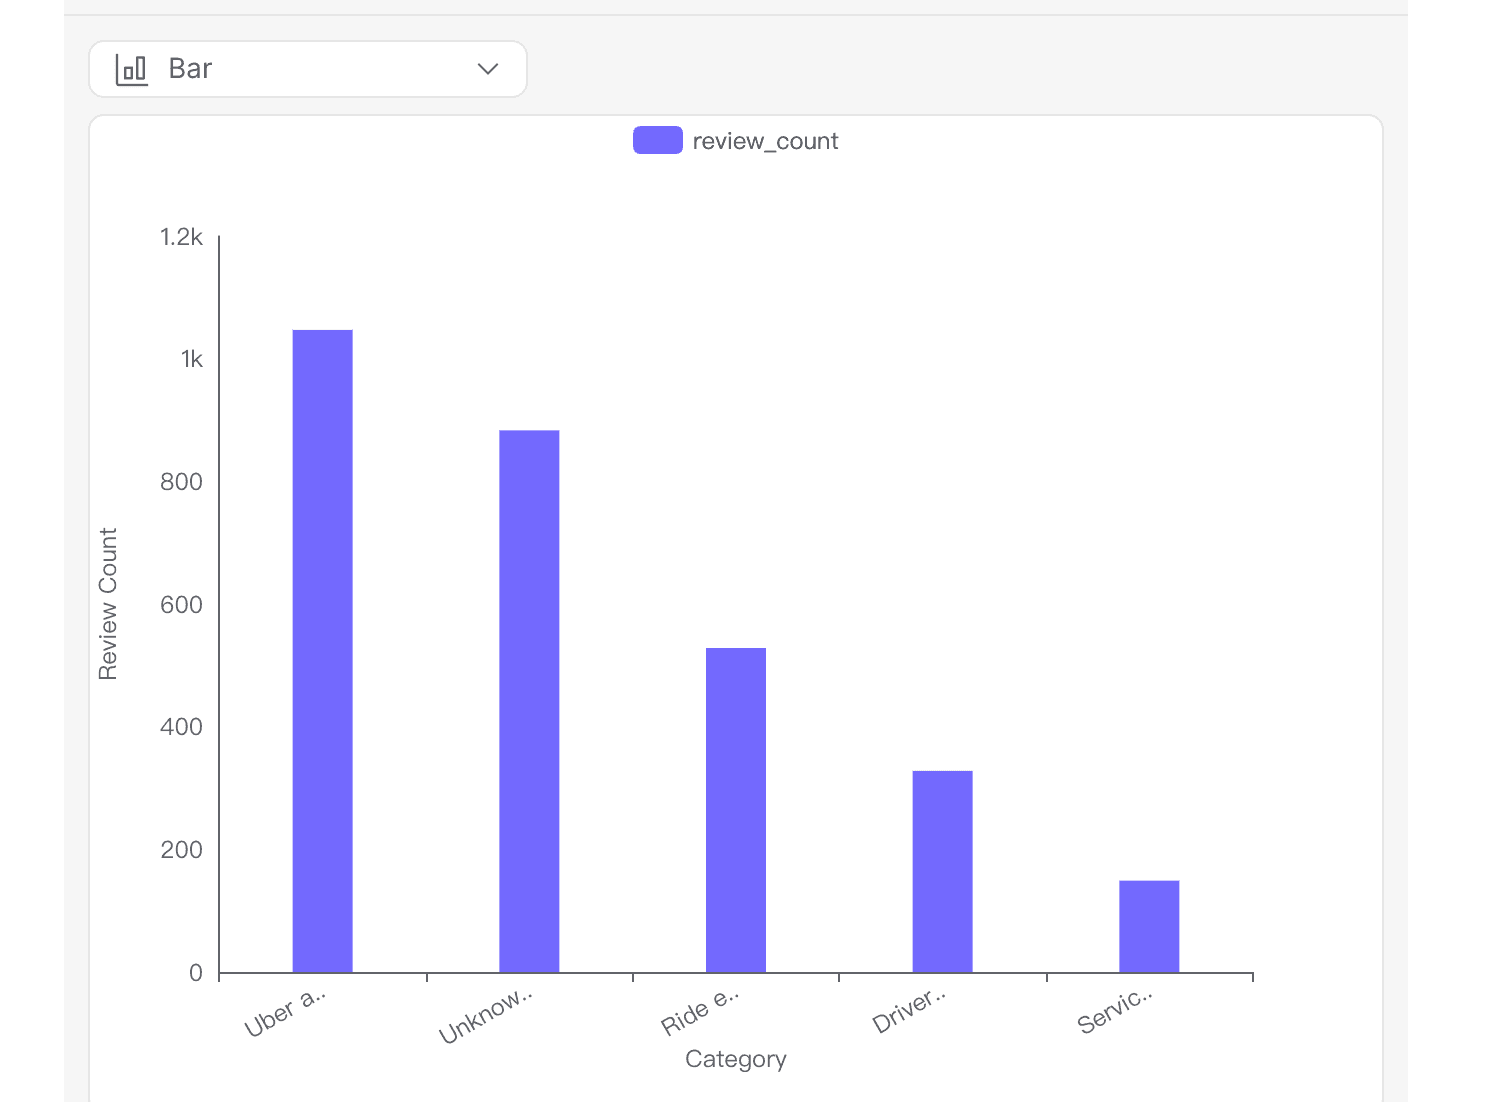
Here are the spreadsheets you can download.
If you only want to check the content categorized by type, the only file you need to download is "categorized_content."
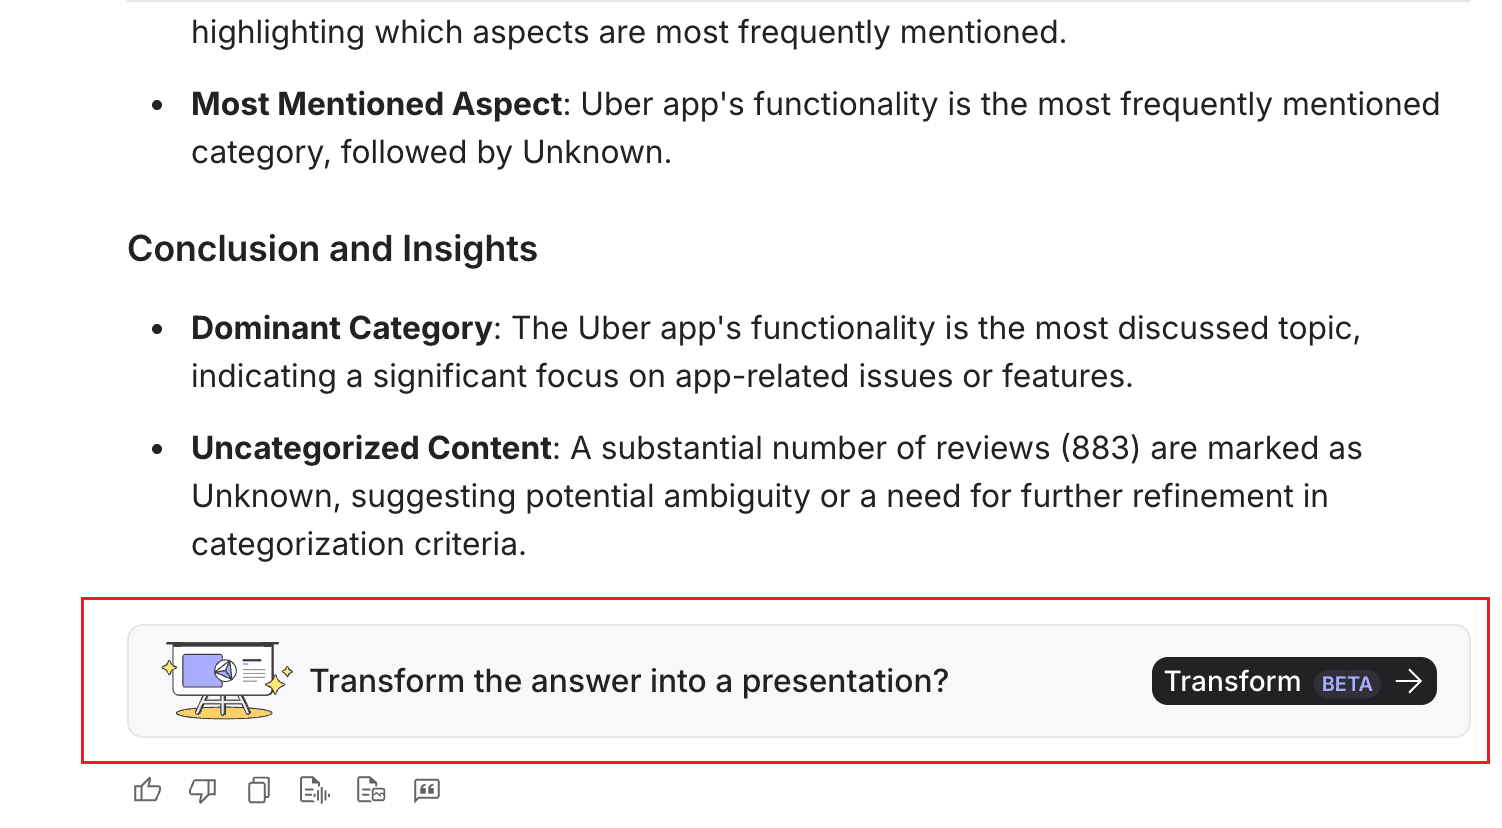
If the answer suits you need and you want to include it in your next presentation to share the insights with your teammates or anywho, the only thing you need to do is clicking "Transform"!
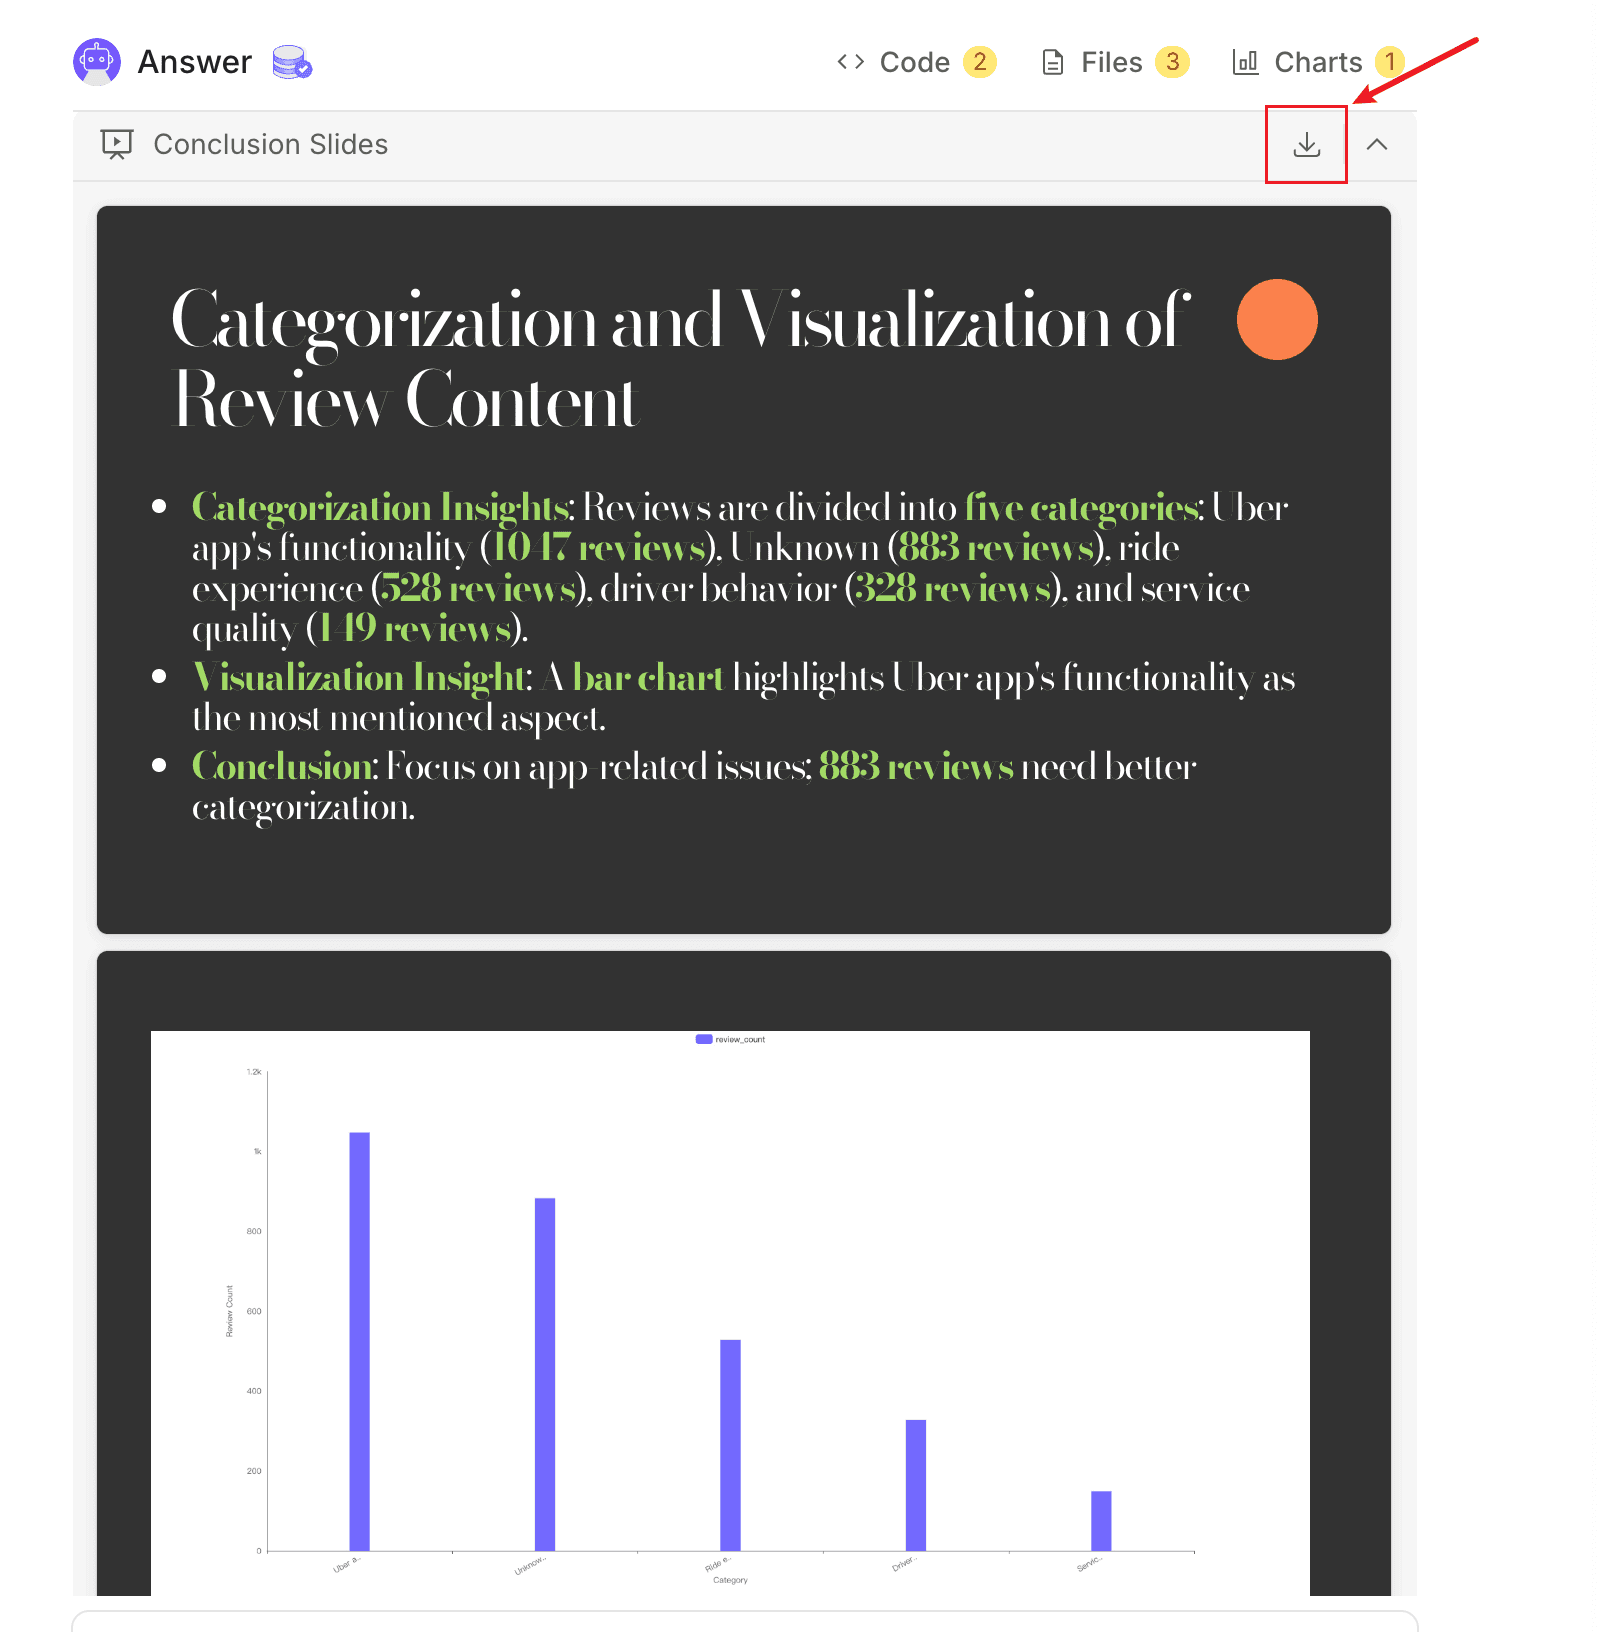
Here's the slides that can be downloaded!
FAQ
Can I categorize data in multiple Excel files at once?
Yes, Powerdrill supports simultaneous uploads and processing of up to 10 files.
What file formats does Powerdrill support?
Powerdrill works with Excel files in .xls, .xlsx, and .csv formats.
Does Powerdrill work with large datasets?
Absolutely! Powerdrill handles datasets of any size efficiently.
Final Words
Categorizing data in Excel doesn’t have to be tedious. Powerdrill’s AI-powered features make it simple to organize and analyze your data efficiently. Whether you’re working with small or large datasets, Powerdrill streamlines the process, saving you time and ensuring accuracy. Try it today and elevate your data management workflow!


