
In classrooms and virtual learning spaces worldwide, academic stress has emerged as a silent epidemic, casting a shadow over students’ mental health, academic growth, and overall well-being. From high schoolers grappling with college applications to postgraduates balancing rigorous research with tight deadlines, the pressure to perform has never been more intense—yet understanding its root causes and patterns has long been a challenge.
This dataset addresses this gap through:
Diverse participation: Captures insights from students across high school, undergraduate, and postgraduate levels, ensuring representation across key educational stages.
Open contribution model: Collected via Google Forms, with an open invitation for anyone to contribute, allowing the dataset to grow and improve over time.
Real-world relevance: Focuses on quantifying actual stressors students face, moving beyond theoretical discussions to tangible, actionable data.
Why Analyzing Academic Stress Data Matters: Benefits for Stakeholders
Analyzing this academic stress dataset isn’t just about crunching numbers—it’s about unlocking actionable insights that can drive meaningful change. Here’s how different stakeholders stand to benefit:
Educators: Gain clarity on which stressors (e.g., exam pressure, workload, or social expectations) are most impactful at each educational stage, enabling targeted adjustments to curricula, teaching methods, or support systems.
Mental health professionals: Identify trends in stress distribution, pinpoint at-risk groups, and design tailored interventions that address specific stress triggers for different student populations.
Policymakers: Access data-backed evidence to shape educational policies that prioritize student well-being, ensuring that academic standards are balanced with mental health support.
In short, this dataset, when paired with AI-driven analysis, transforms anecdotal observations into a roadmap for creating healthier, more supportive learning environments.
How to Use Powerdrill Bloom Analyze Academic Stress
Step 1: Prepare Your Fashion Market Data
Start by preparing the data you'd like to analyze. For this guide, we’ll use a public dataset from Kaggle as an example. Here are the requirements for your data:
File should be in
.xls,.xlsx, or.csvformat.Multiple files can be uploadat once, but each file must be under 20MB.
Whether you're working with e-commerce sales, product catalog info, or marketing performance data, make sure it's well-organized and ready for upload.
Step 2: Sign in to Powerdrill Bloom
Next, head over to Powerdrill Bloom to start your data-driven journey.
Visit: https://bloom.powerdrill.ai
Sign in with your email to access your workspace.
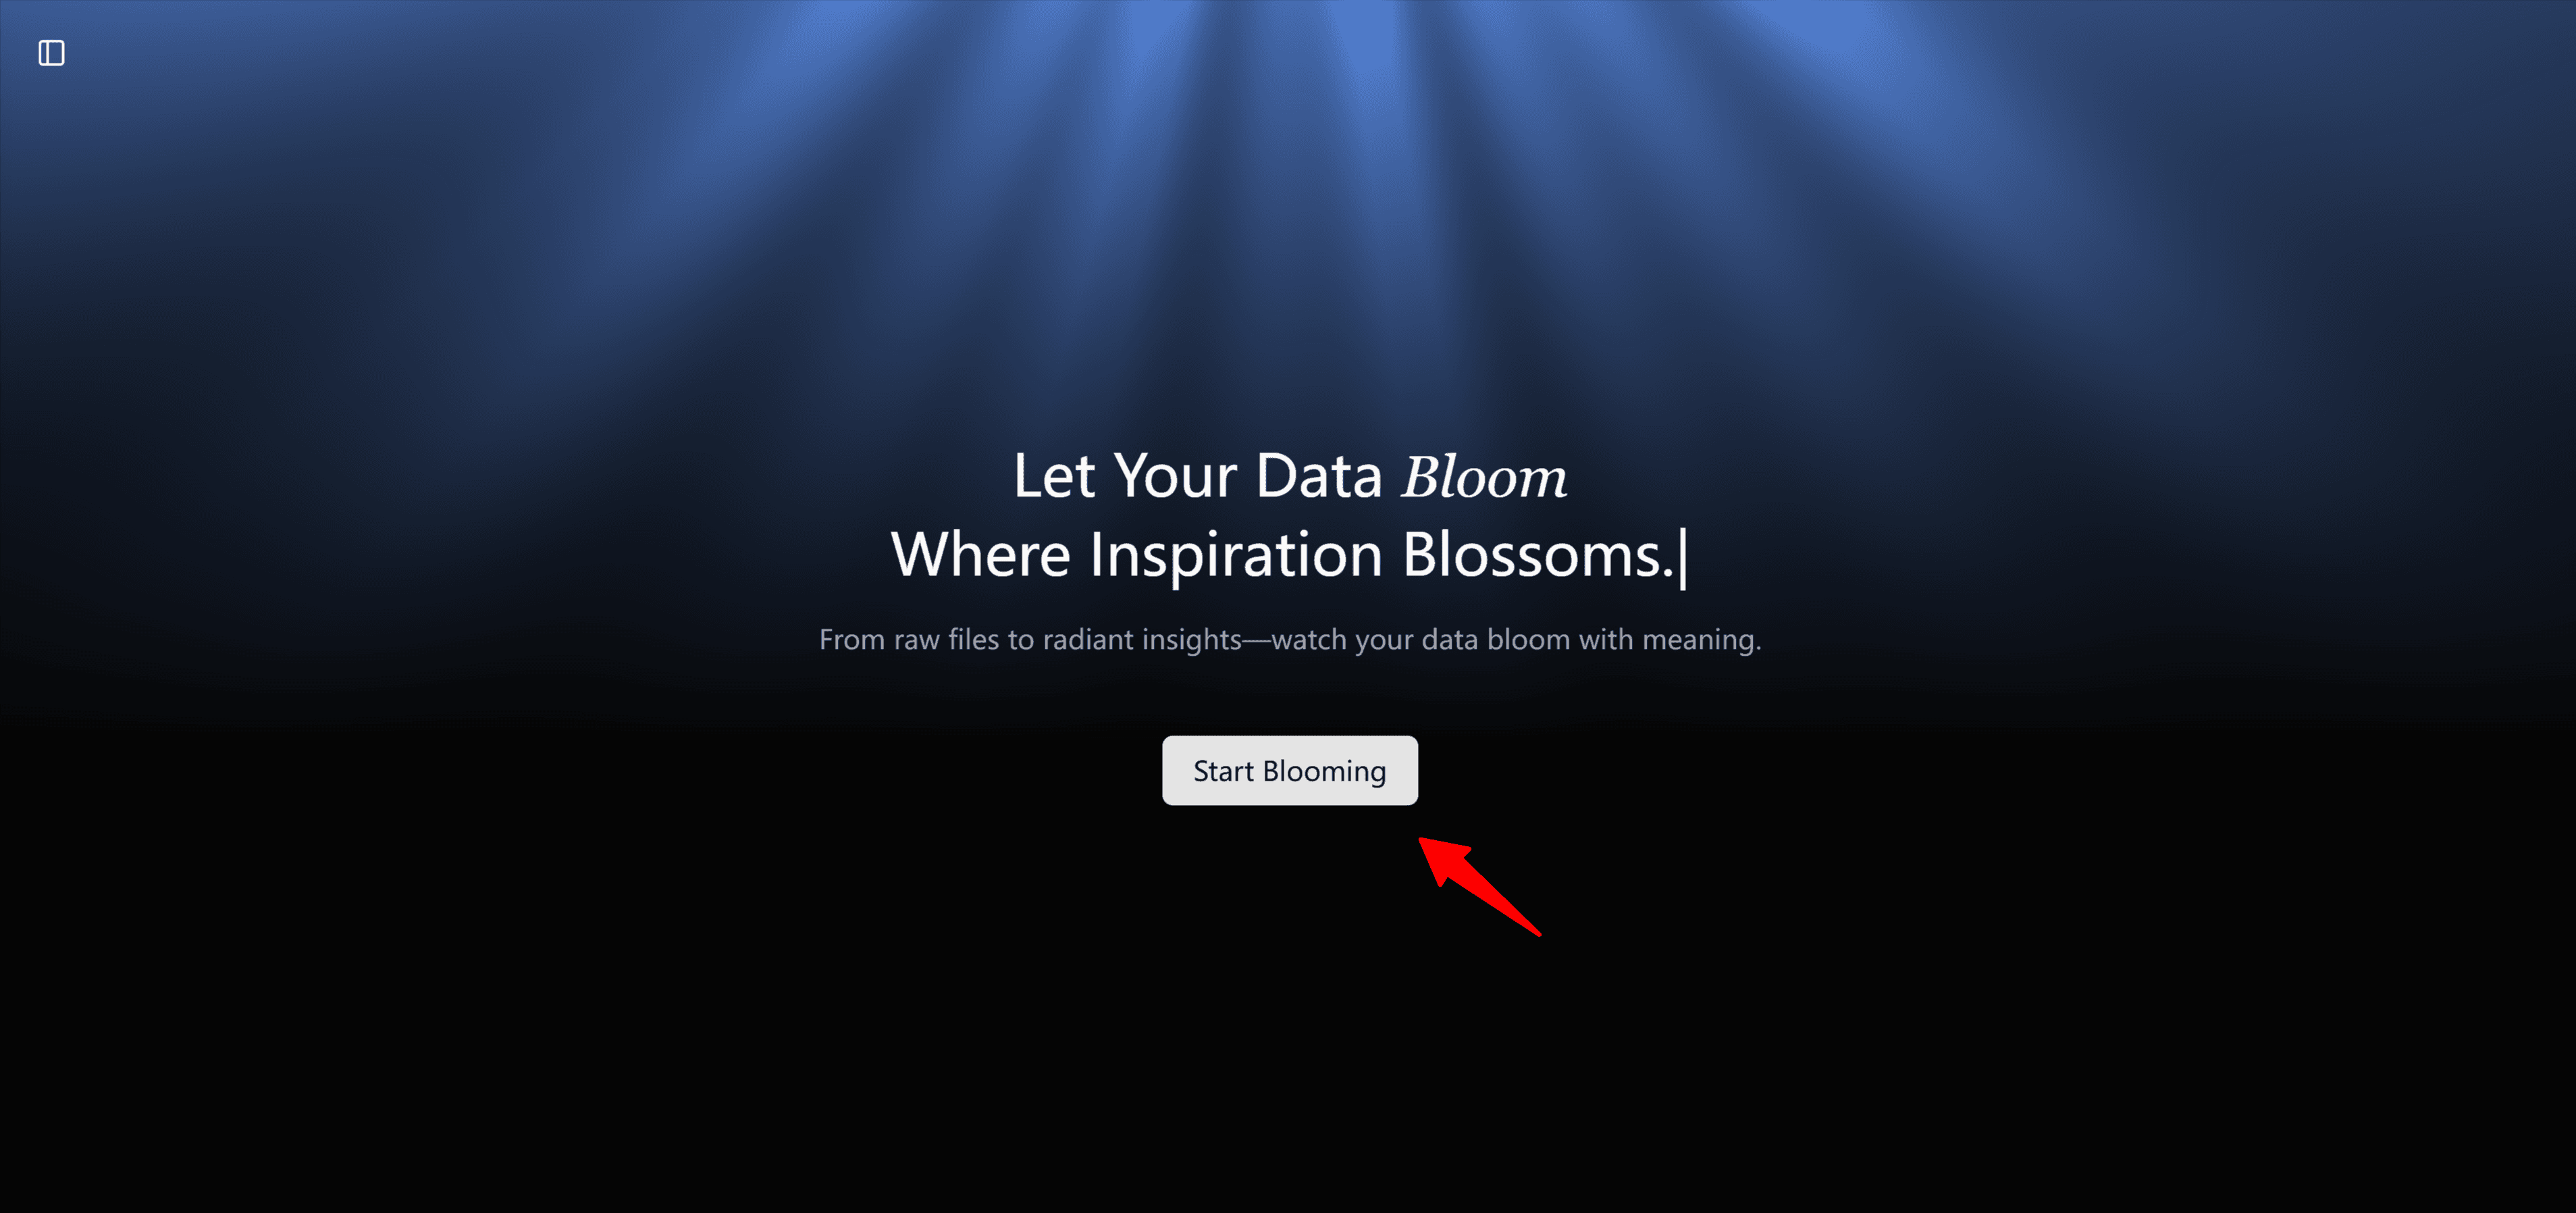
You’ll land on a clean and simple login page where you can quickly enter your credentials.
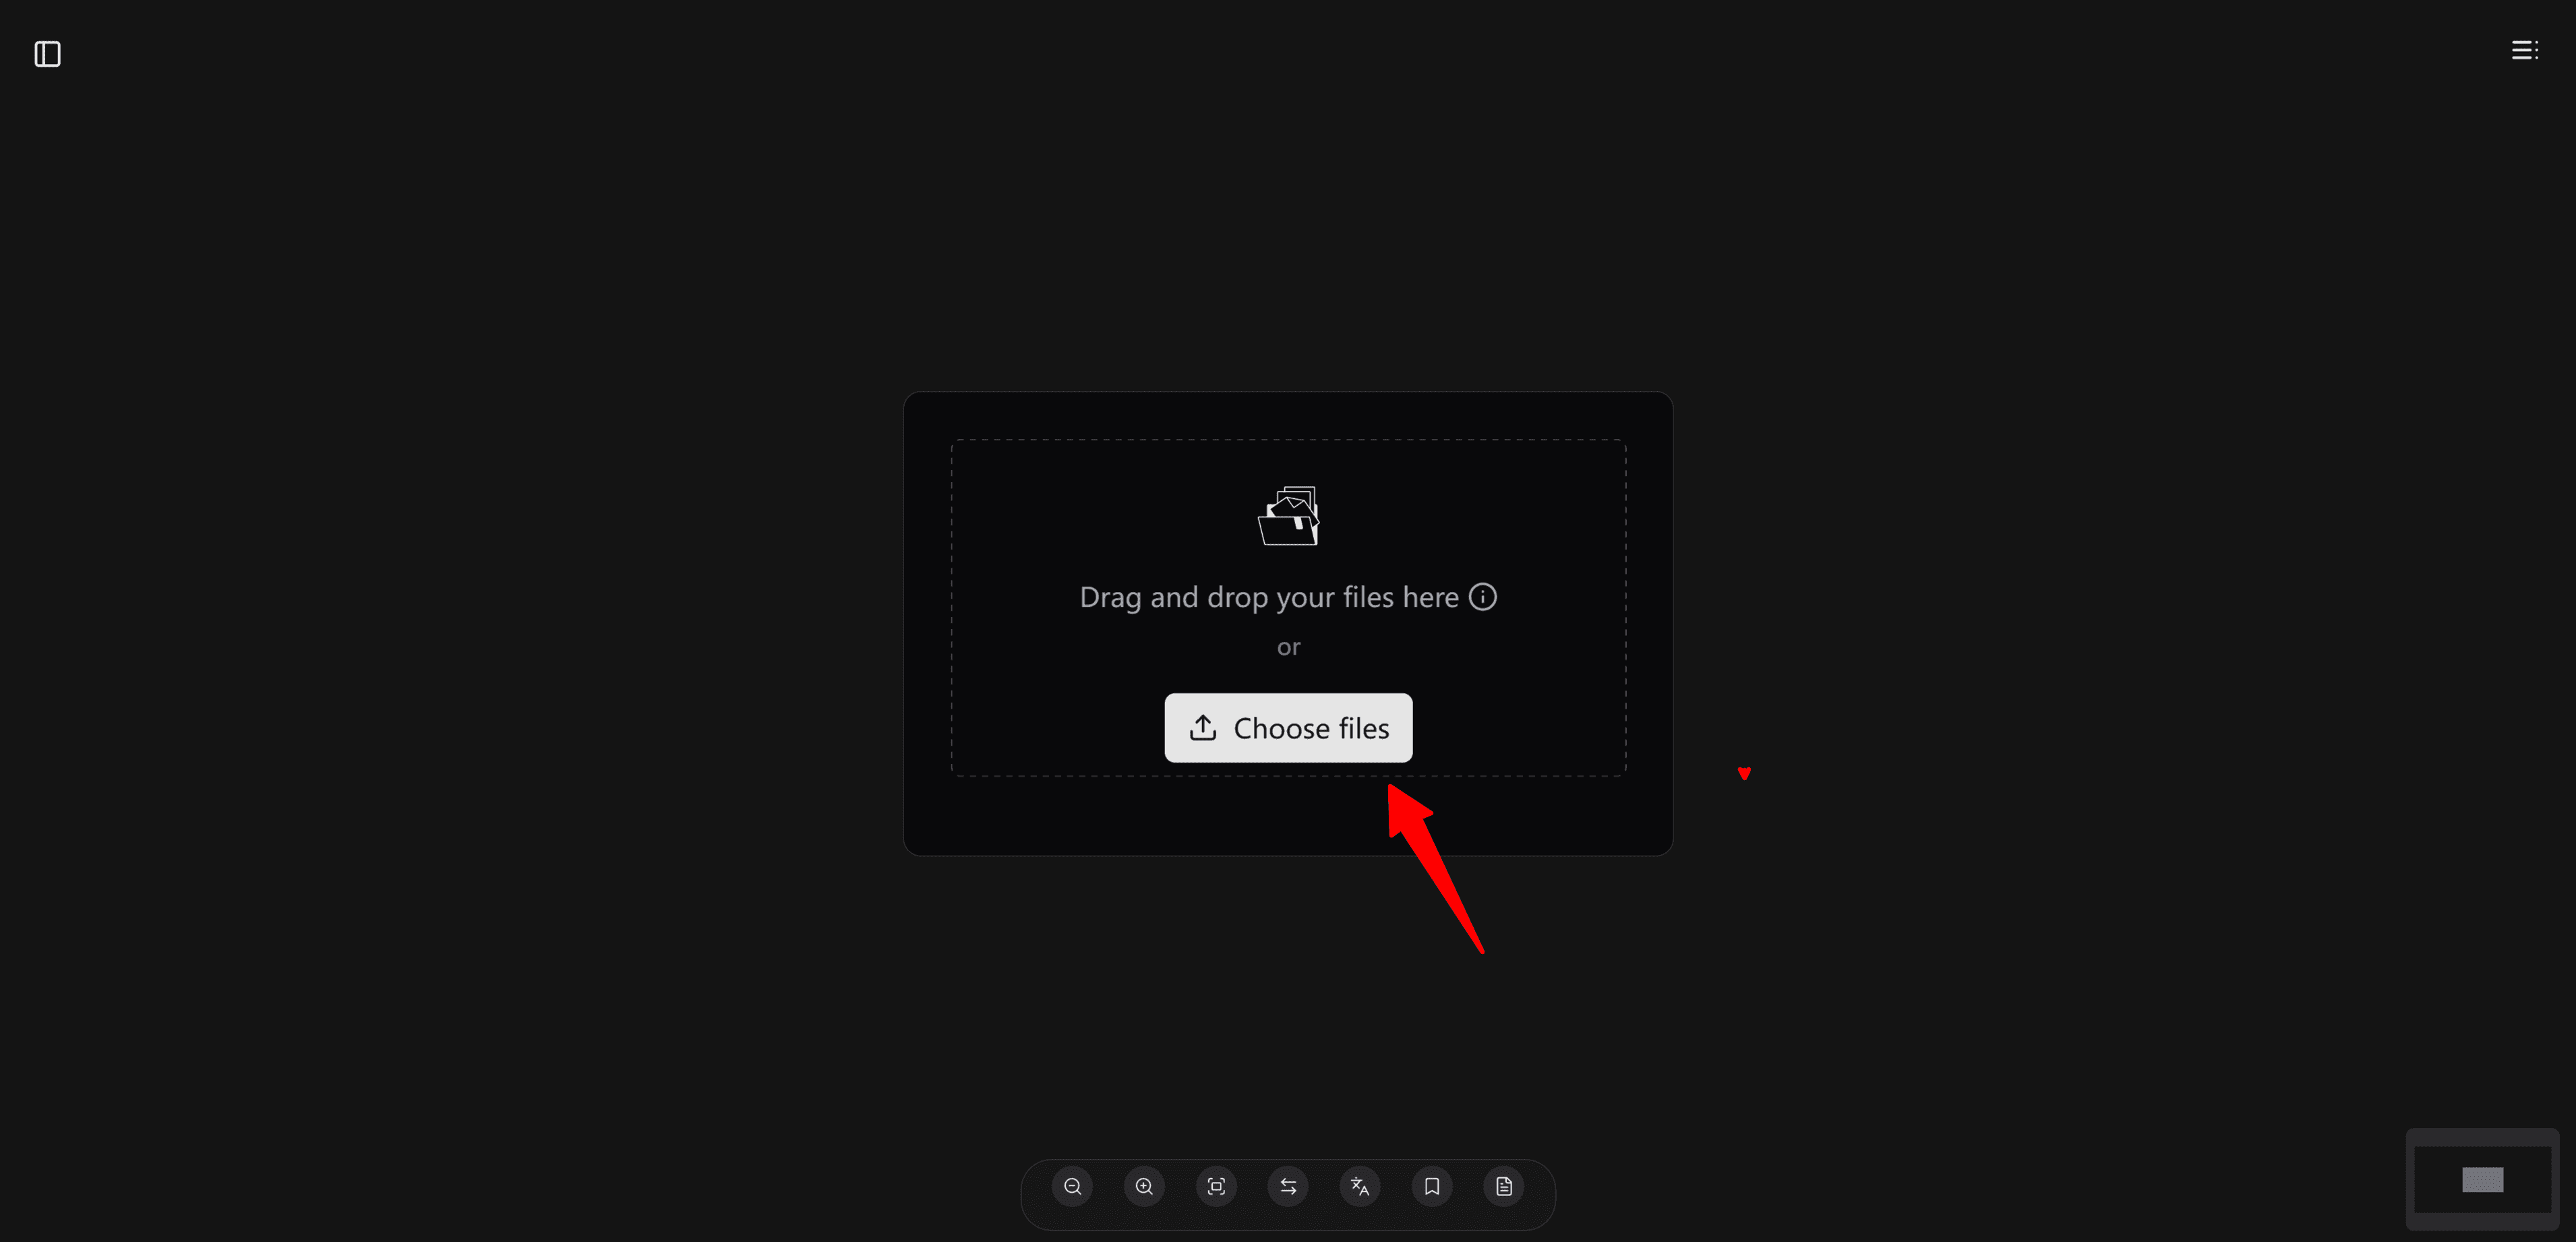
Step 3: Upload Your Data Files
Now it's time to upload your dataset(s) to Bloom. Don’t worry—your data is safe and securely handled.
Click the “Choose files” button to select your files.
Tip: If you plan to upload multiple files, be sure to select them all at once.
Once your upload begins, Bloom’s AI agent team immediately starts processing your data—handling tasks like cleaning, structure checks, and basic formatting.
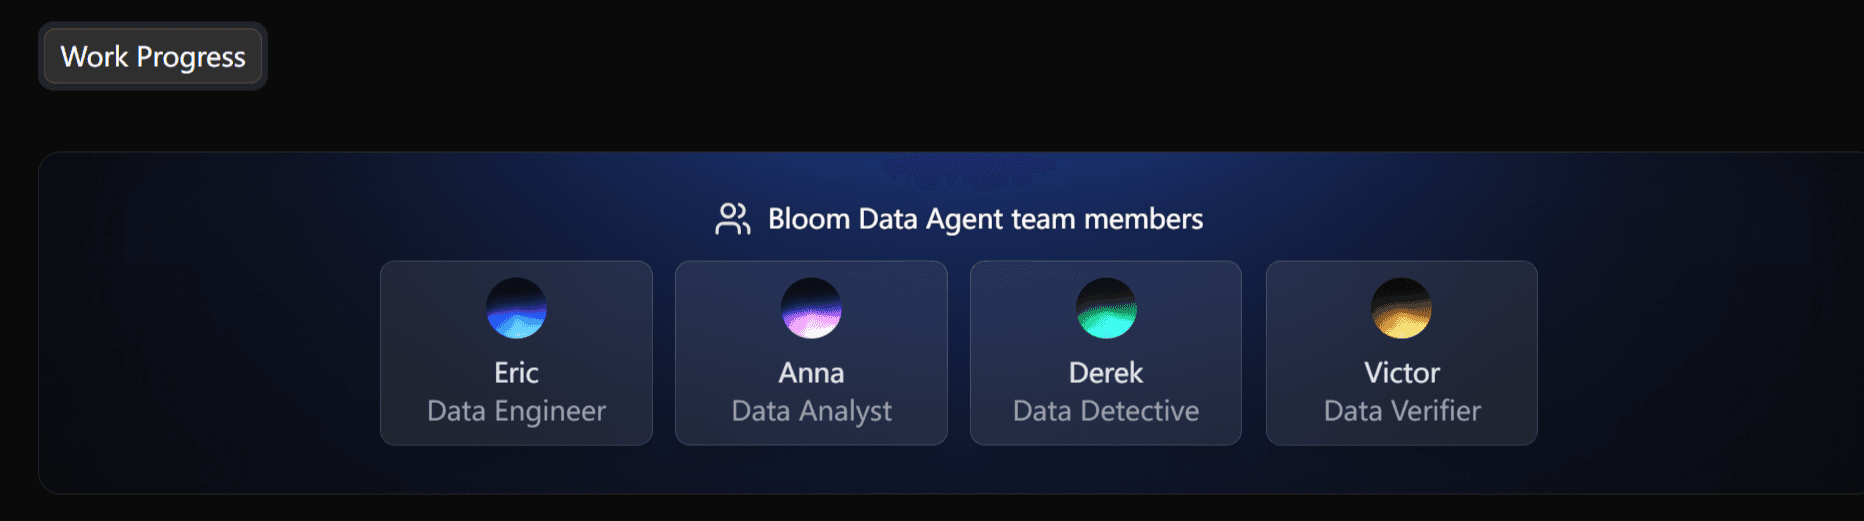
This preprocessing step takes about 1–2 minutes, and then you’re ready to explore.
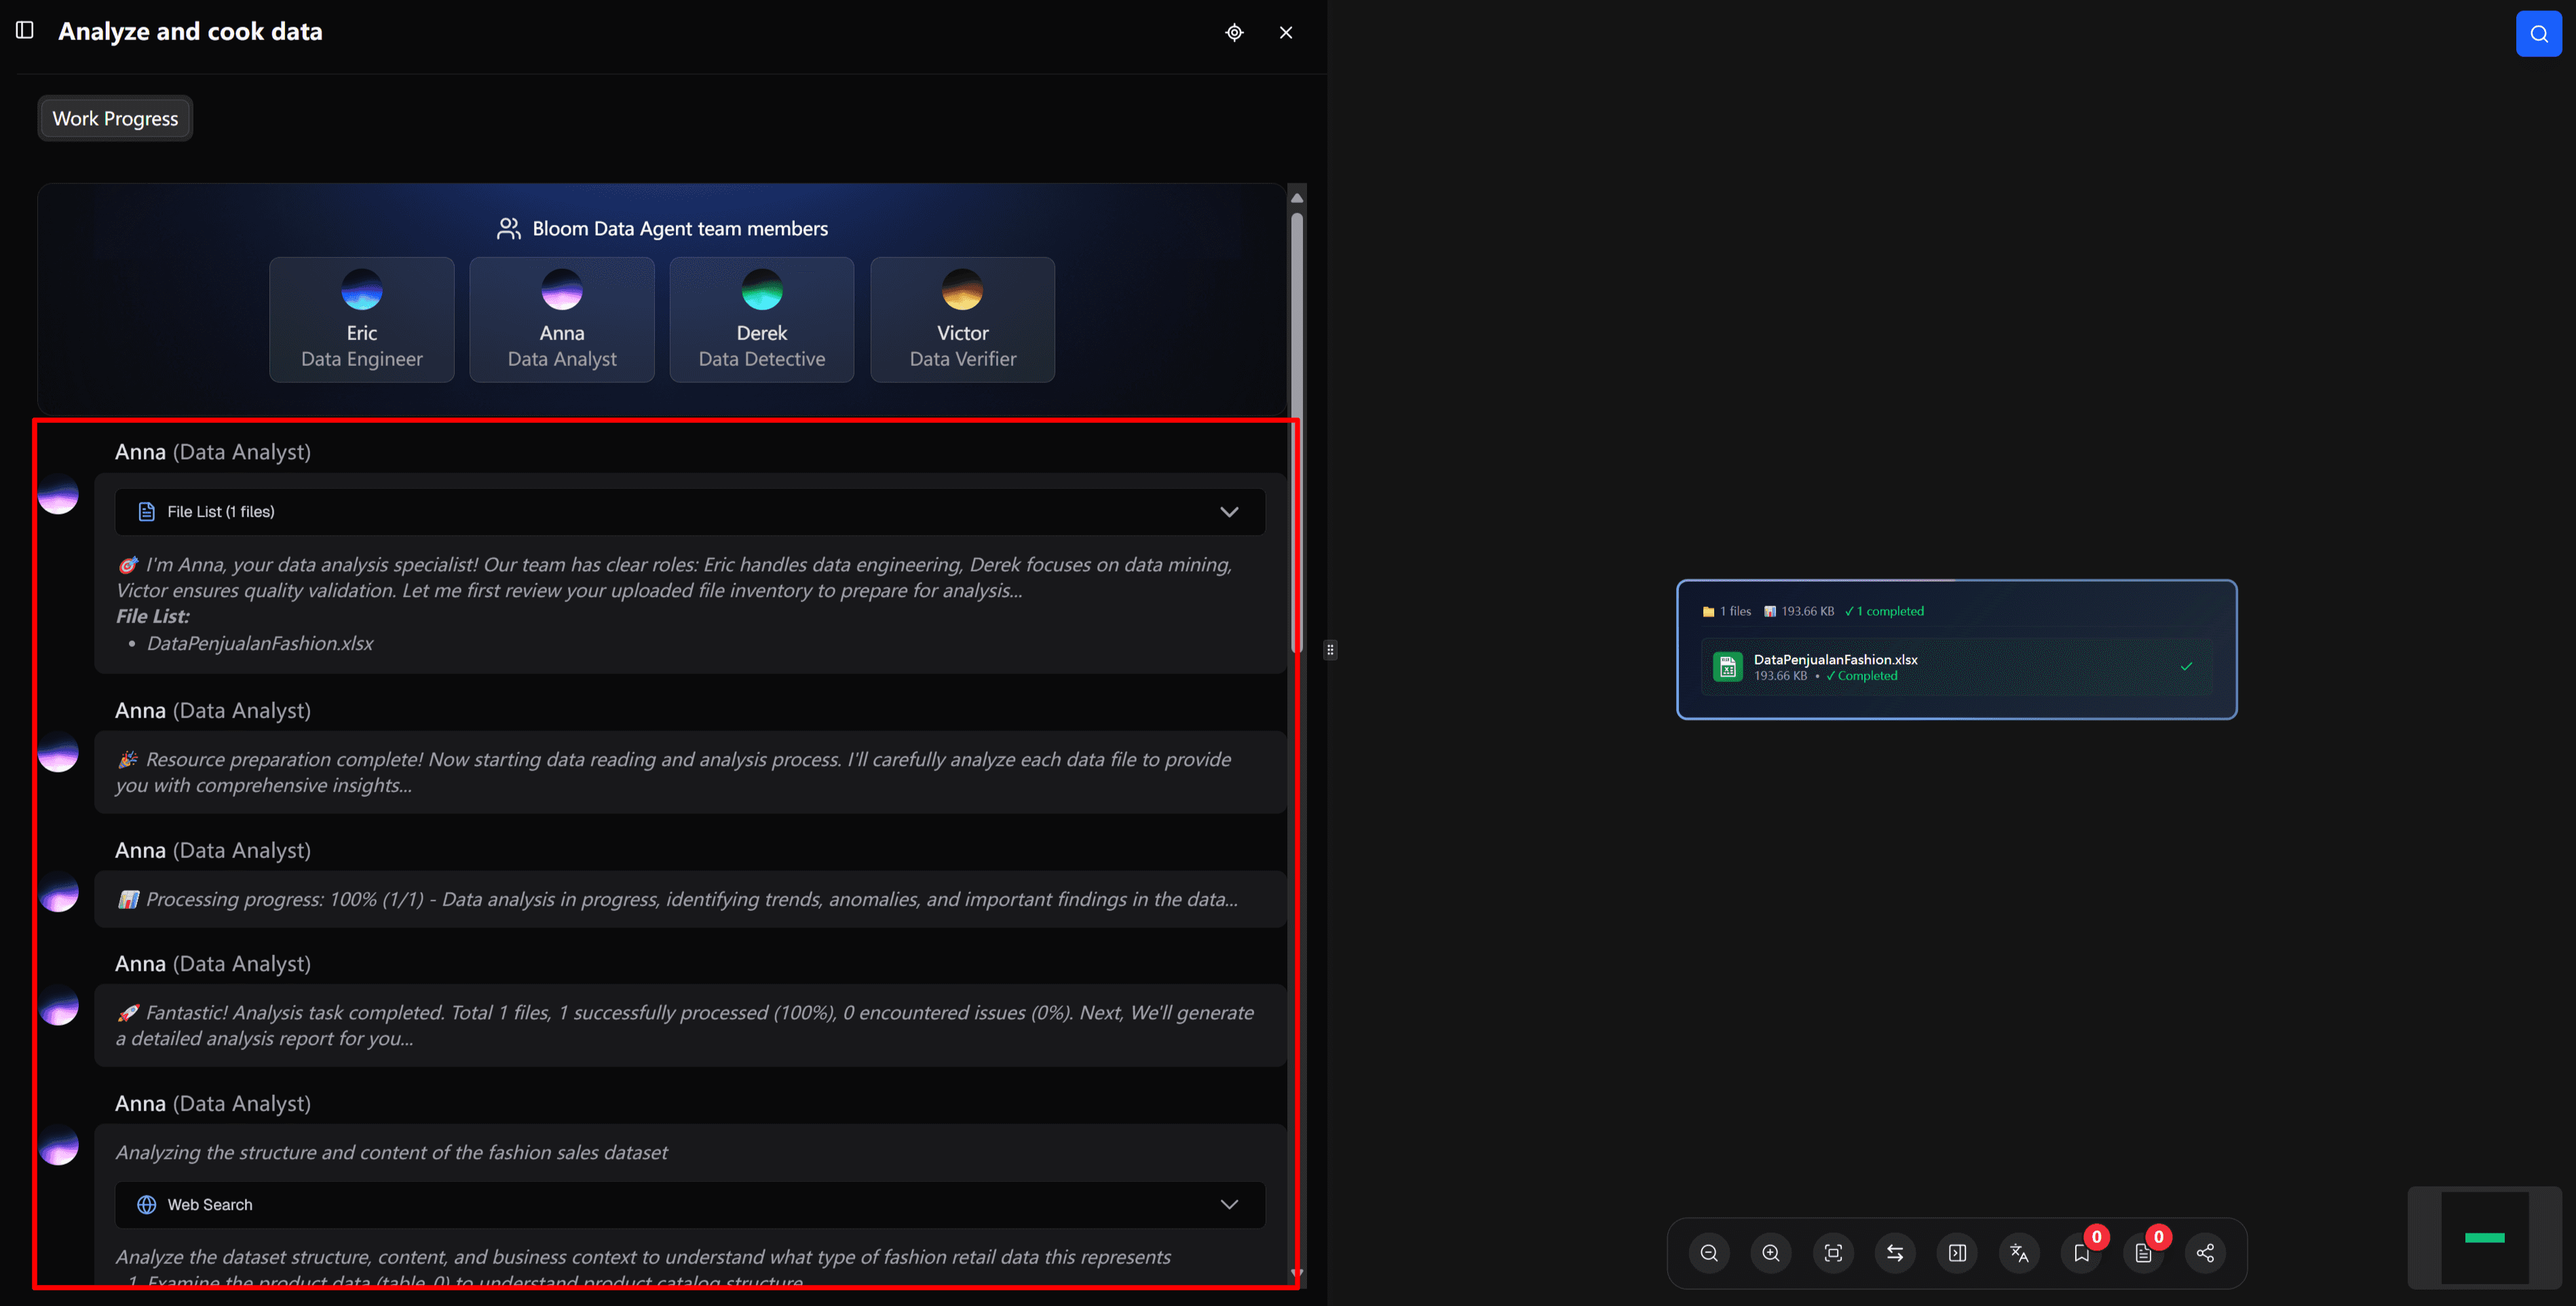
Step 4: Explore the Data
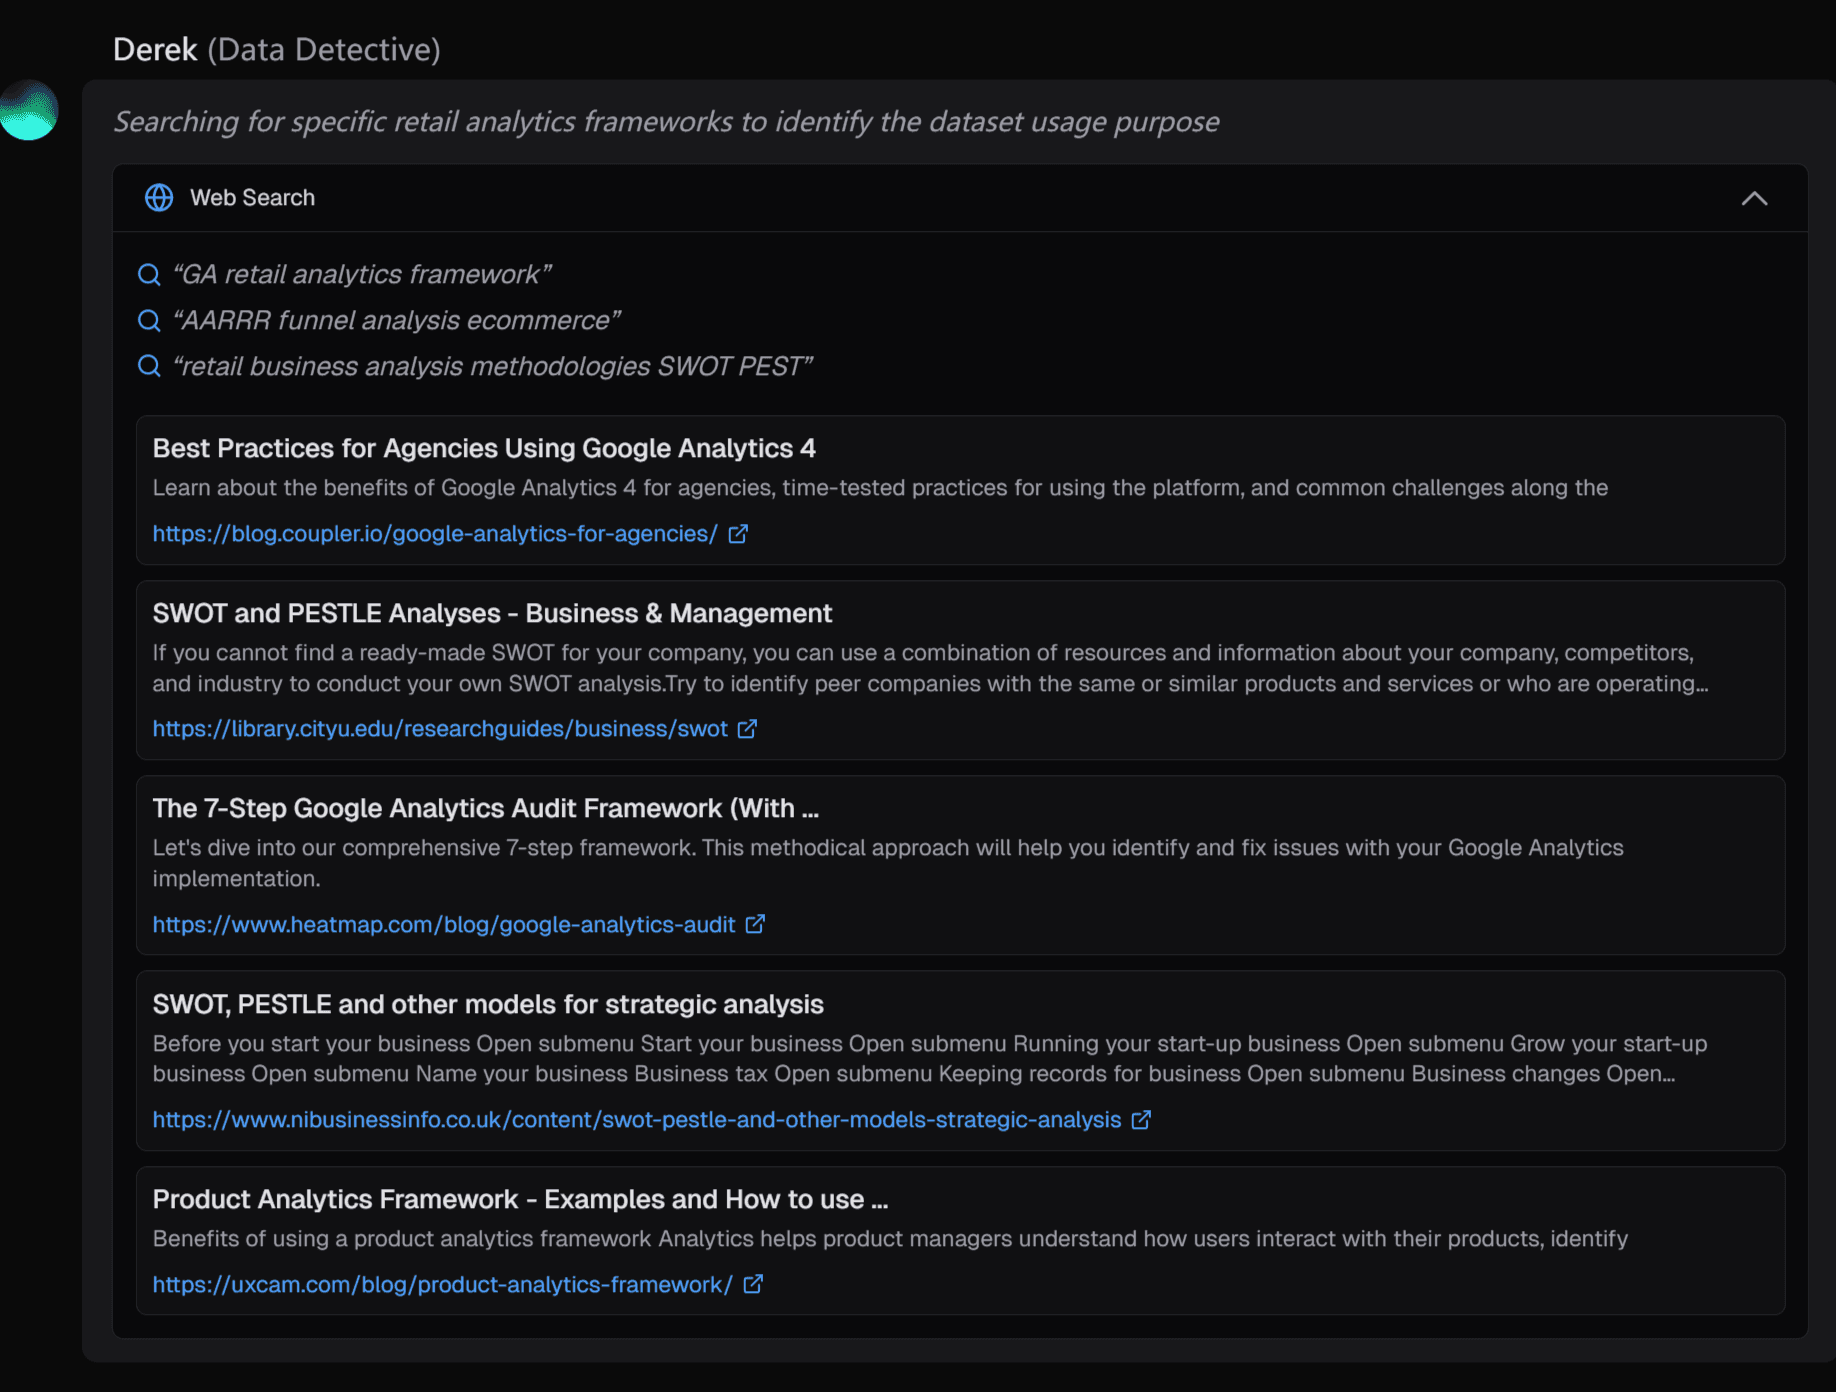
After preprocessing, our AI data engineer Derek performs a real-time web search to gather relevant market intelligence that enriches your analysis.
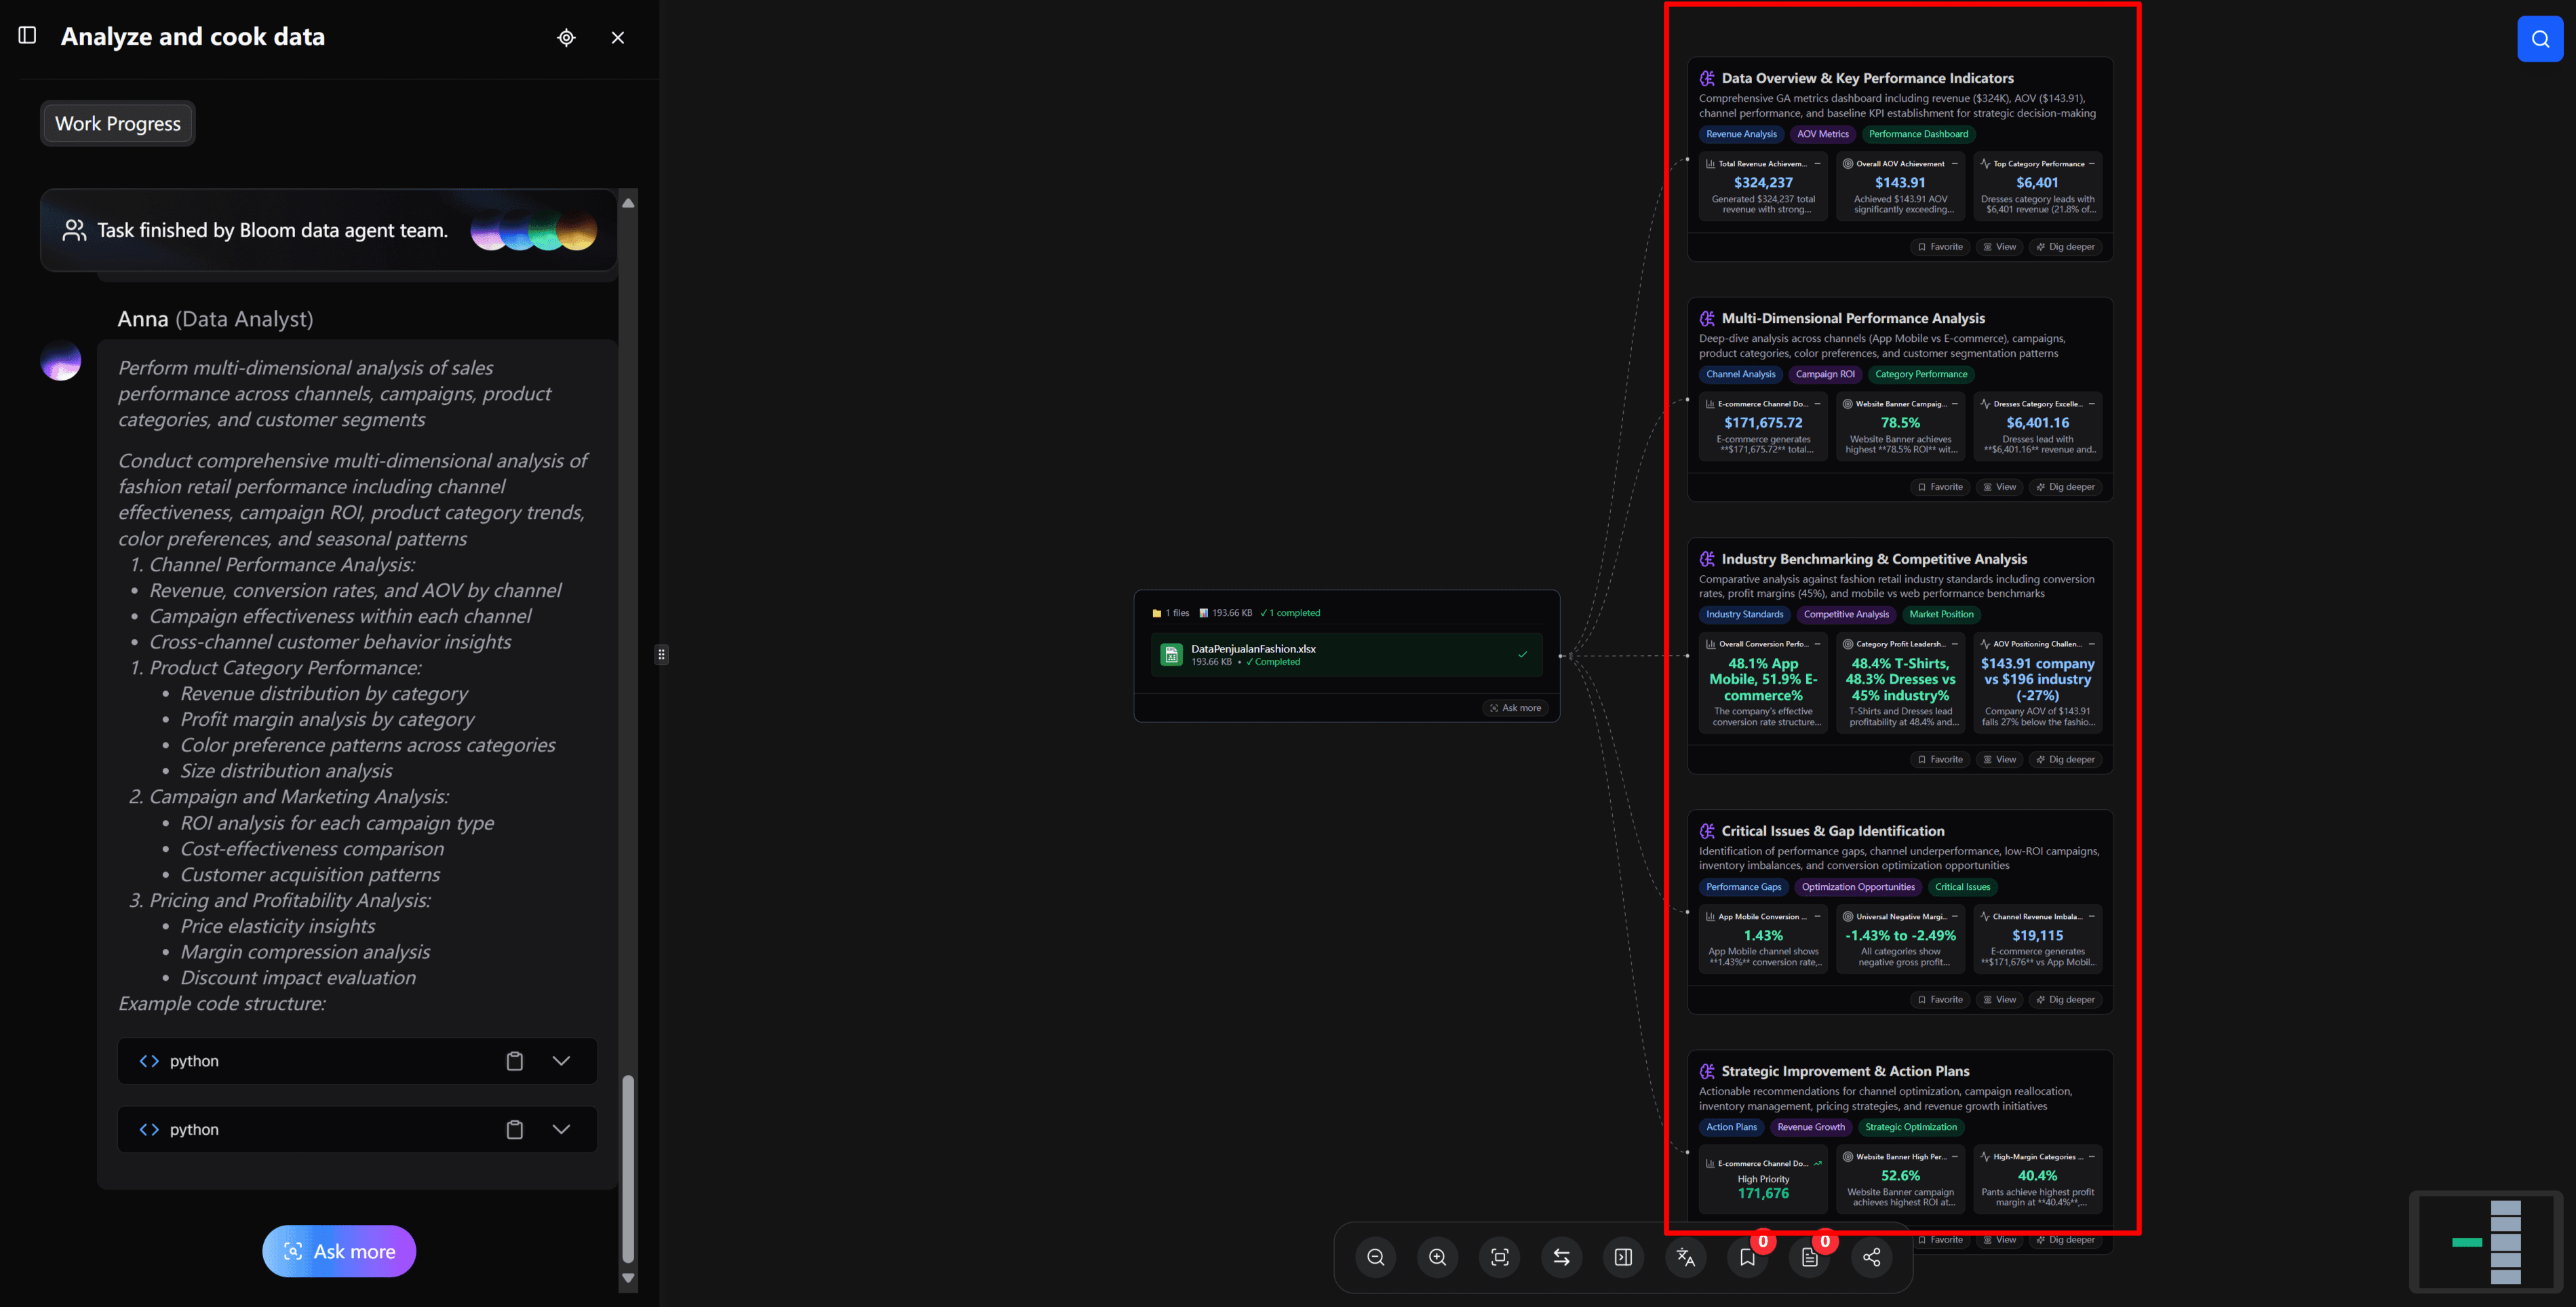
Meanwhile, our AI data analyst Anna jumps in to begin the initial analysis. If you’re not quite sure where to start, Anna’s explorations will provide inspiration and reference points.
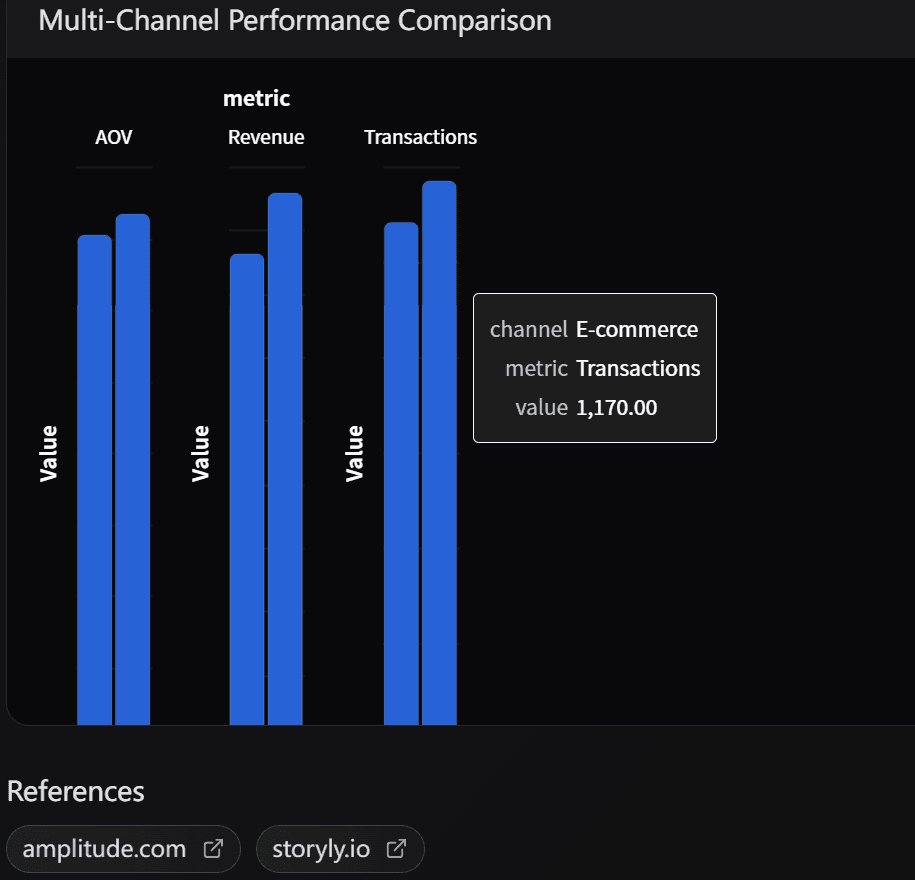
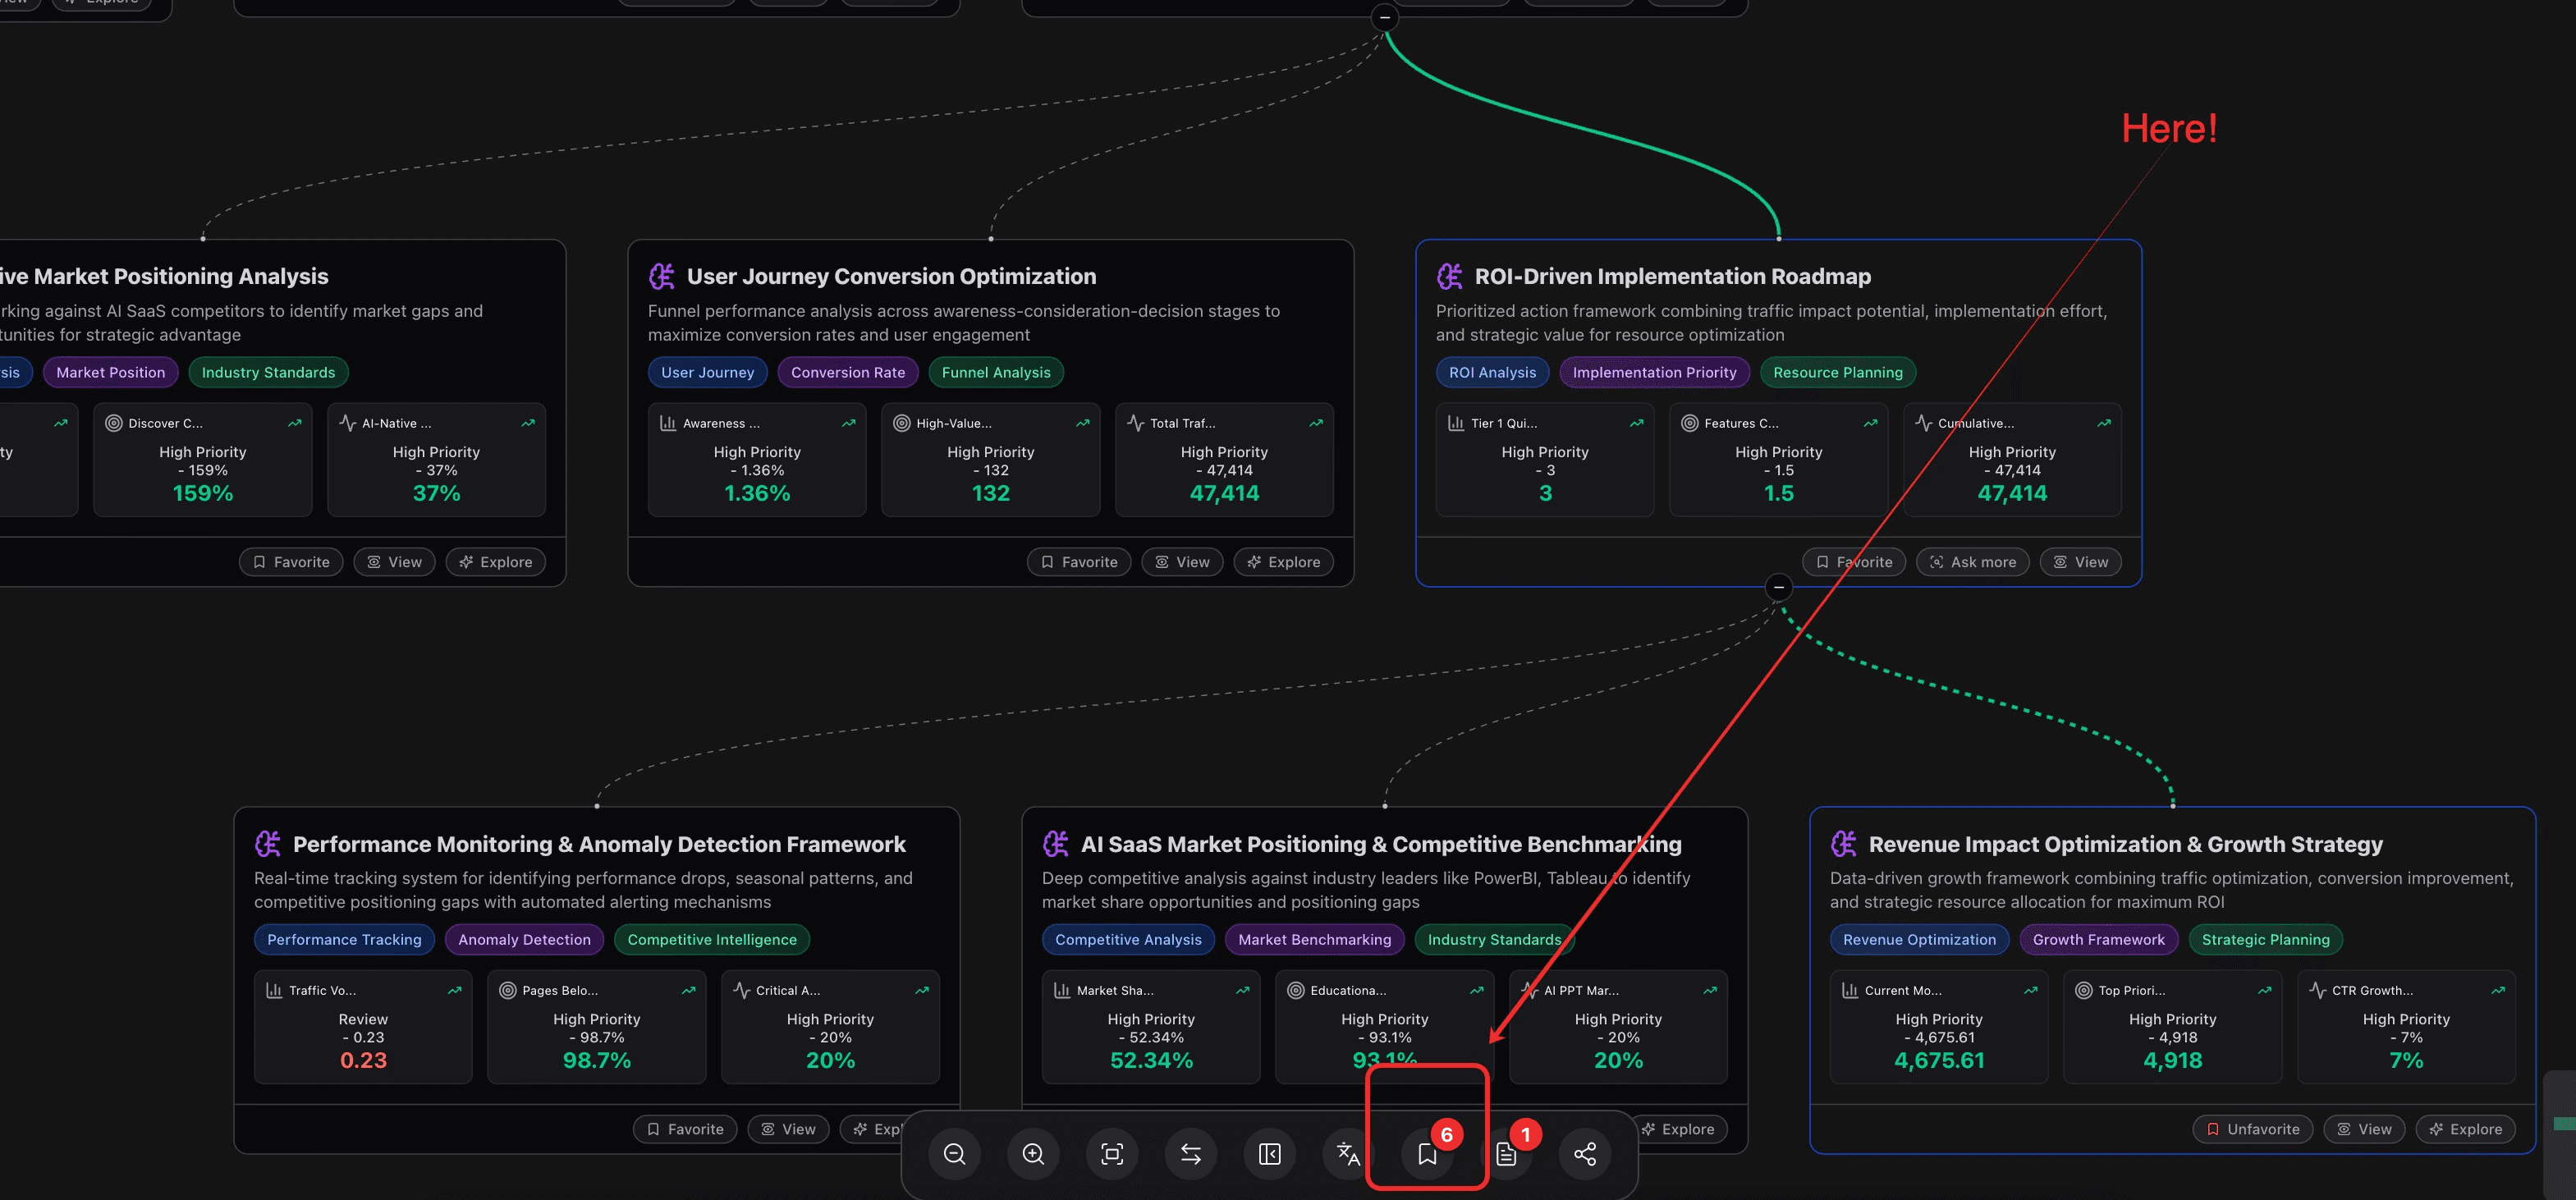
You’ll see a clear exploration path visualized on the AI canvas. Each node represents a different direction or insight.
The previous one was a bit small. This is a clear version. You can scroll the mouse to zoom in or out on the canvas.
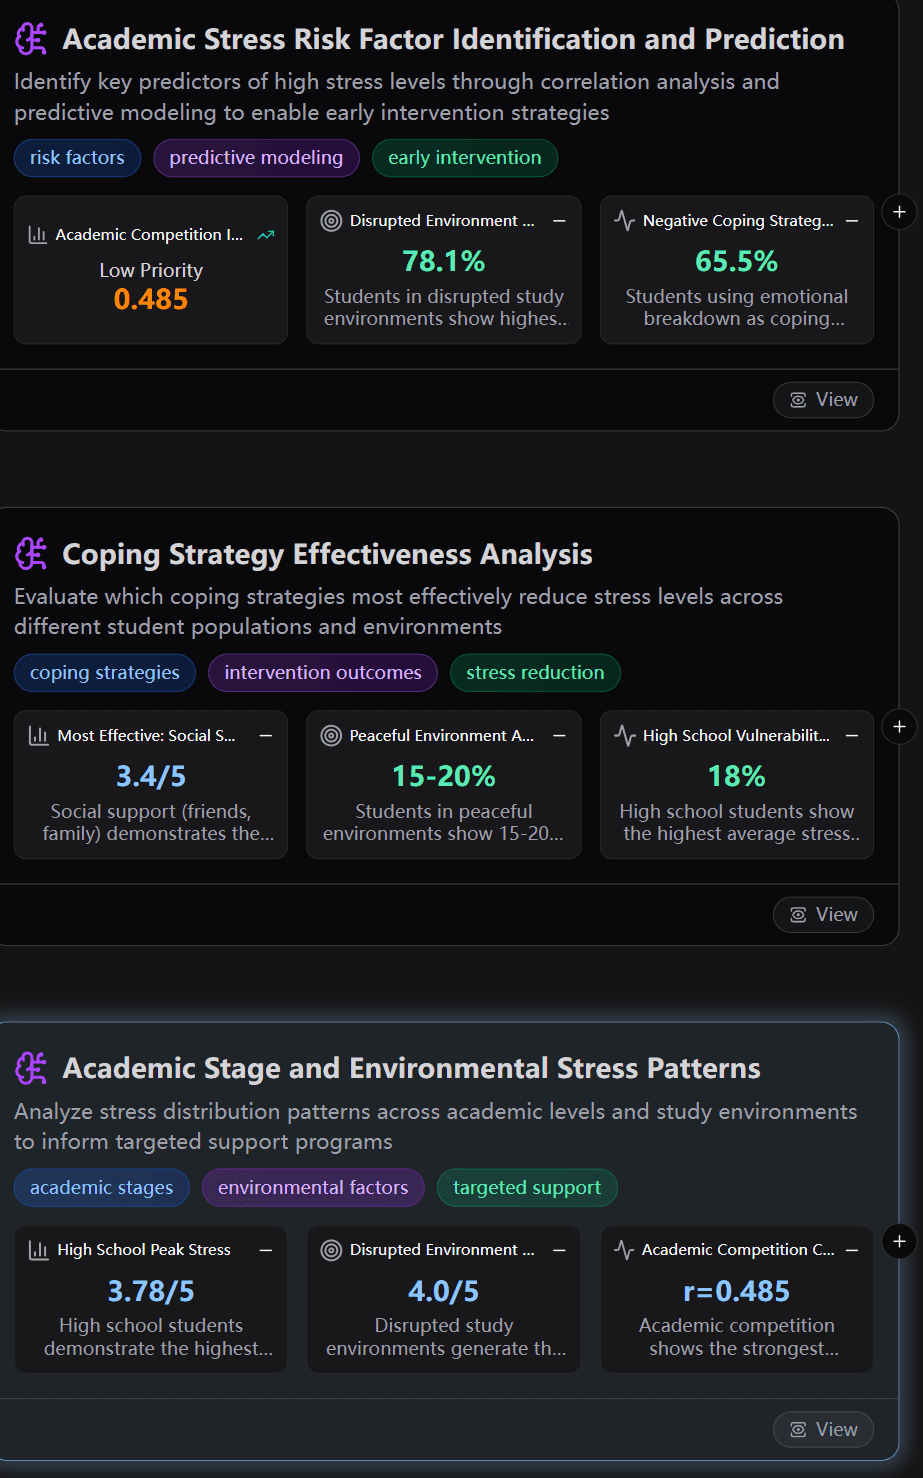
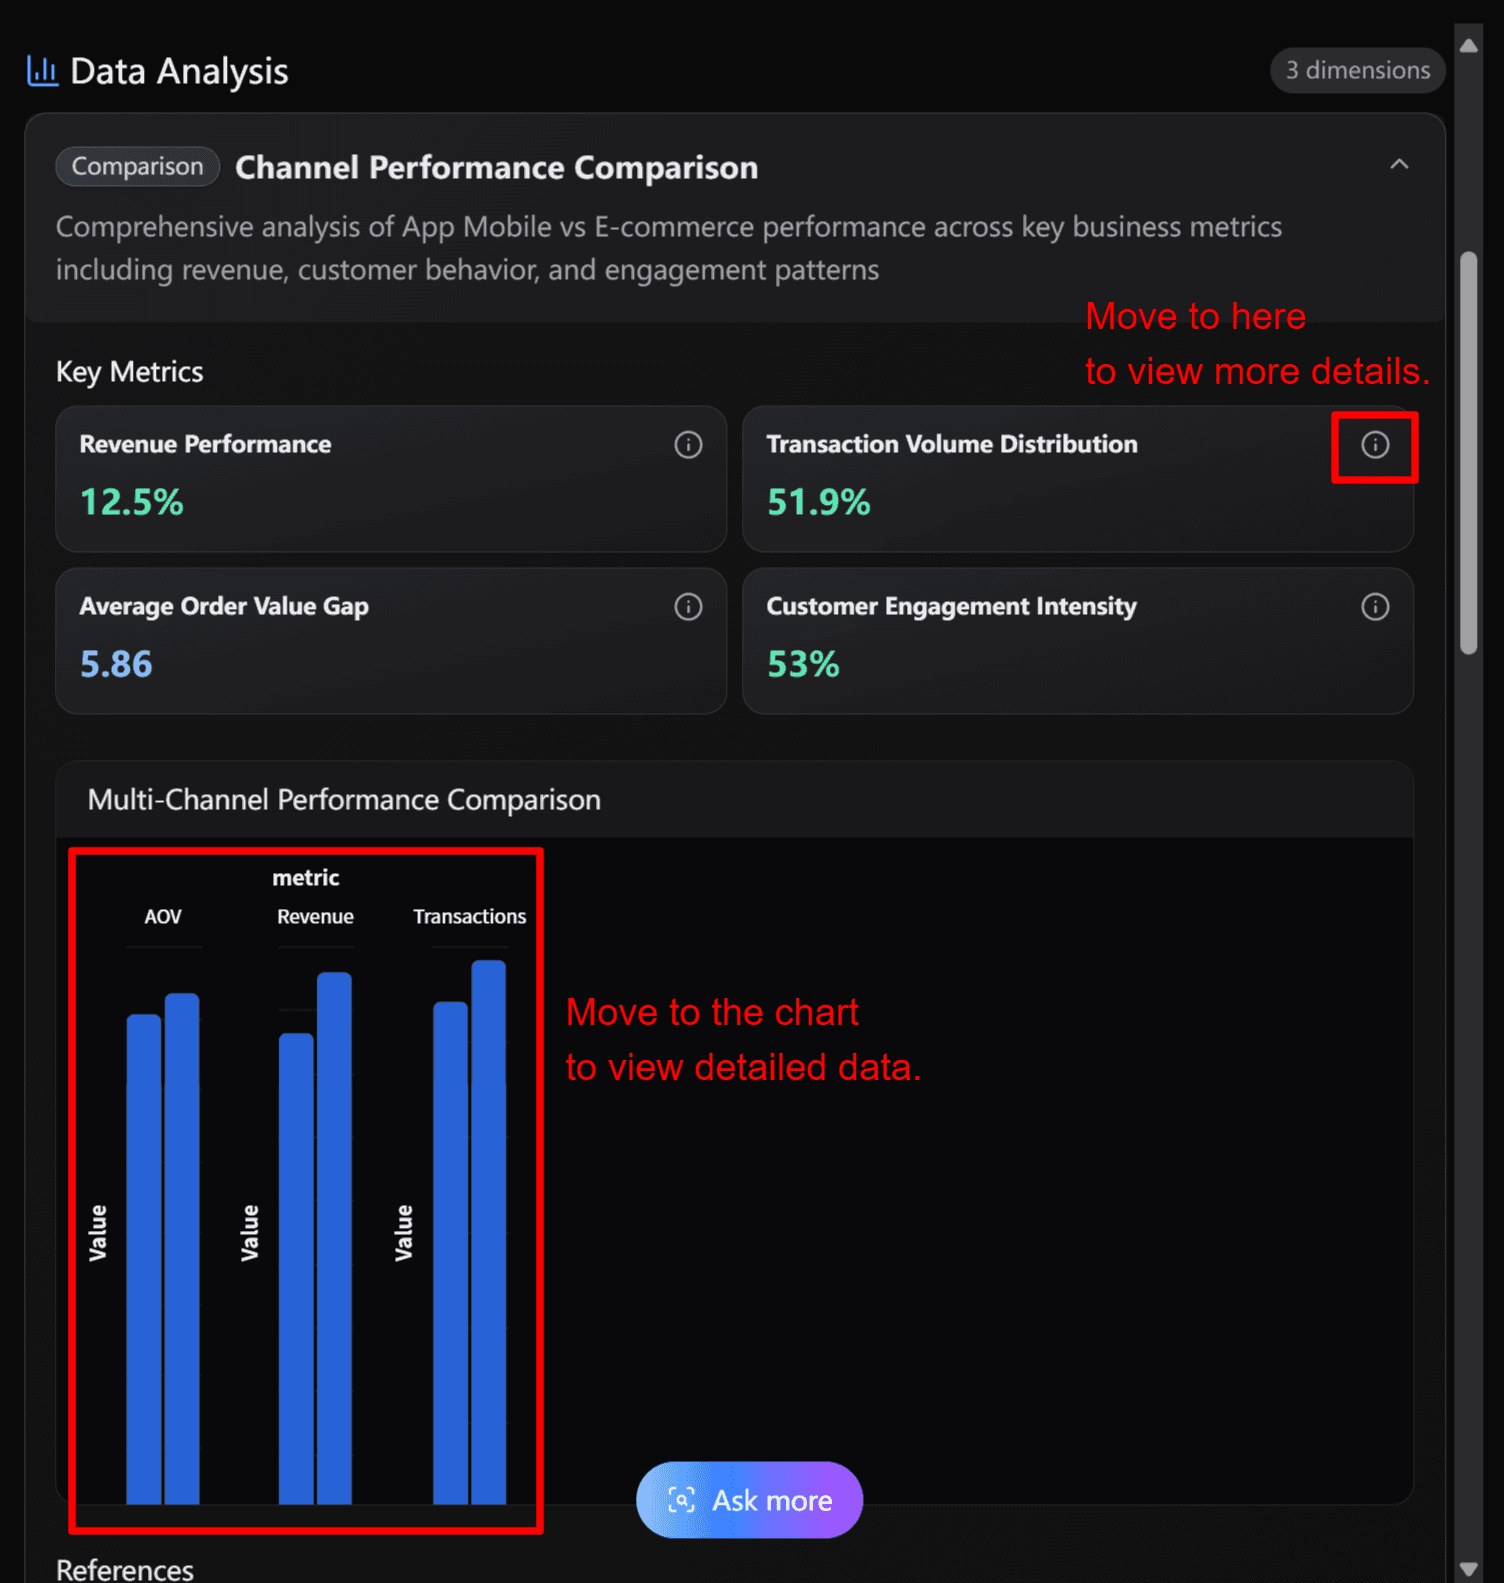
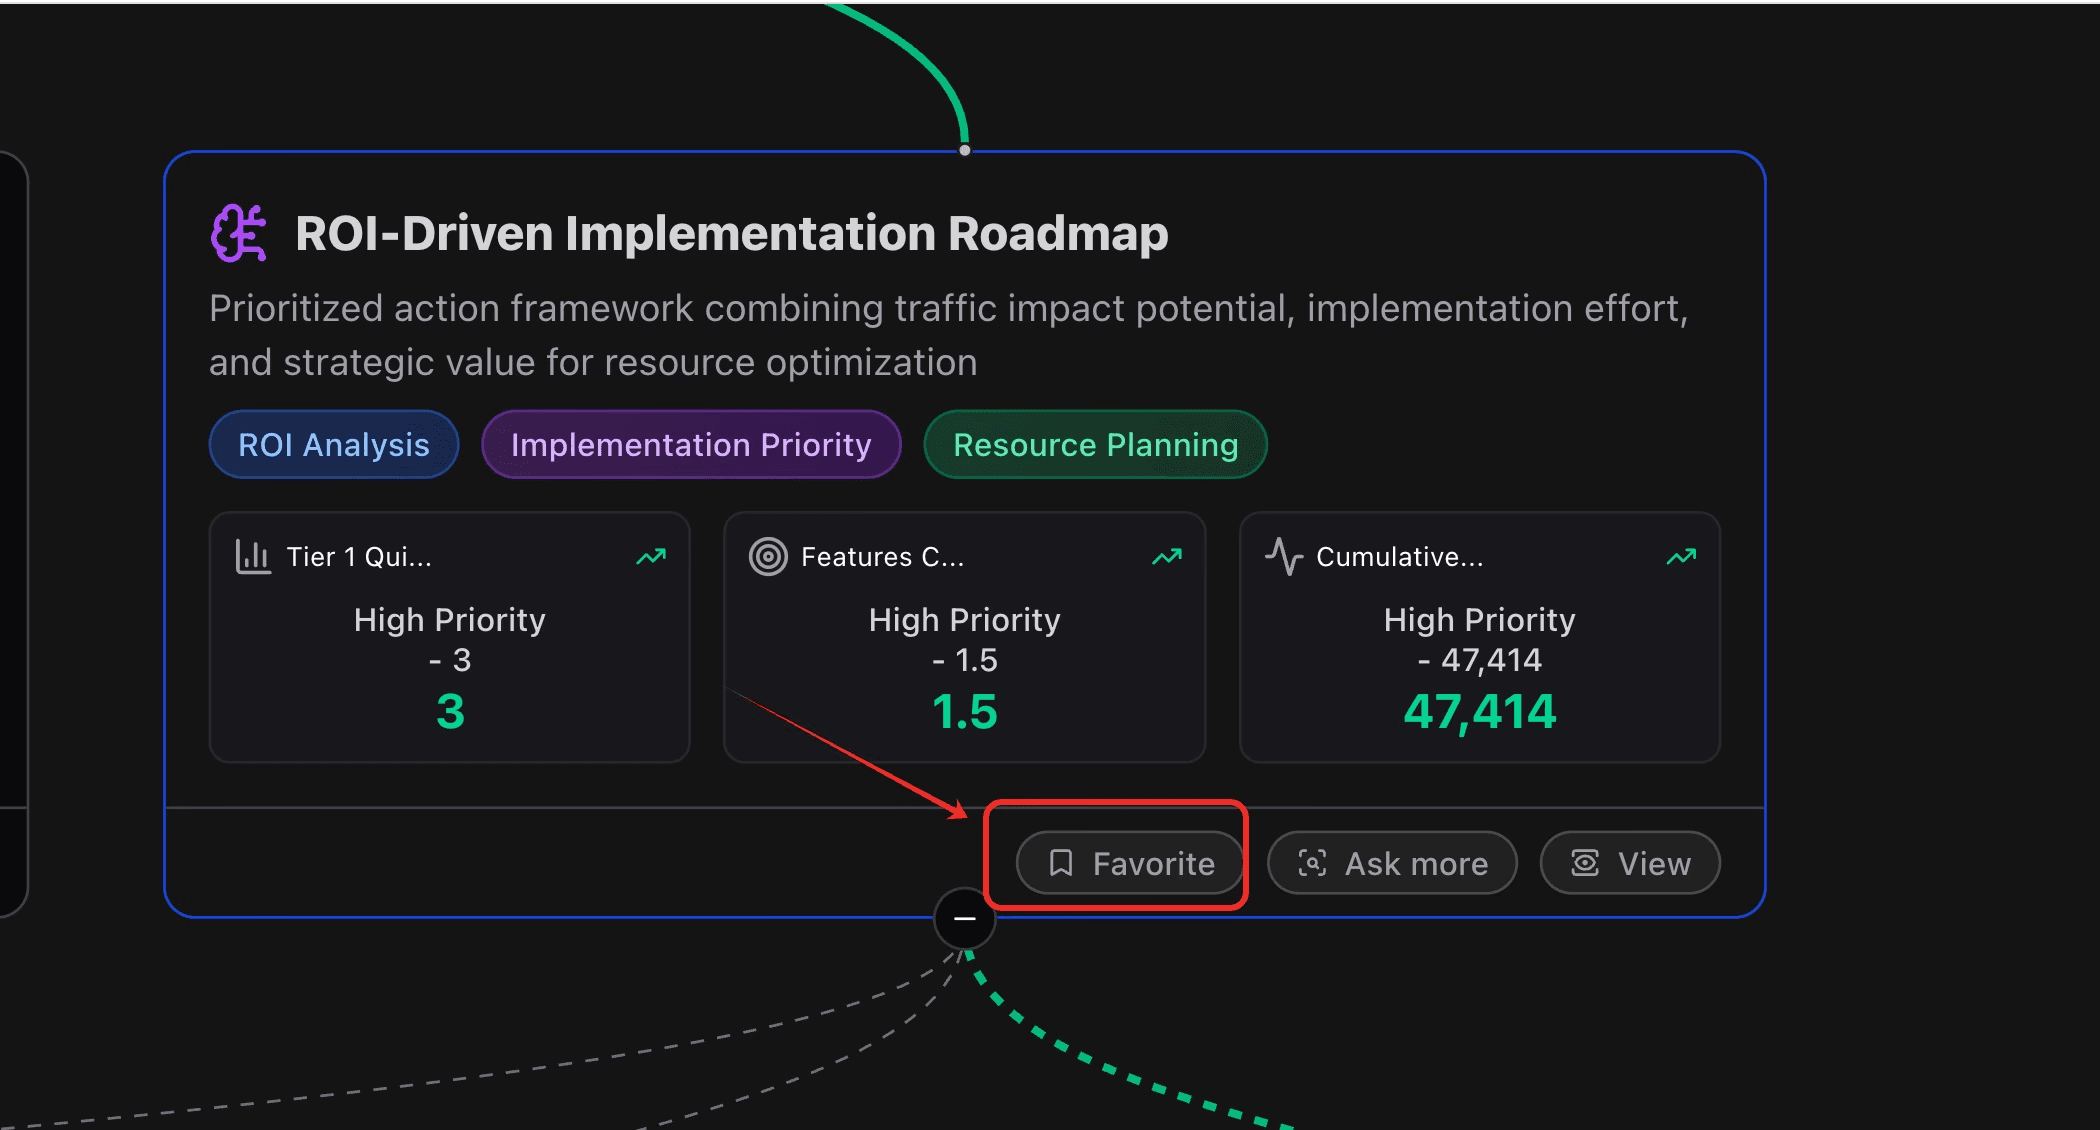
Simply select a node and click “View” to view actionable takeaways along with clean, easy-to-understand visualizations.
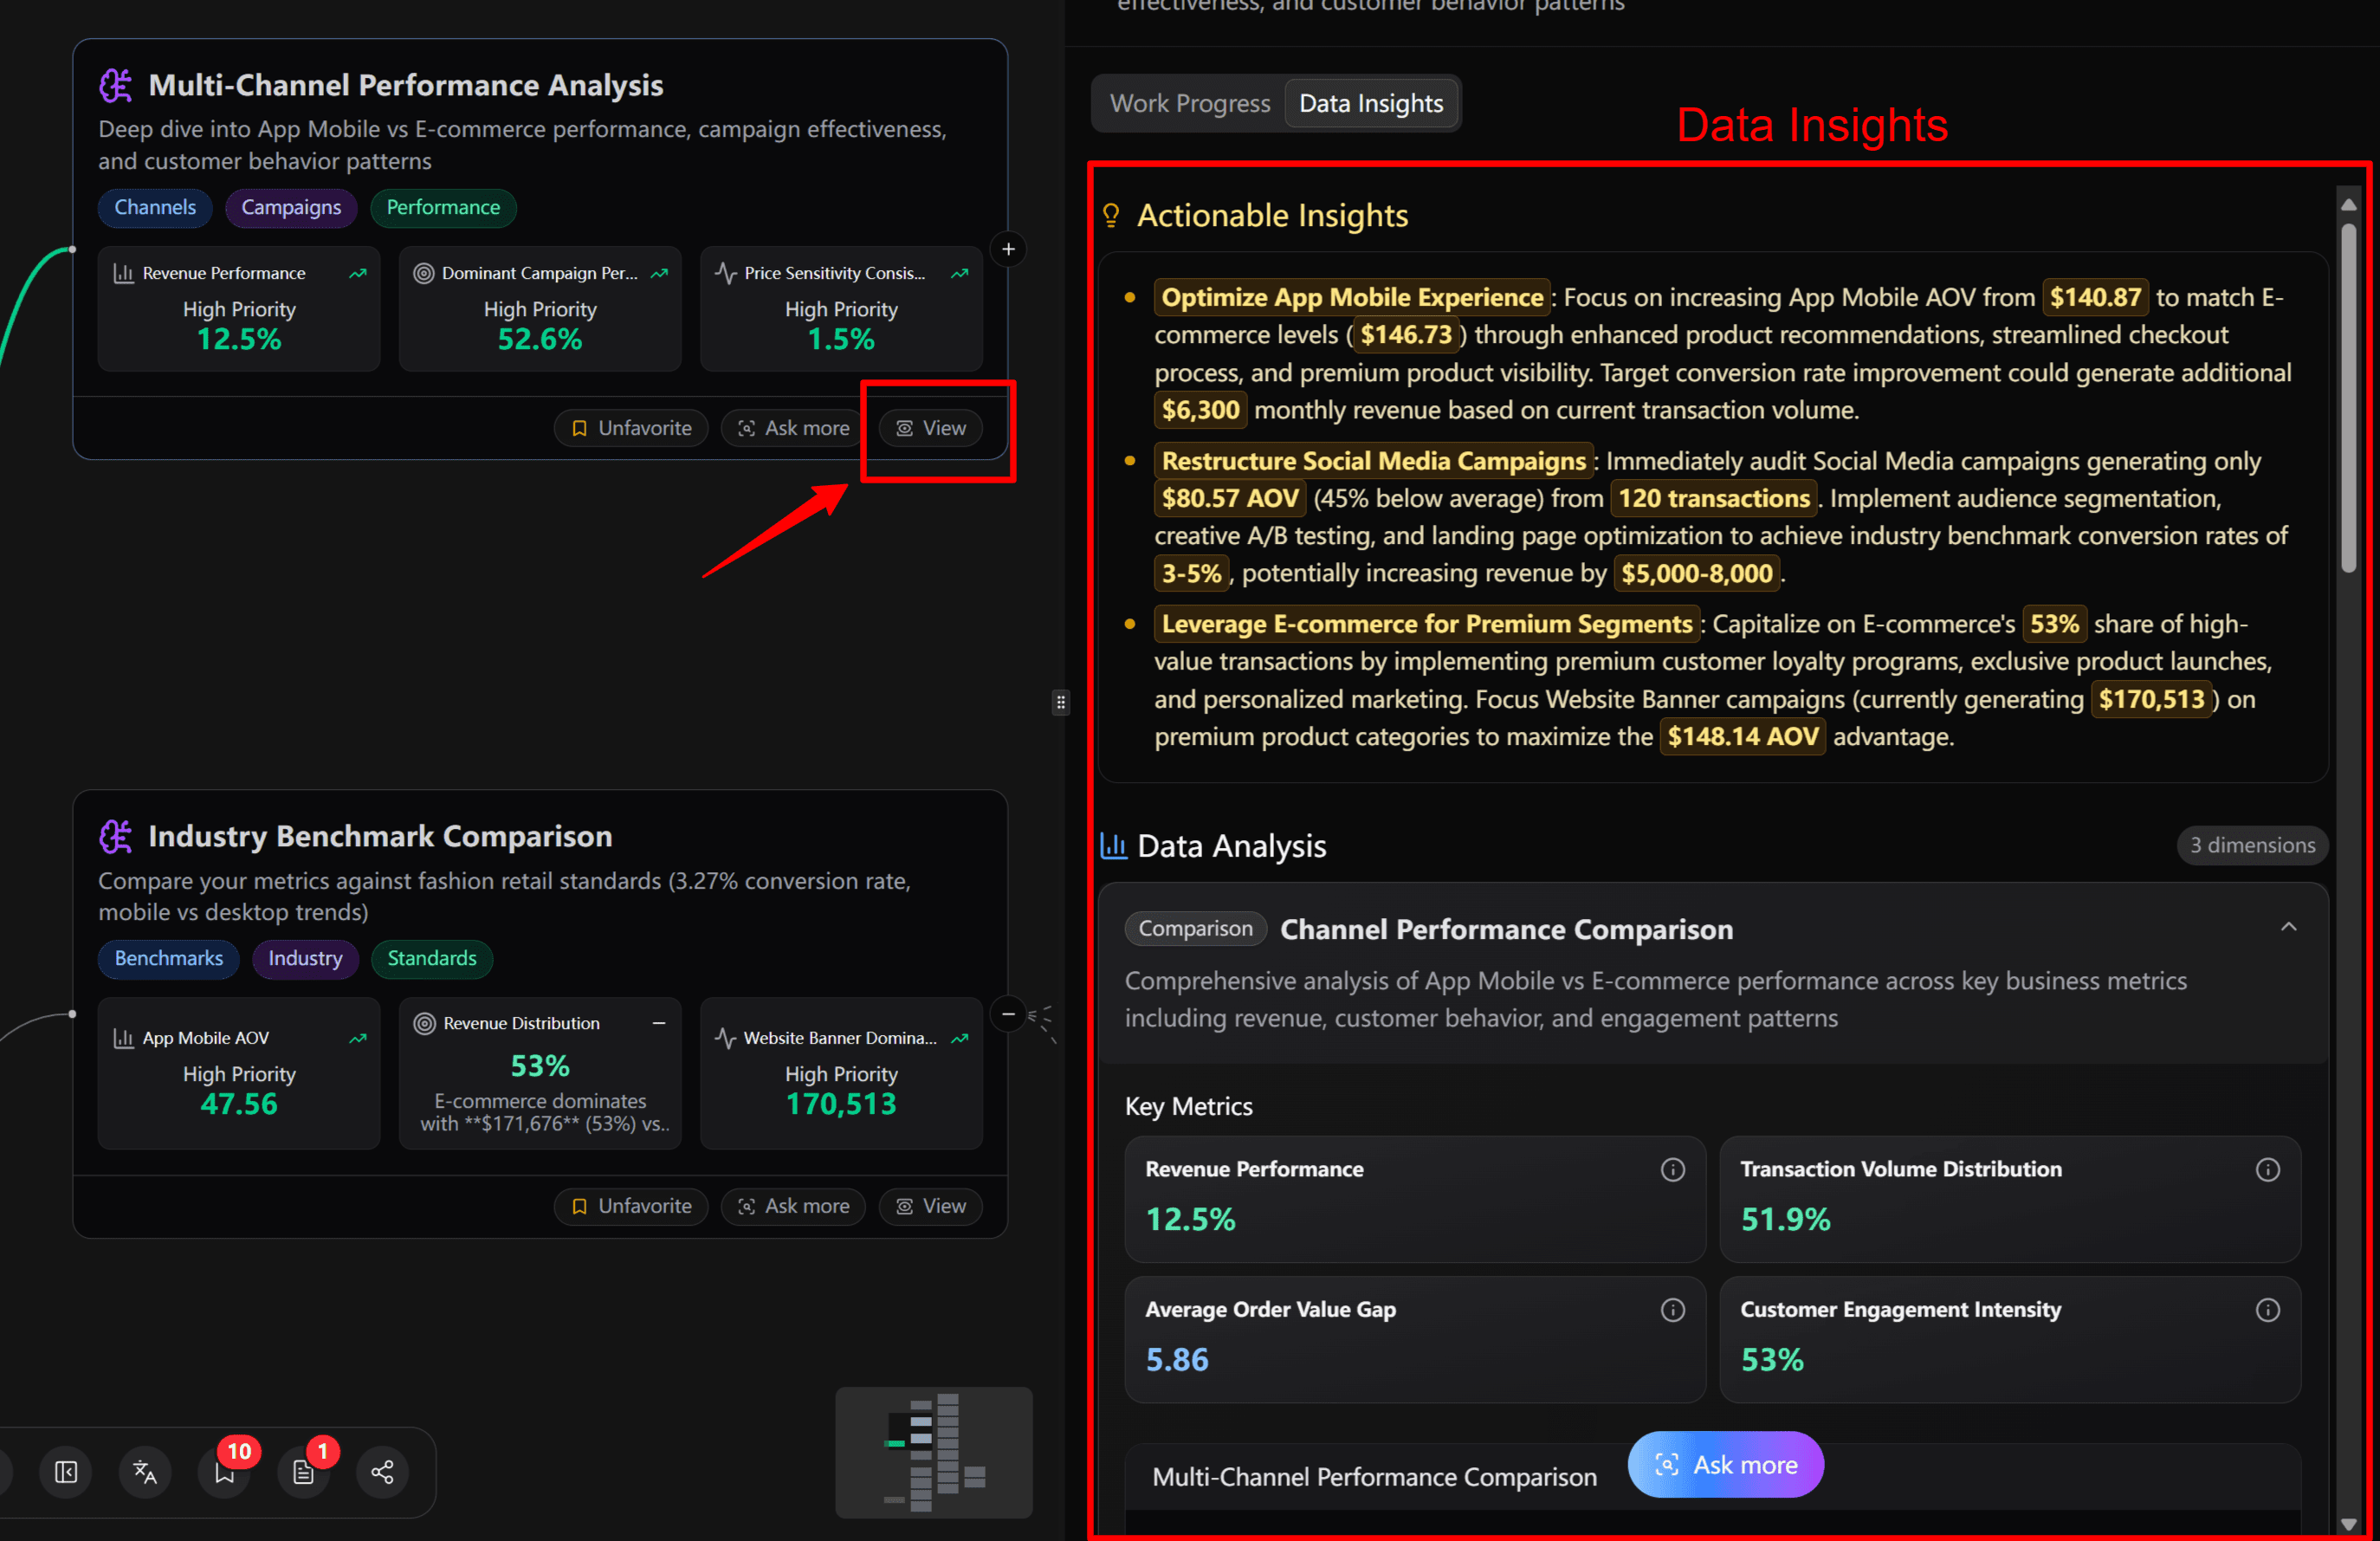
For example:
Implement Academic Competition Management Programs: Deploy stress-reduction interventions targeting academic competition perceptions, given its 2.26x odds ratio for high stress. Focus on reframing competitive mindsets through cognitive-behavioral approaches, as research shows small to moderate effect sizes (0.3-0.5) for school-based anxiety prevention programs.
Establish Environmental Stress Screening: Create systematic assessment of study environments, prioritizing students in disrupted settings who show 78.1% high-stress prevalence versus 50.0% in peaceful environments. Implement environmental modifications and provide alternative study spaces as early intervention, potentially reducing stress risk by 28.1 percentage points.
Deploy Multi-Modal Early Detection System: Integrate predictive screening combining academic competition ratings, peer pressure assessments, and environmental factors into existing student support systems. Target students scoring ≥4 on competition scales who represent 60.3% baseline risk for intensive support programs, leveraging the 62.2% prediction accuracy for resource allocation.
Step 5: Dive Deeper
Once you’ve reviewed the initial insights, you can choose to explore further.
Got your own questions or hypotheses? Click “Ask More” to type in your query.
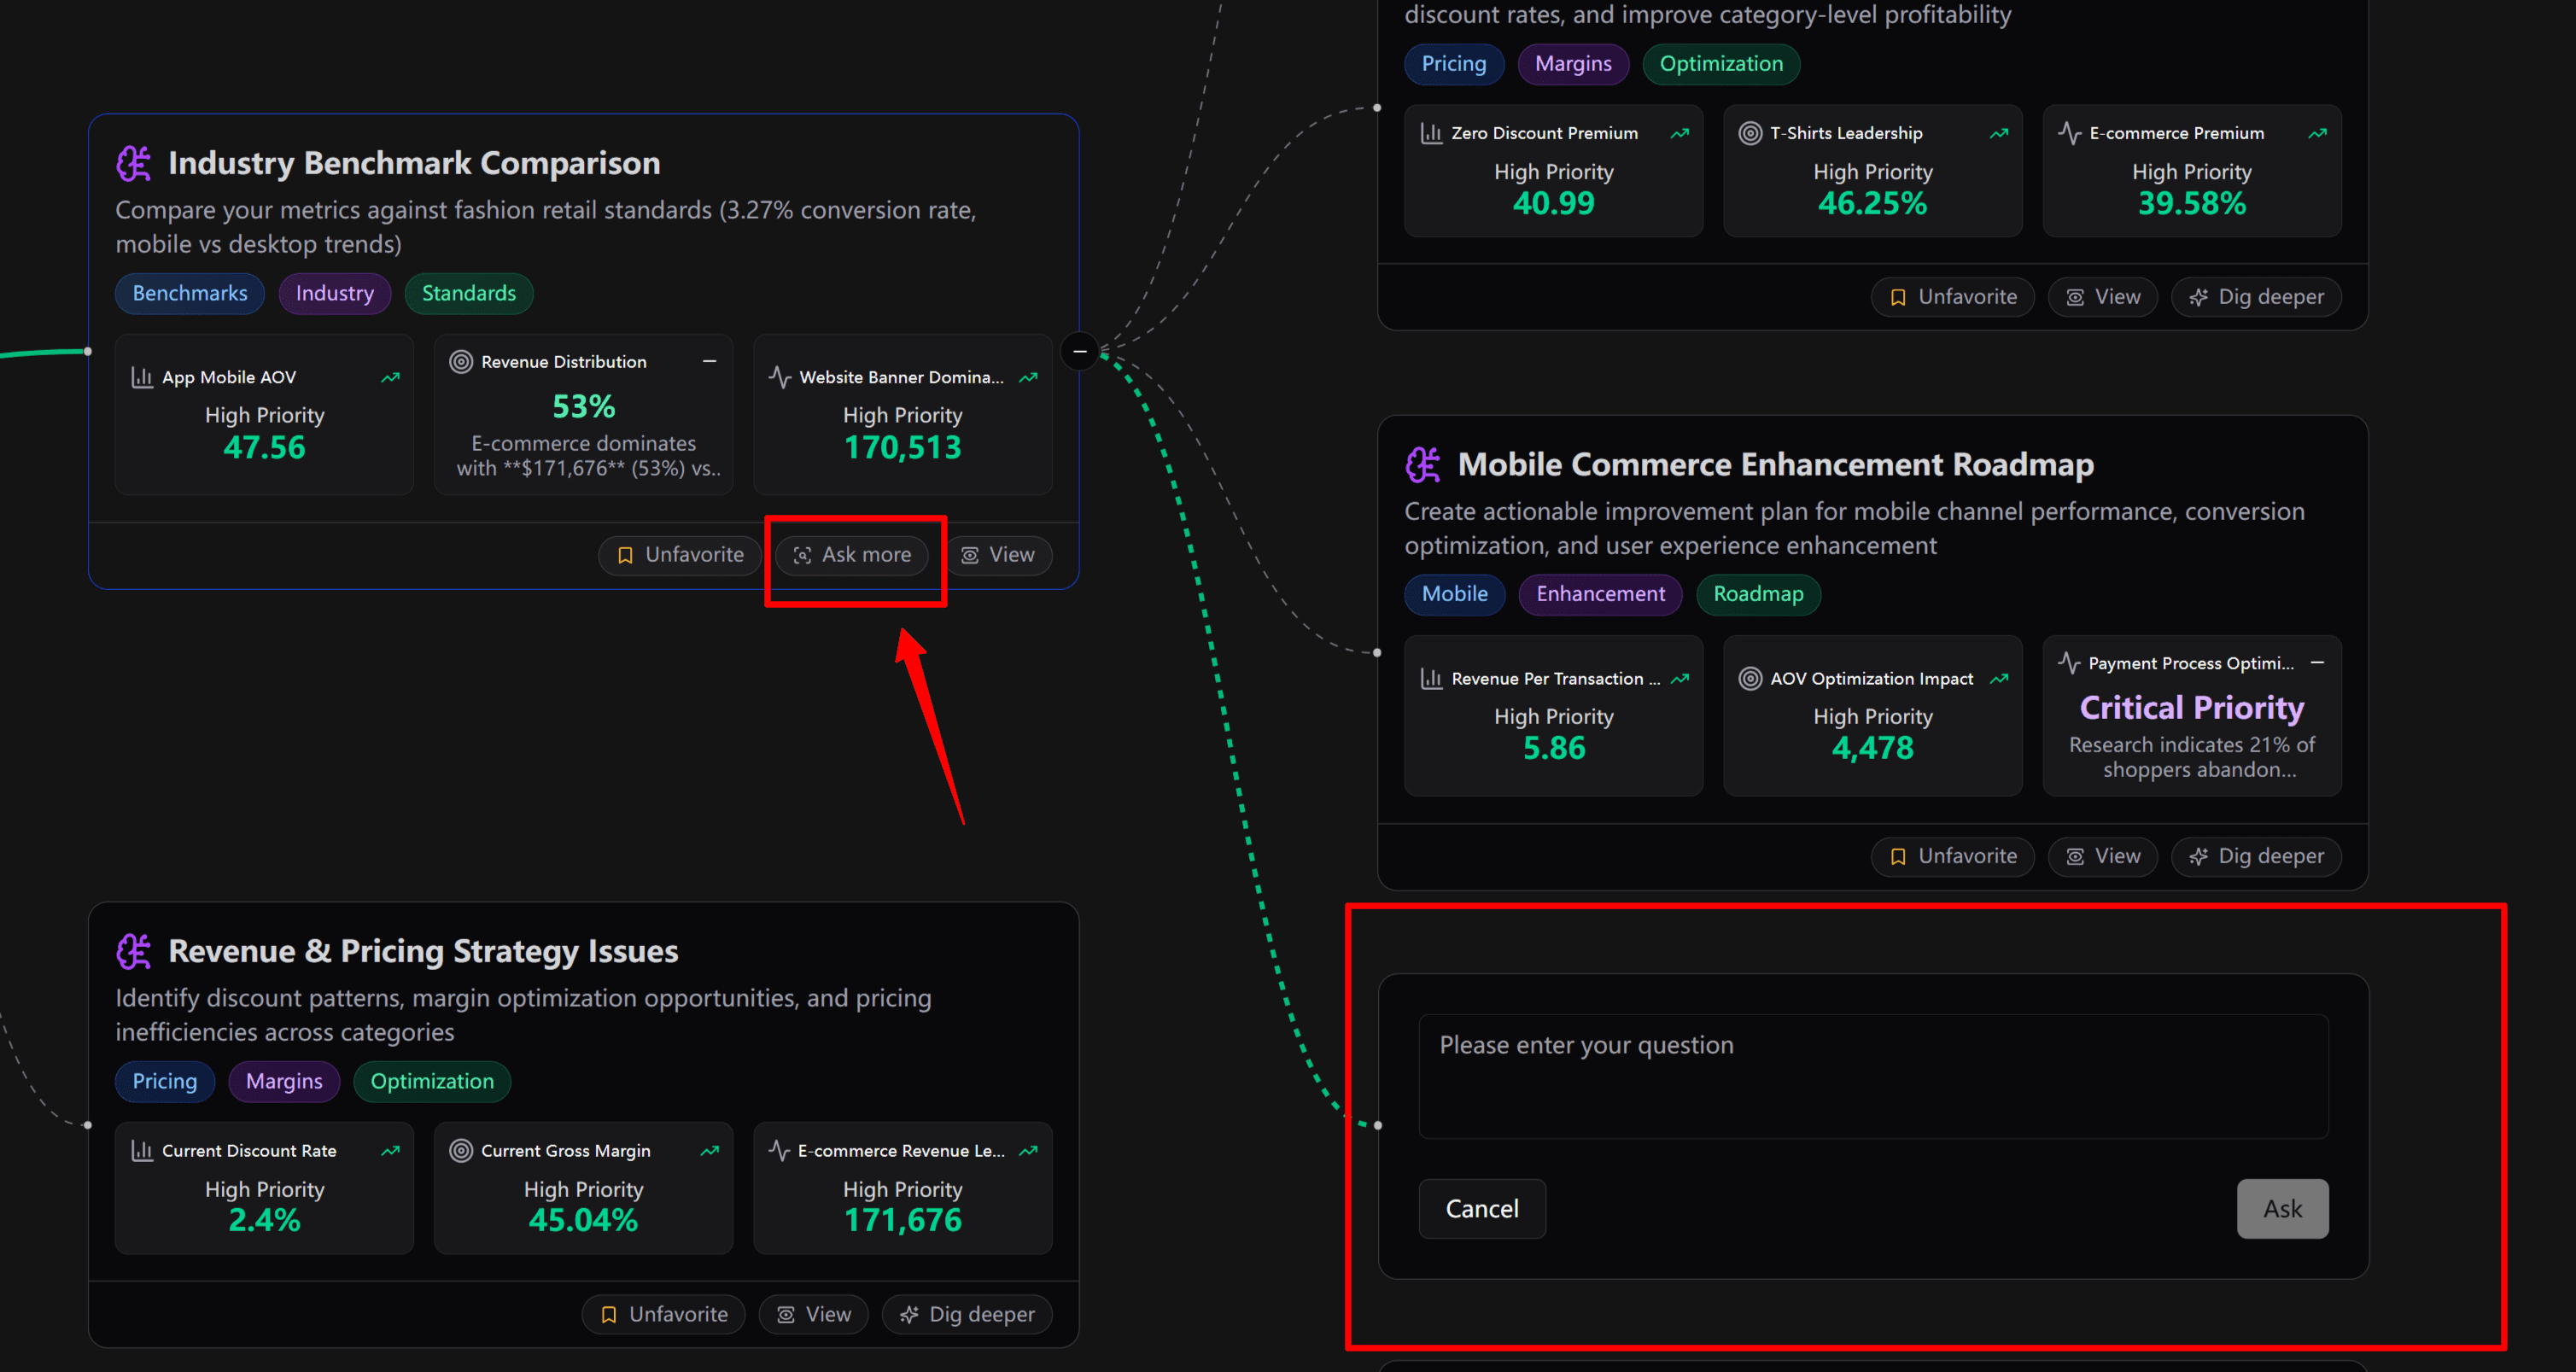
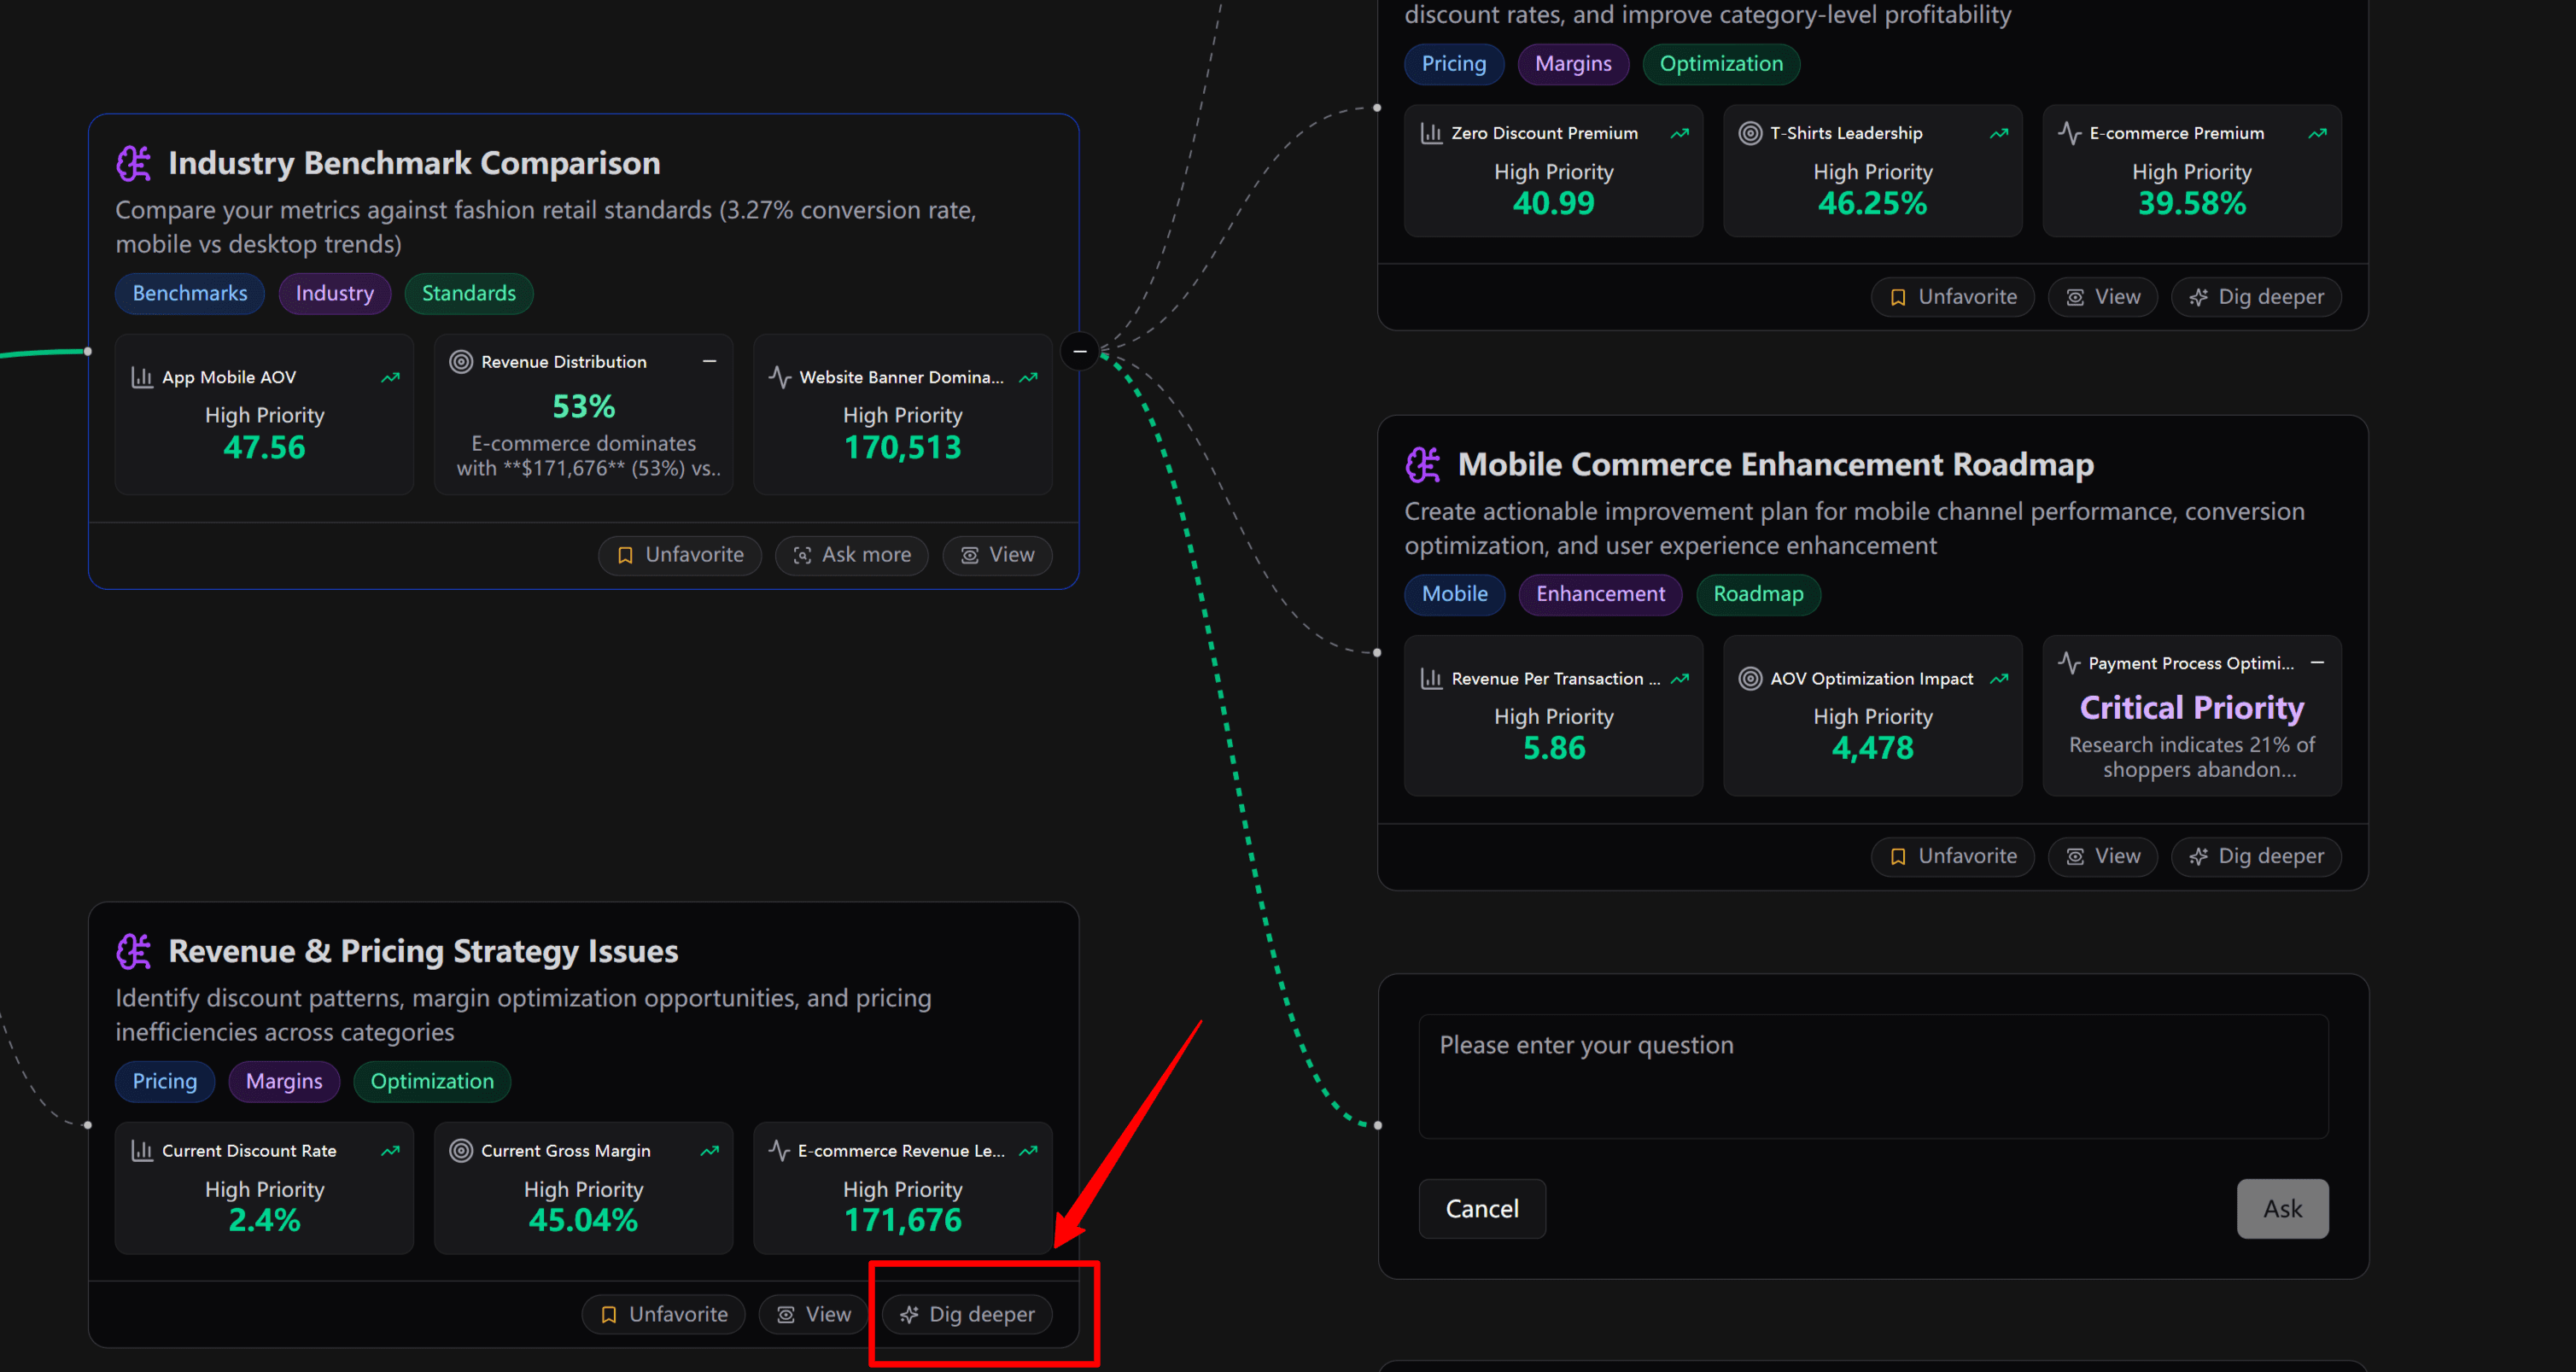
Found a direction you like? Click “Dig deeper” to continue diving deeper into that specific path. Bloom dynamically generates new insights based on your input, helping you move from curiosity to clarity.
Step 6: Generate Slides from Your Data Insights
When you're ready to wrap up your exploration and save your findings, you can generate a presentation in just one click.
Add to Favorites: Start by clicking the “Favorite” button on any insight you want to include.
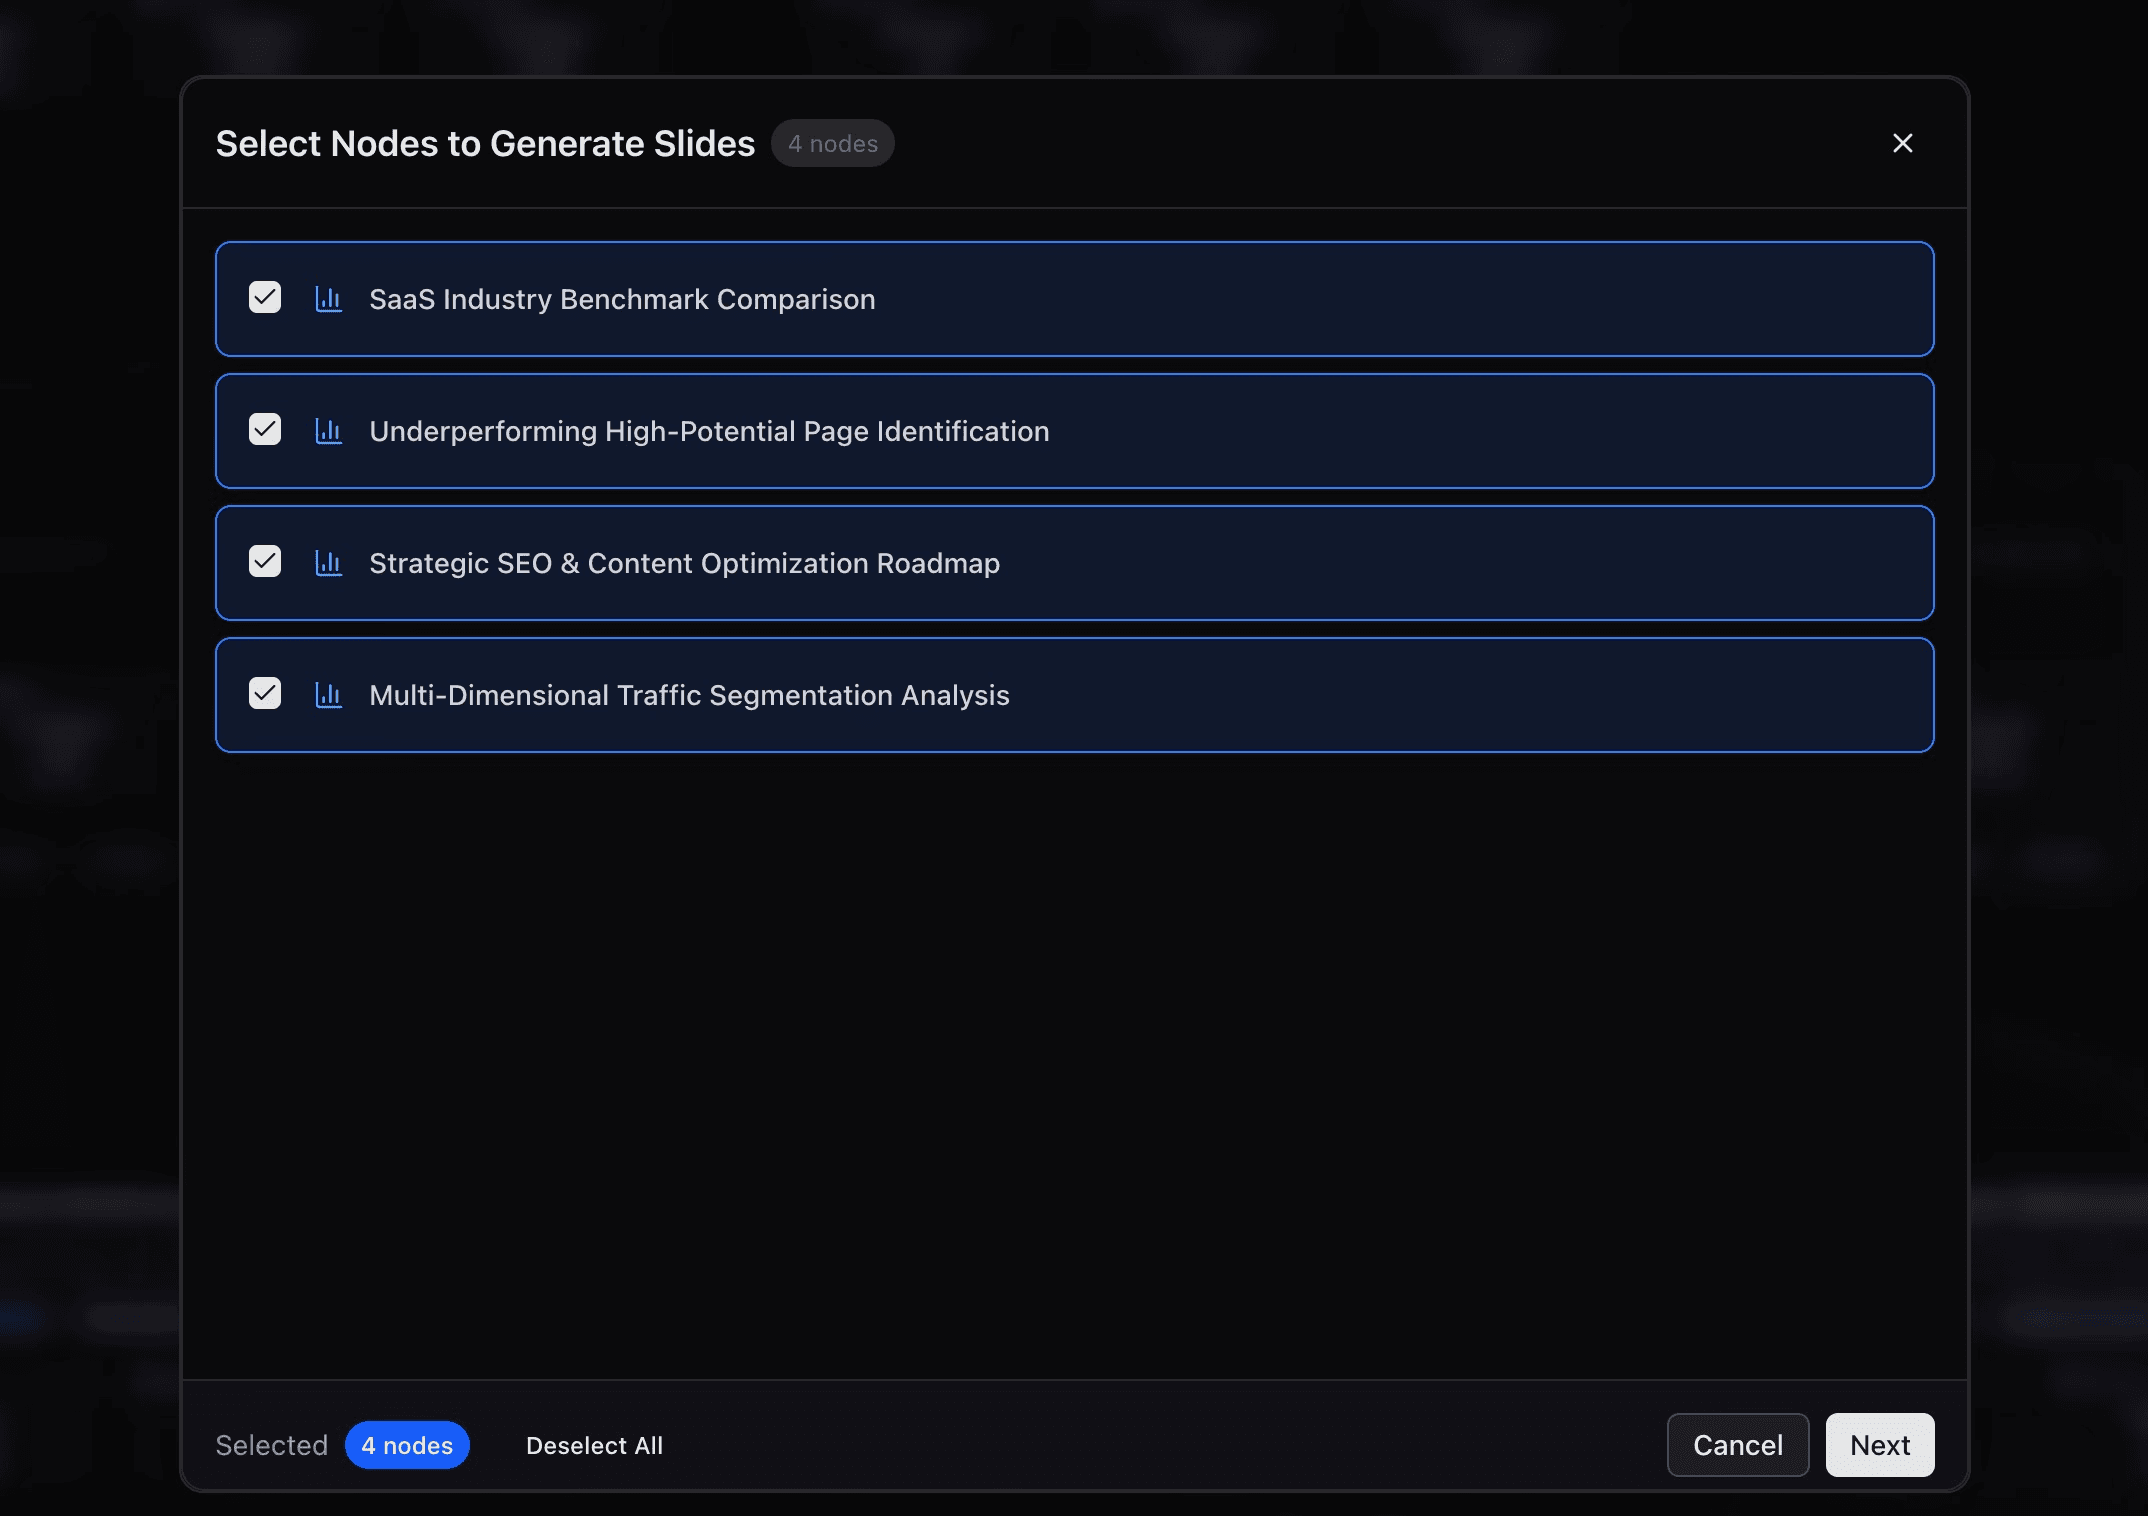
Go to the Favorites list at the bottom, then click the “Generate Slides” button in the top right corner. Select the nodes you want to export and hit Next.
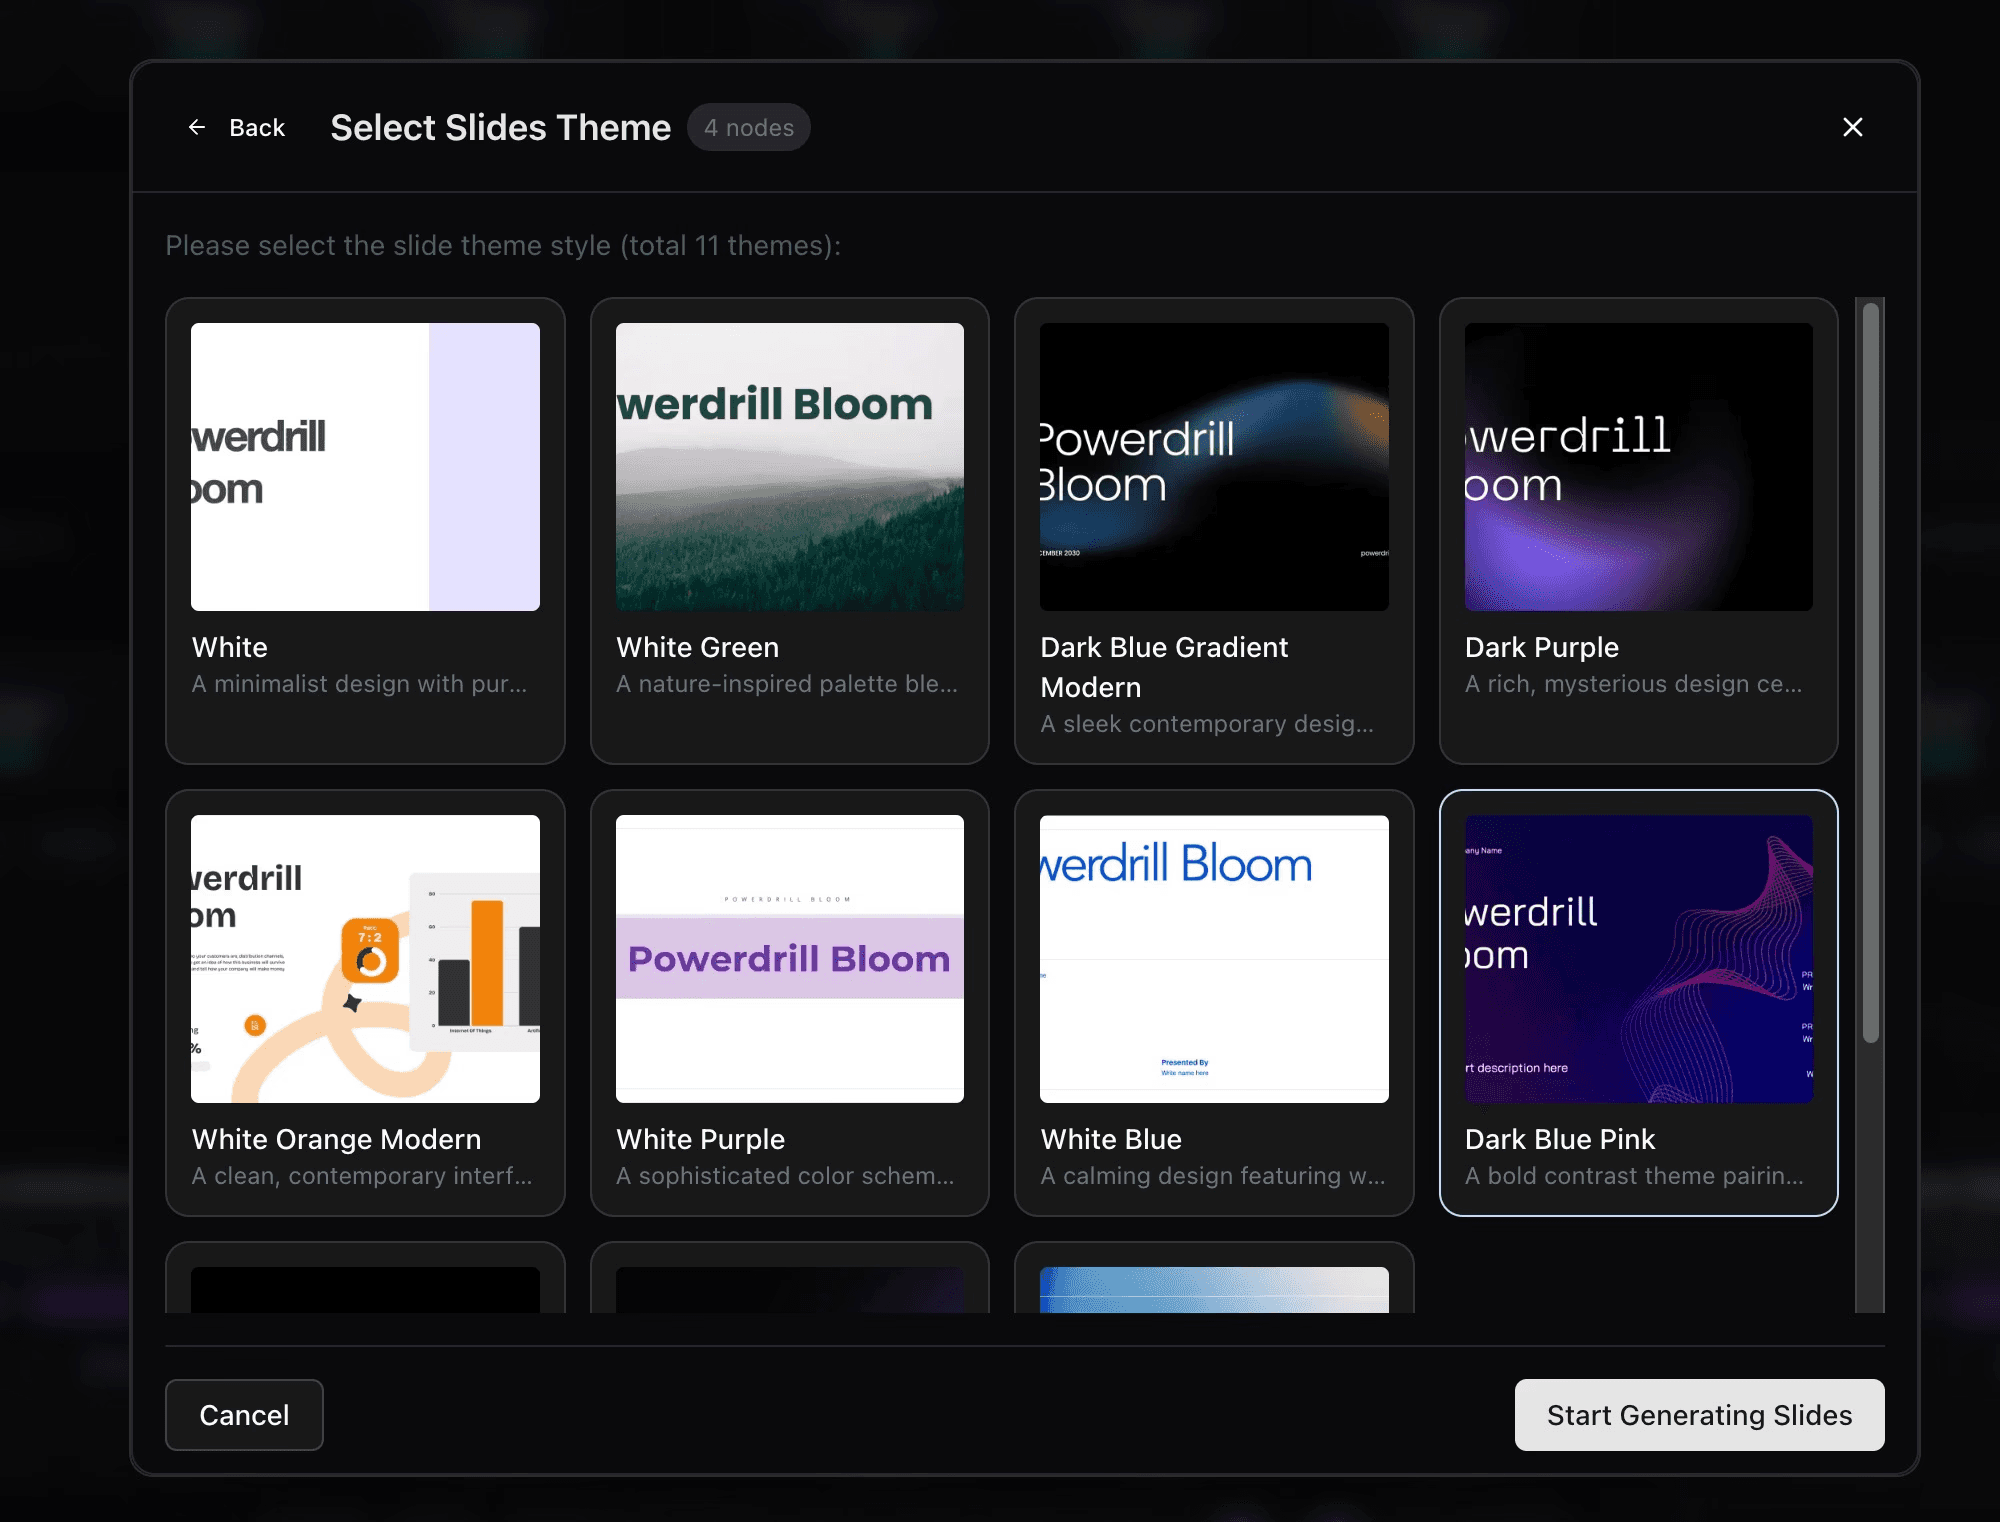
Choose your preferred slide style and wait about a minute. Once your slides are ready, the download will begin automatically.
Congratulations—you've just completed your analysis and created a full data report in slide format!
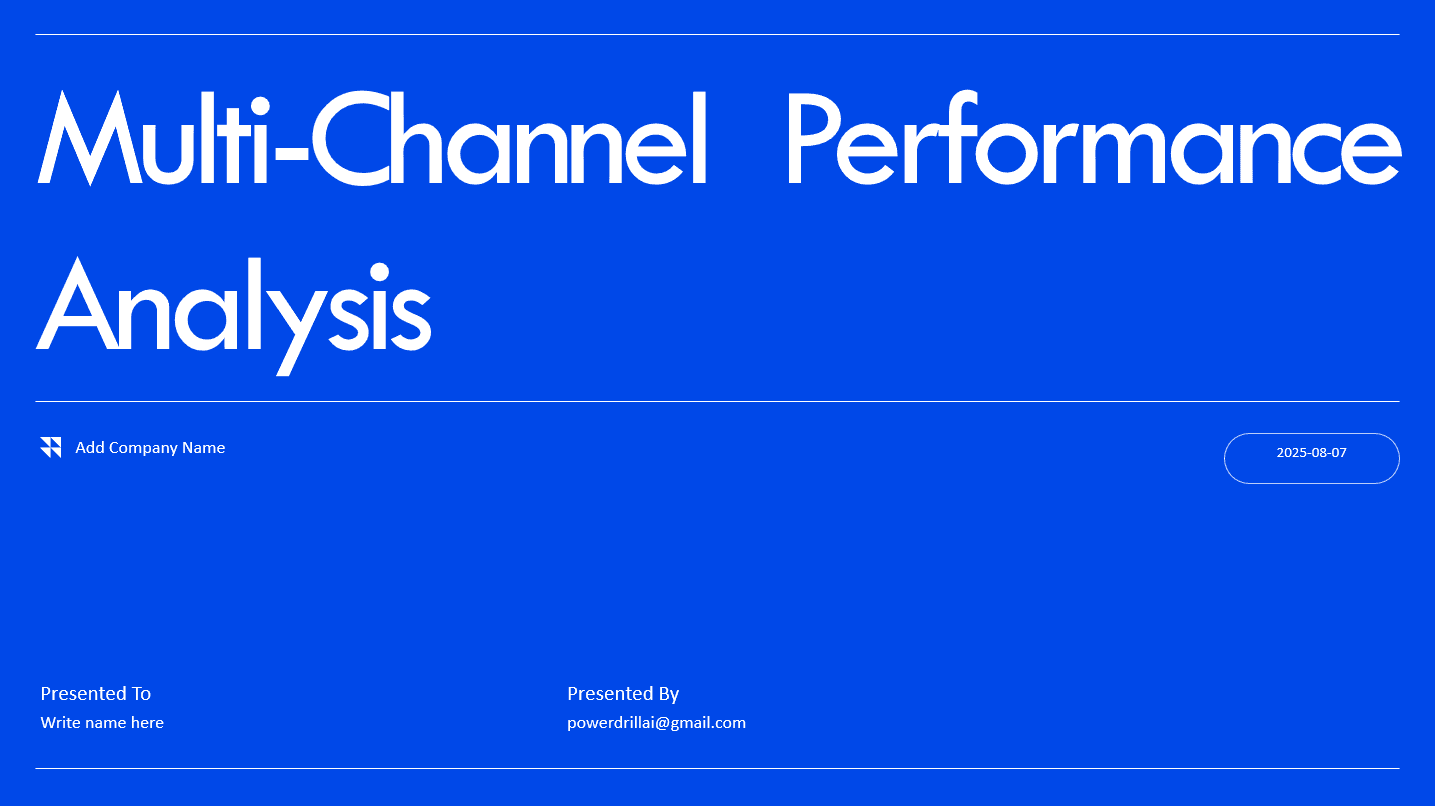
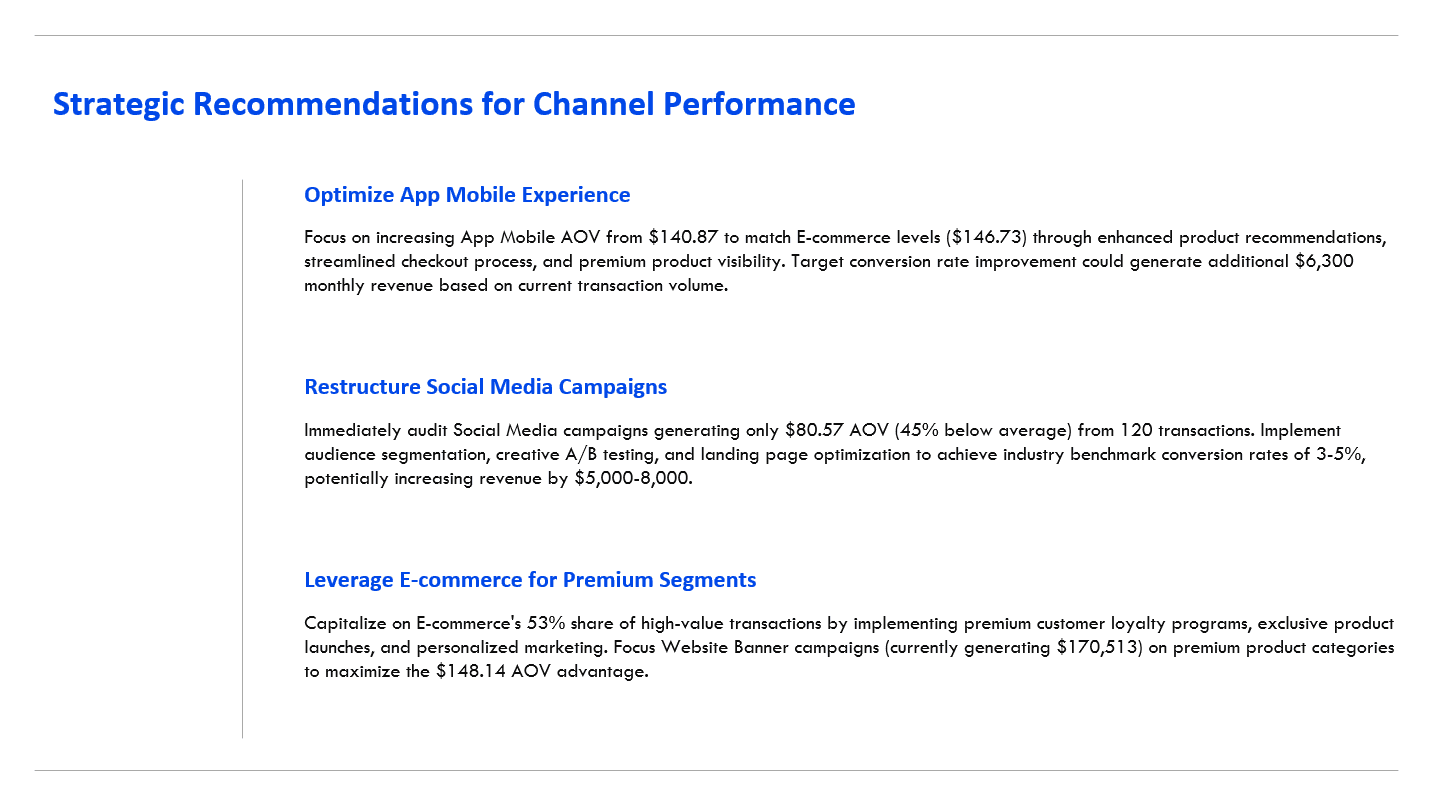
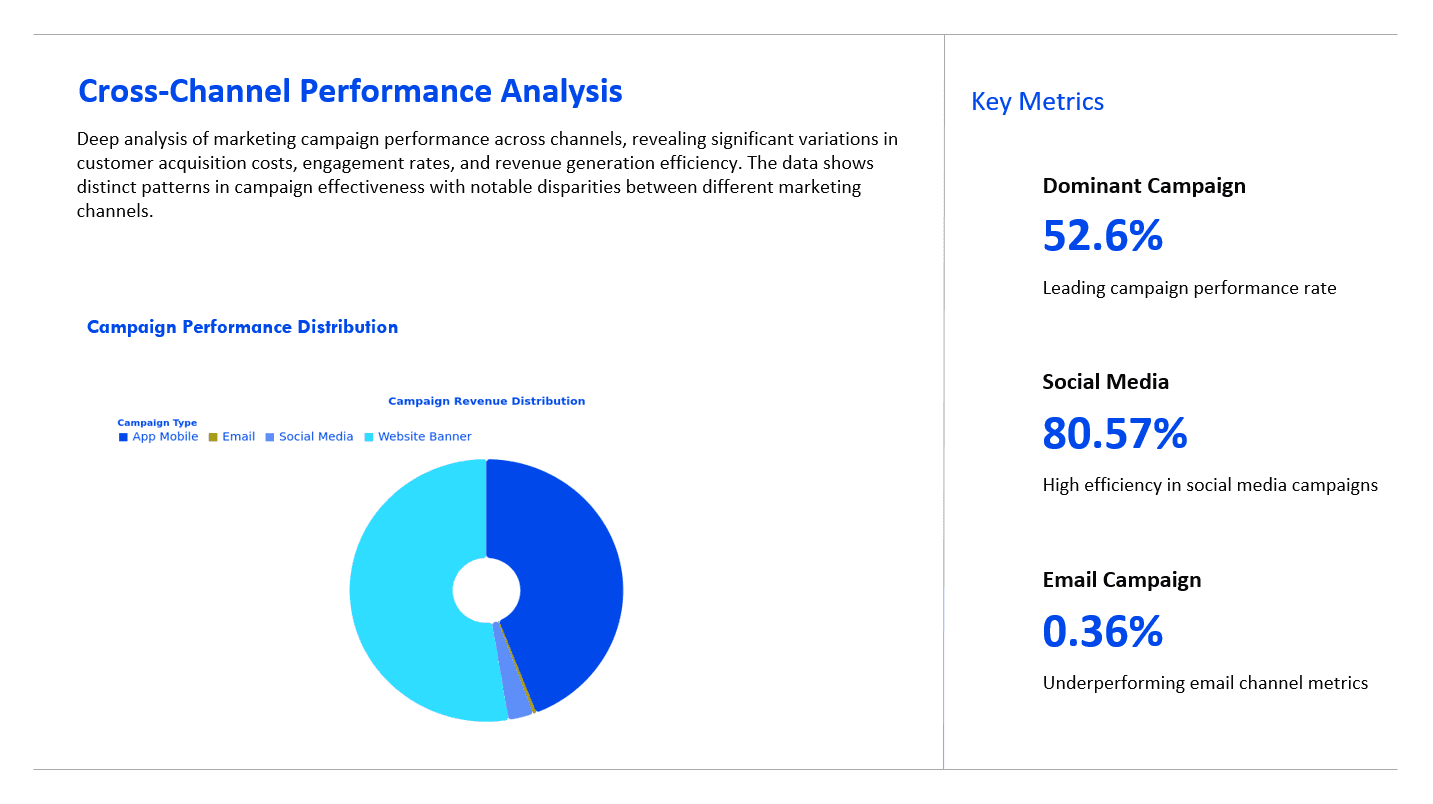
Here’s an example of what the generated slides look like:
Conclusion
Academic stress is not just a personal struggle but a systemic challenge that demands data-driven solutions. This open, diverse dataset on student stress levels across educational stages serves as a critical foundation for change—empowering educators, mental health professionals, and policymakers to move beyond assumptions and act on concrete insights. With continued contributions from students worldwide and the power of AI analysis to uncover hidden patterns, we’re one step closer to building educational environments that prioritize well-being as much as academic achievement. Every form submission strengthens this mission, turning individual experiences into collective progress.


