Global Economic Impact of a Federal Reserve September Rate Cut: Insights from Powerdrill Bloom
Joy

Introduction
In mid-September, all eyes are on the Federal Reserve as global markets anticipate a potential interest rate cut. For weeks, analysts, investors, and businesses have been debating what such a move would mean—not just for the U.S. economy, but for the entire global financial system.
History shows that Fed rate cuts ripple far beyond Wall Street. They reshape cross-asset correlations, drive major currency shifts, alter global trade balances, and reset investor appetite for both risk and safe-haven assets. In other words, a single policy decision in Washington can trigger a chain reaction that redefines economic trajectories worldwide.
To better understand these dynamics, we used Powerdrill Bloom to conduct an AI-driven topic exploration: “Everyone is predicting that the Federal Reserve will cut interest rates in mid-September. If that happens, what changes will it bring to the global economy?”
The following sections break down the results into three core areas—multi-asset market responses, USD depreciation and trade impacts, and safe-haven rotations—while also highlighting actionable strategies for businesses and investors.
How to Get Started with Powerdrill Bloom
Sign in to Powerdrill Bloom.
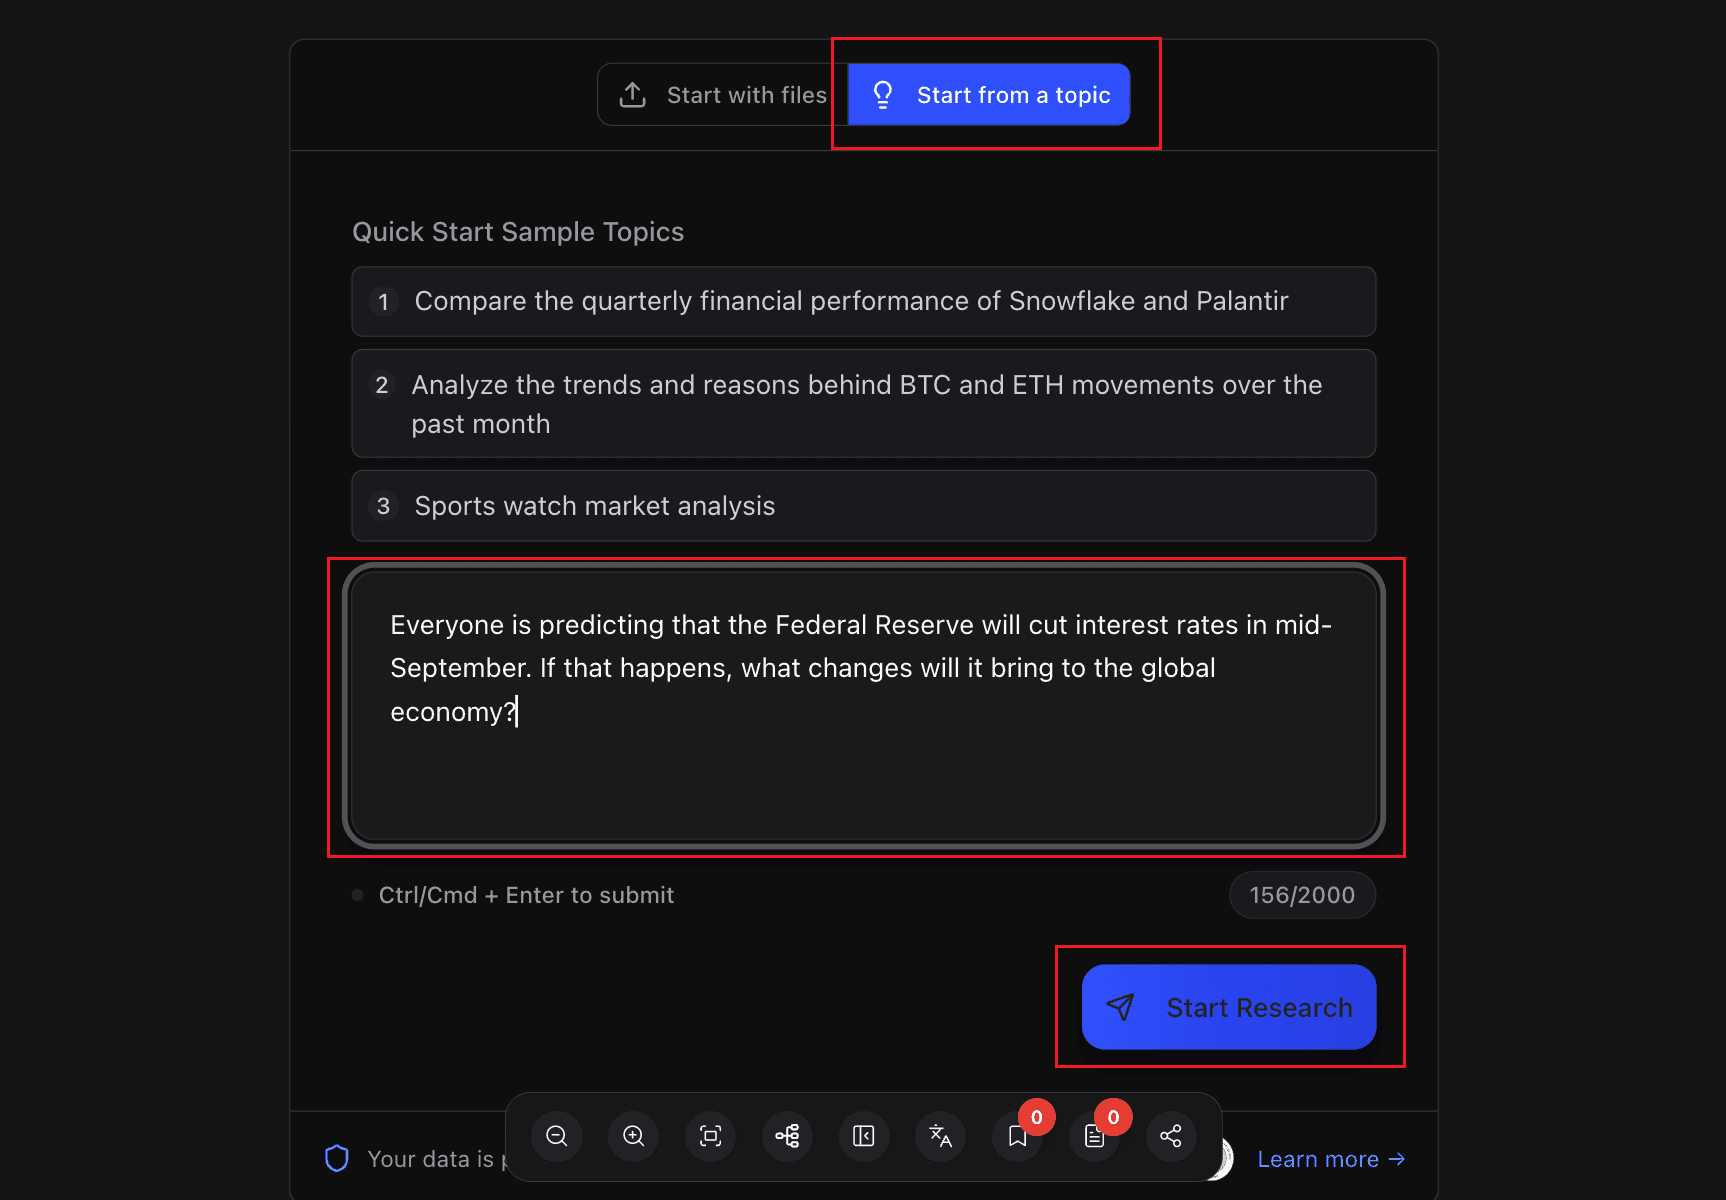
Click Start Blooming, then choose Start from a topic, enter your topic, and click Start Research.
For example: Everyone is predicting that the Federal Reserve will cut interest rates in mid-September. If that happens, what changes will it bring to the global economy?
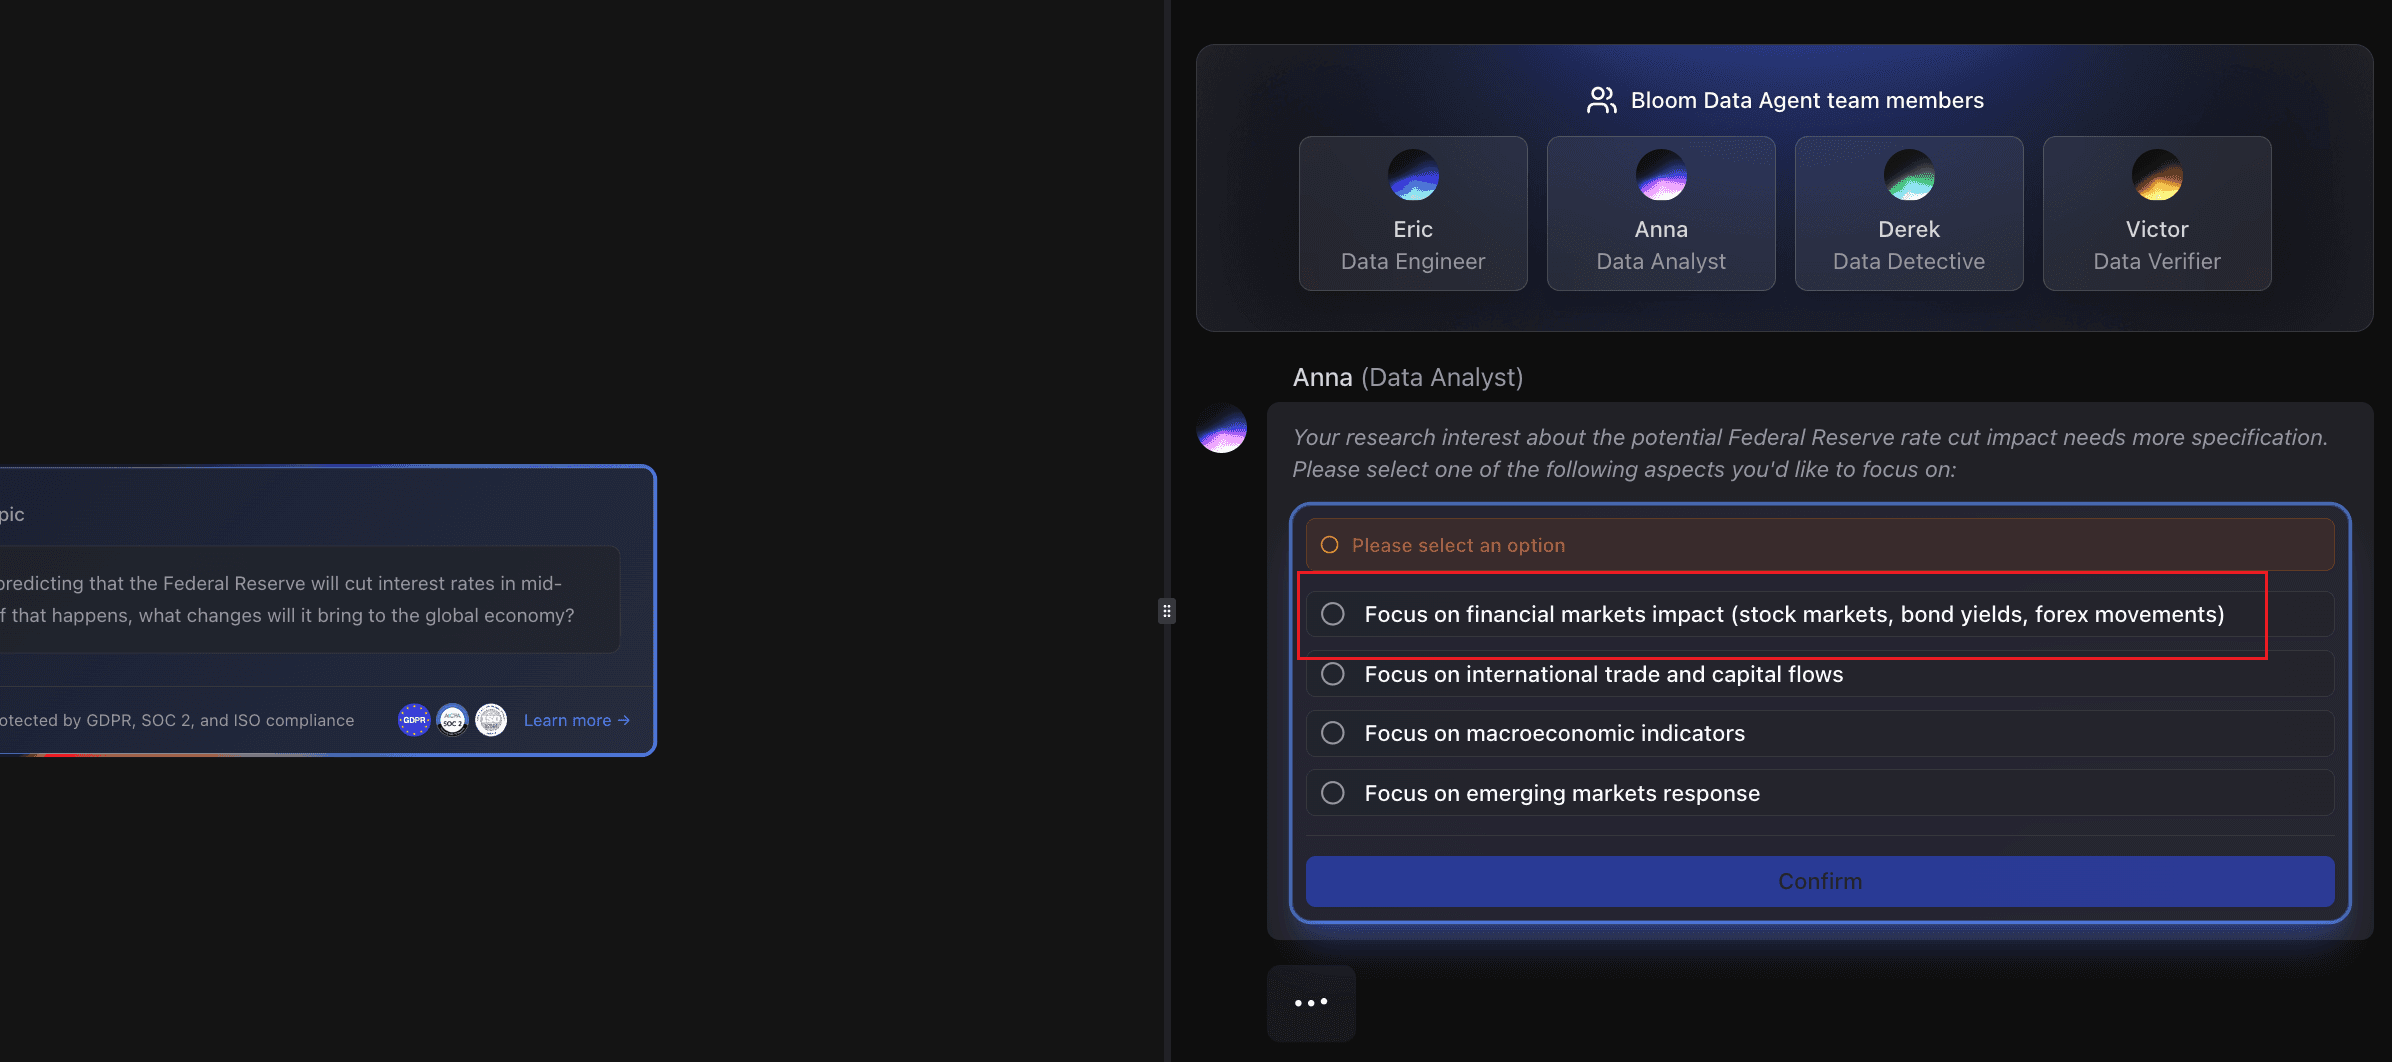
Choose the option you're interested in, and click Confirm.
For example: Focus on financial markets impact (stock markets, bond yields, forex movements)
Let's see the results Powerdrill Bloom presents.
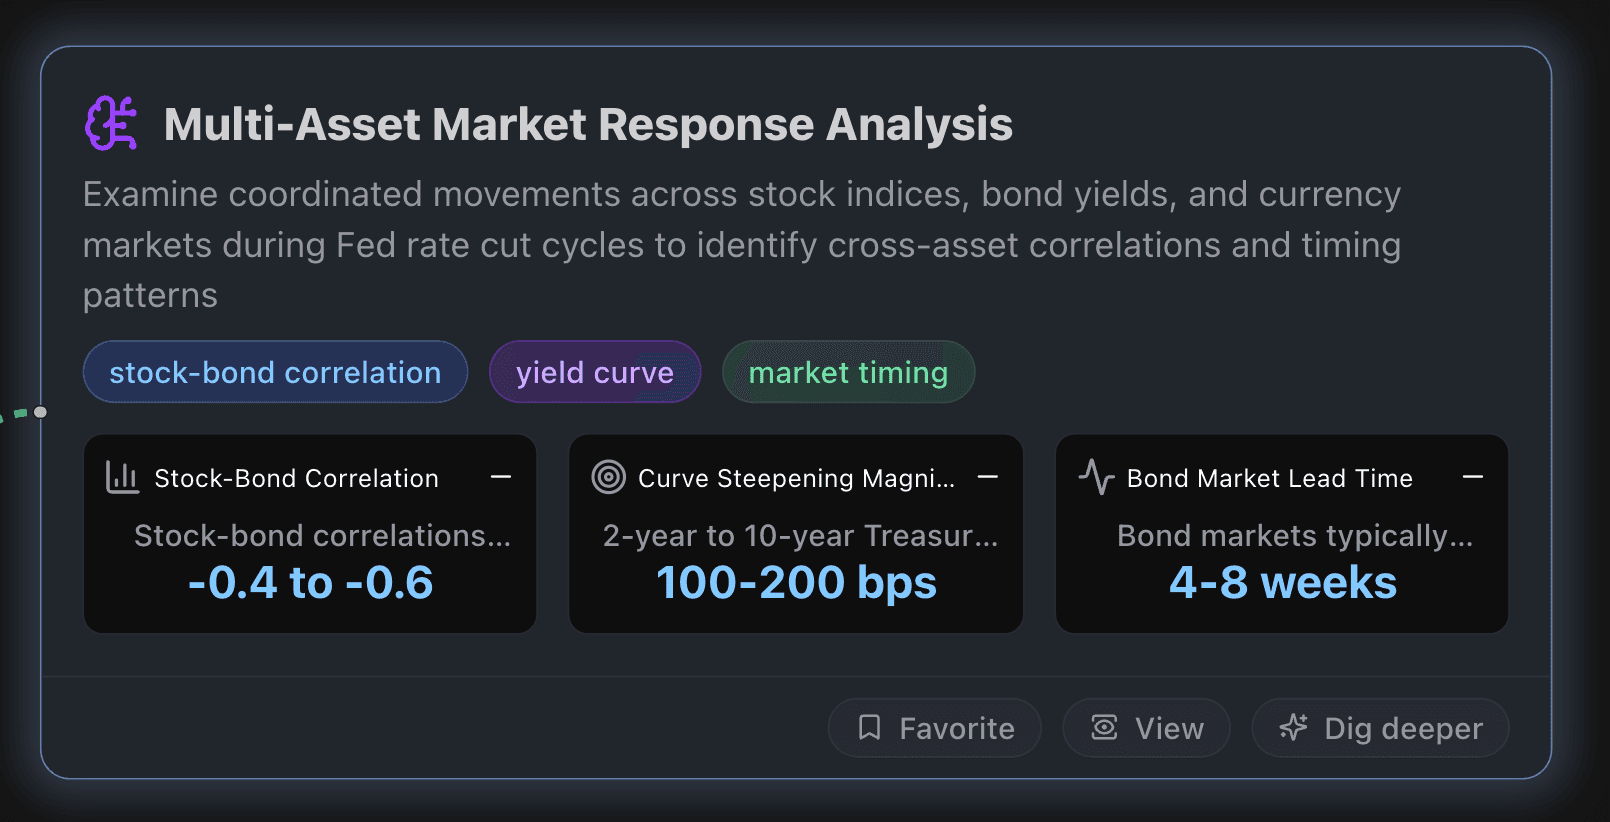
Multi-Asset Market Response Analysis
This node examines coordinated movements across stock indices, bond yields, and currency markets during Fed rate cut cycles to identify cross-asset correlations and timing patterns.
Key Metrics
Stock-Bond Correlation
Stock-bond correlations typically shift from positive (+0.2 to +0.4) to strongly negative (-0.4 to -0.6) during Fed rate cut anticipation periods. Current data shows this reversal occurring as 10-year Treasury yields approach 4.5% threshold, indicating investors begin treating bonds and stocks as substitutes rather than complements during monetary easing cycles.
Curve Steepening Magnitude
2-year to 10-year Treasury spread typically steepens by 100-200 basis points during Fed cutting cycles as short-term yields fall more rapidly than long-term rates. Current inverted curve of -50 bps suggests potential for significant steepening as markets anticipate September cuts, historically taking 6-12 months to reach normal positive slope of 150-250 bps.
Bond Market Lead Time
Bond markets typically price in Fed rate cuts 4-8 weeks before announcement, with 2-year Treasury yields declining 50-100 bps during anticipation phase. Current market pricing shows 95%+ probability of September cuts already reflected in yield curve, indicating bonds have front-run the Fed decision by approximately 6 weeks based on economic data deterioration.
Actionable Insights
Implement Cross-Asset Hedging Strategy: Given historical correlation patterns showing stock-bond correlations shifting from positive to strongly negative (reaching -0.4 to -0.6) during Fed cut cycles, construct portfolios that capitalize on this relationship. Allocate 60-70% stocks and 25-30% long-duration Treasurys to benefit from both equity appreciation and bond rally dynamics, while using the negative correlation as natural hedge during volatility periods.
Execute Sector Rotation with 2-8 week Lead: Position defensively ahead of Fed cuts by rotating into rate-sensitive sectors including utilities, REITs, and small-cap value stocks 2-8 weeks before anticipated cuts. Historical data shows these sectors outperform growth/tech during cutting cycles, with homebuilders and financials showing 15-25% relative outperformance in the 6 months following rate cut initiation.
Capitalize on Currency Timing Arbitrage: Leverage the 3-6 month USD weakening cycle by establishing positions in emerging market currencies and international equity ETFs. Historical patterns show 2-4% dollar decline against major currencies and 5-8% gains in emerging markets during Fed cutting cycles, with peak currency moves occurring in months 2-4 post initial cut.
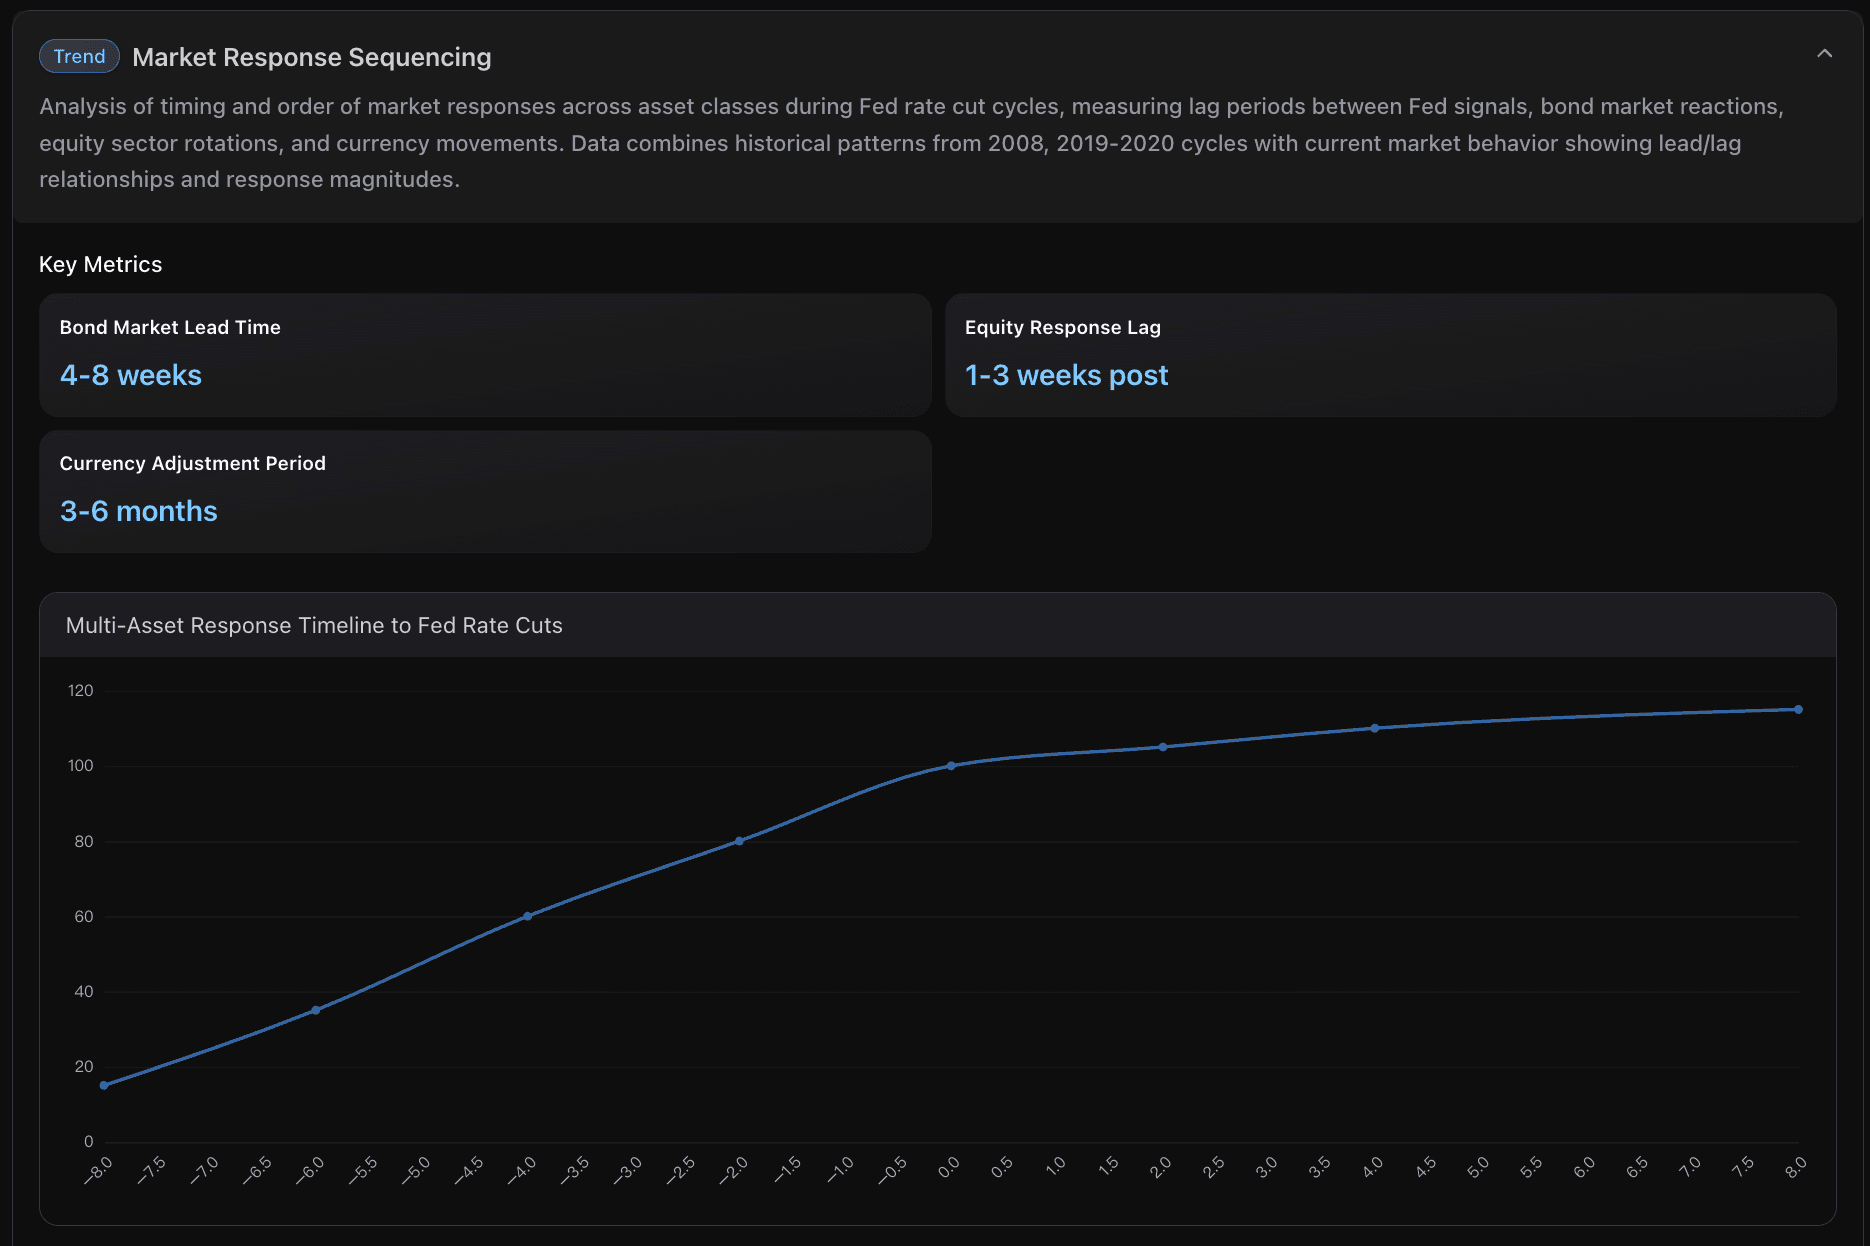
Data Visualization
Below is a data visualization example:
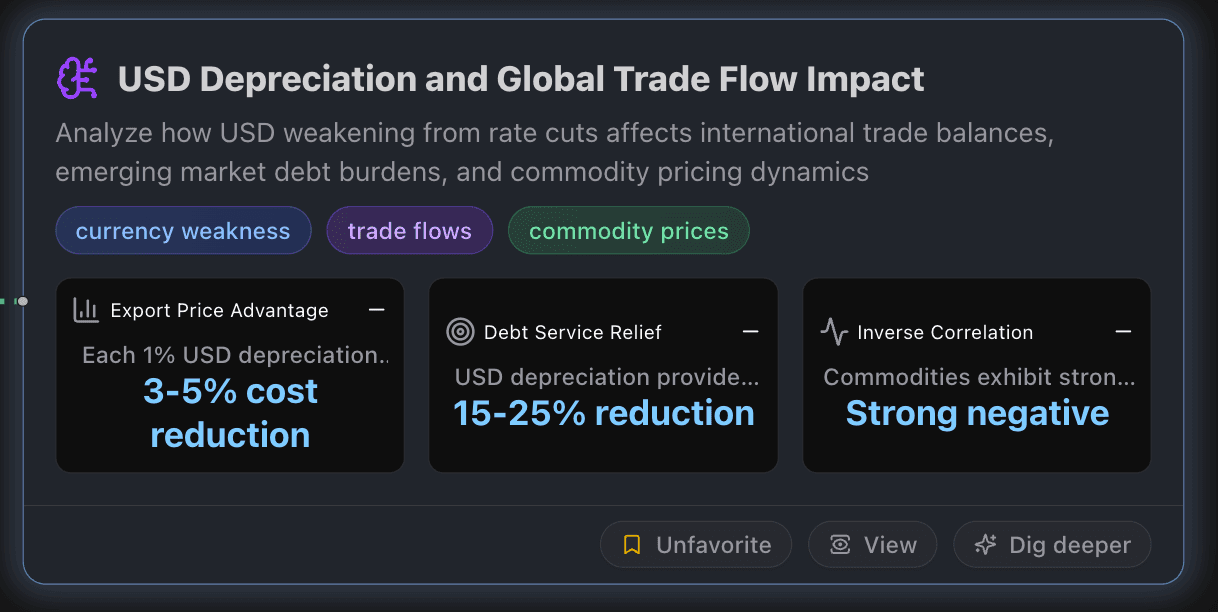
USD Depreciation and Global Trade Flow Impact
This node analyzes how USD weakening from rate cuts affects international trade balances, emerging market debt burdens, and commodity pricing dynamics.
Key Metrics
Export Price Advantage
Each 1% USD depreciation typically provides 3-5% price competitiveness boost for US exports, making American goods more attractive in international markets while simultaneously increasing import costs by similar margins, creating natural trade balance improvement incentives.
Debt Service Relief
USD depreciation provides 15-25% debt service cost relief for emerging markets with dollar-denominated obligations, significantly reducing financial stress for countries like Brazil, Thailand, and others managing substantial external debt portfolios.
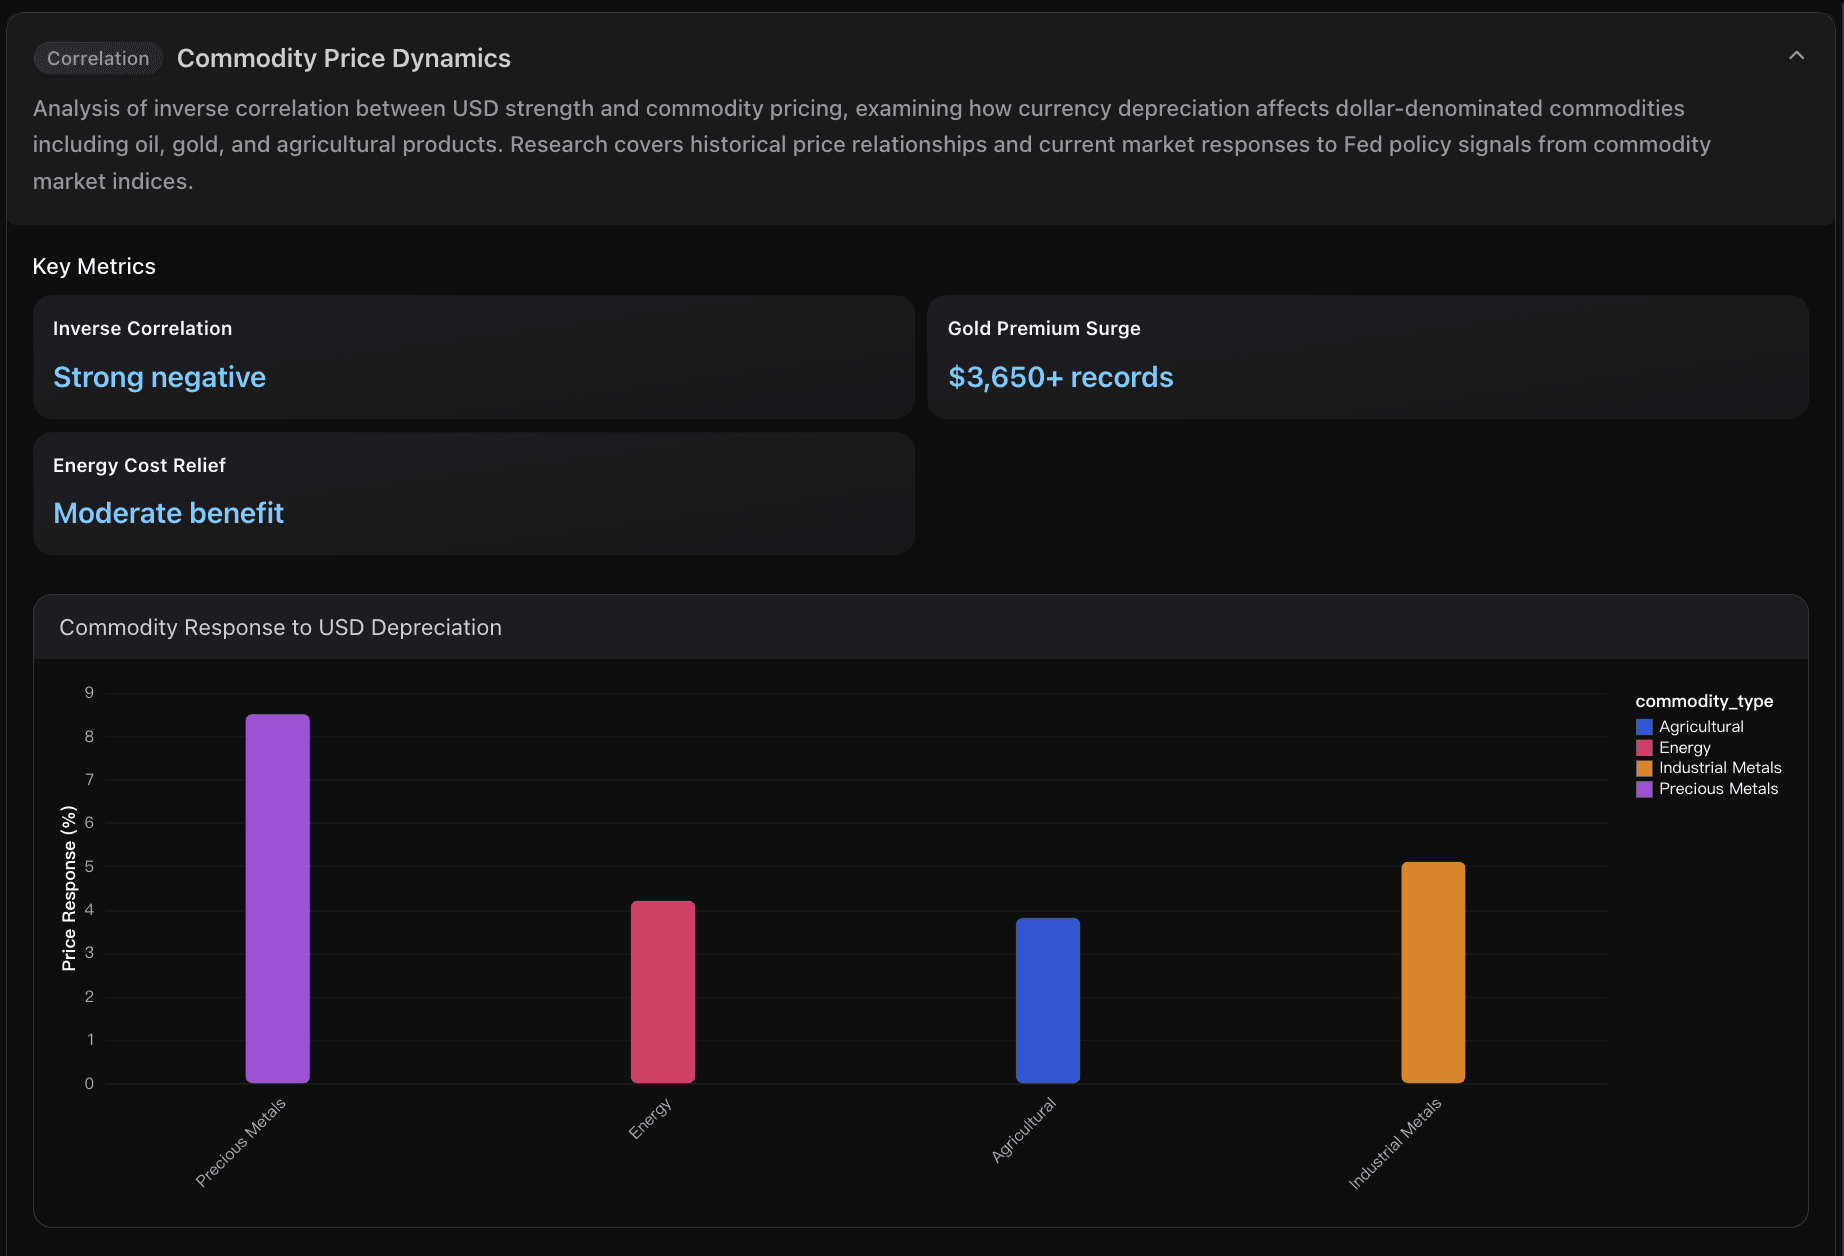
Inverse Correlation
Commodities exhibit strong inverse correlation with USD strength, with Bloomberg Commodity Index typically rising 2-4% for every 1% sustained dollar depreciation. This relationship stems from commodities being priced in dollars globally, making them cheaper for foreign buyers when USD weakens.
Actionable Insights
Export Business Expansion Strategy: Companies should capitalize on the 3-5% cost advantage from USD depreciation by aggressively pursuing international market expansion, particularly in Europe and Asia where price competitiveness has improved significantly. Focus on sectors like manufacturing, technology, and agriculture where currency advantages translate directly to market share gains. Timeline: 6-12 months to see material revenue impact.
Emerging Market Investment Reallocation: Investors should consider increasing emerging market exposure, given the 17% equity gains and best currency performance since 2009. The 15-25% debt service relief for EM countries creates a fundamental improvement in credit profiles and growth prospects. Diversify across Latin America, Southeast Asia, and Eastern Europe for optimal currency and economic exposure benefits.
Commodity Hedging and Positioning: Businesses with significant commodity exposure should adjust procurement strategies to benefit from the strong inverse correlation between USD and commodity prices. Consider strategic purchases of gold (targeting $3,800 levels) and energy commodities for cost management. Manufacturing companies should lock in favorable input costs while the dollar remains weak, as this window may close when Fed policy shifts.
Data Visualization
Below is a data visualization example:
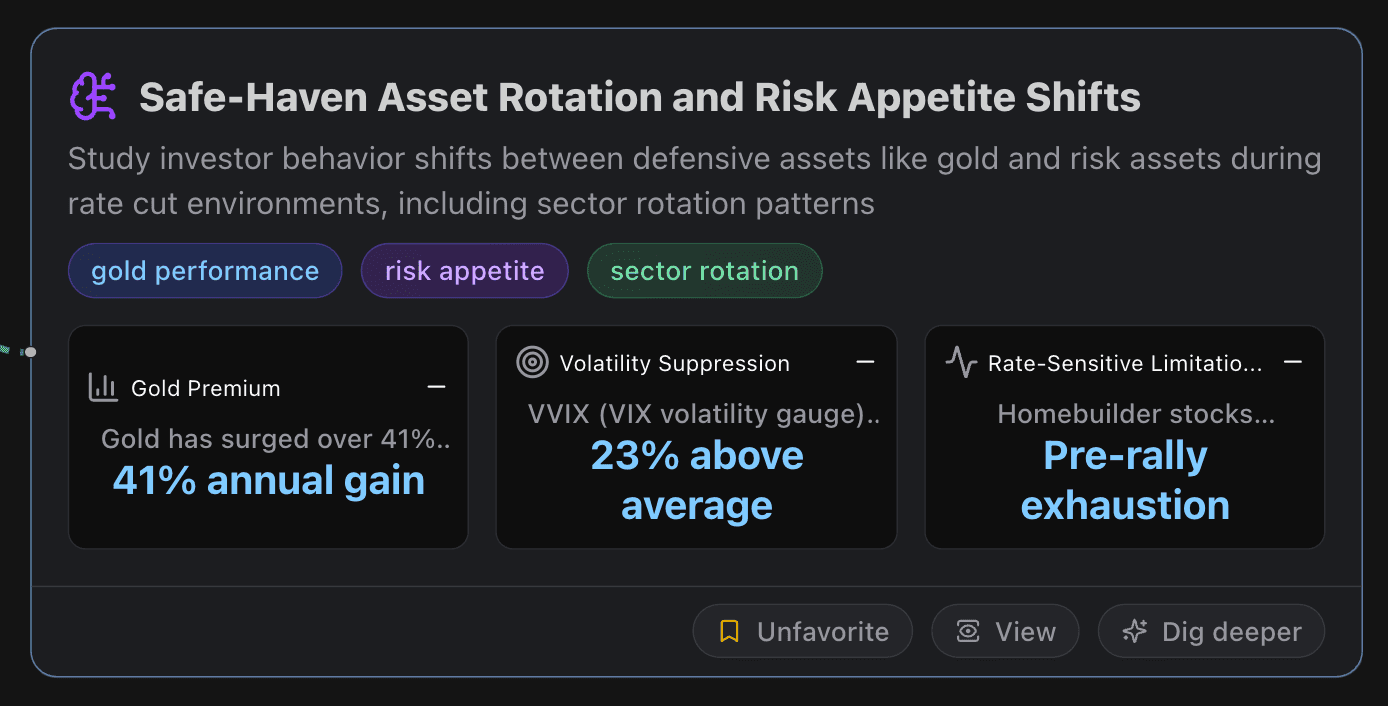
Safe-Haven Asset Rotation and Risk Appetite Shifts
This node studies investor behavior shifts between defensive assets like gold and risk assets during rate cut environments, including sector rotation patterns.
Key Metrics
Gold Premium
Gold has surged over 41% annually, breaking the $3,650 barrier for the first time in history as Fed rate cut expectations fuel demand. UBS forecasts $3,800/oz by end-2025, up from previous $3,500/oz target. Historical data shows gold increased over 60% during 1973-1974 rising rate periods, demonstrating its complex relationship with interest rates.
Volatility Suppression
VVIX (VIX volatility gauge) hovers 23% above one-year average, indicating underlying market tension despite surface calm. Rate cut expectations typically suppress VIX levels as uncertainty about Fed policy direction decreases, but elevated VVIX suggests potential for sudden volatility spikes.
Rate-Sensitive Limitation
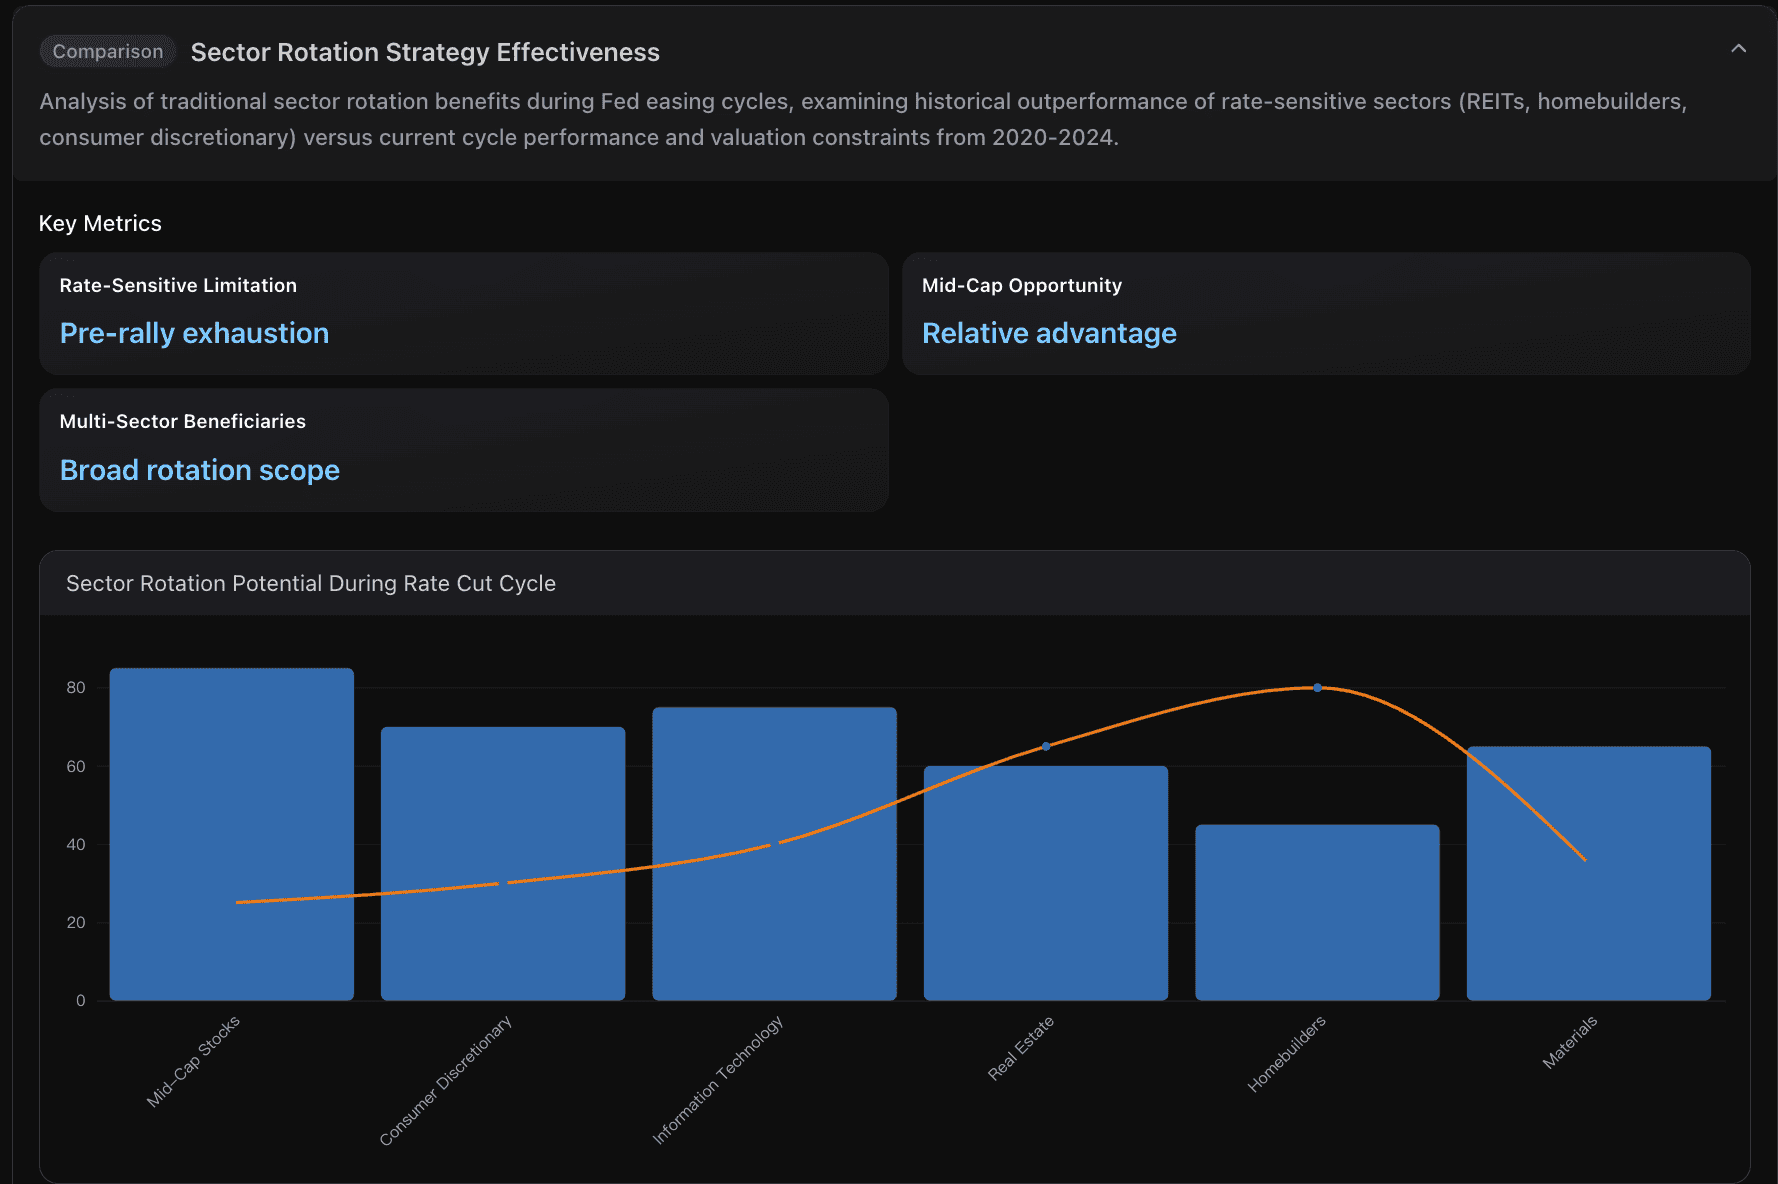
Homebuilder stocks historically outperform during Fed easing cycles, but mortgage rates already fell to two-year lows near 5.75-6%, limiting further improvement potential. Elevated valuations compared to prior rate-cutting cycles suggest much anticipated benefit already priced in.
Actionable Insights
Diversify Safe-Haven Strategy Beyond Traditional Bonds: Given gold's exceptional 41% annual performance versus diminishing bond appeal, consider reallocating safe-haven exposure from traditional Treasury securities to a mixed portfolio including gold ETFs and defensive equity sectors. Gold's ability to reach $3,650/oz during rate cut anticipation demonstrates its superior hedging properties compared to bonds, which investors are increasingly 'ditching' in favor of alternative safe havens.
Capitalize on Mid-Cap Rate Sensitivity While Avoiding Overvalued Sectors: Focus investment flows toward mid-cap stocks and rate-sensitive sectors that haven't already priced in Fed easing benefits. Avoid homebuilders trading at elevated valuations with mortgage rates already near 5.75-6% targets. Mid-caps offer optimal balance between rate cut benefits and valuation reasonableness, positioning for potential S&P 500 outperformance during the easing cycle.
Monitor Risk Appetite Bifurcation for Tactical Allocation: Track the contradiction between cryptocurrency surge above $112,000 Bitcoin and simultaneous defensive sector rotation with utilities gaining +13%. This market bifurcation suggests different time horizons: use short-term risk-on positioning for immediate rate cut benefits while maintaining defensive core holdings for potential economic slowdown scenarios that could trigger the rate cuts.
Data Visualization
Below is a data visualization example:
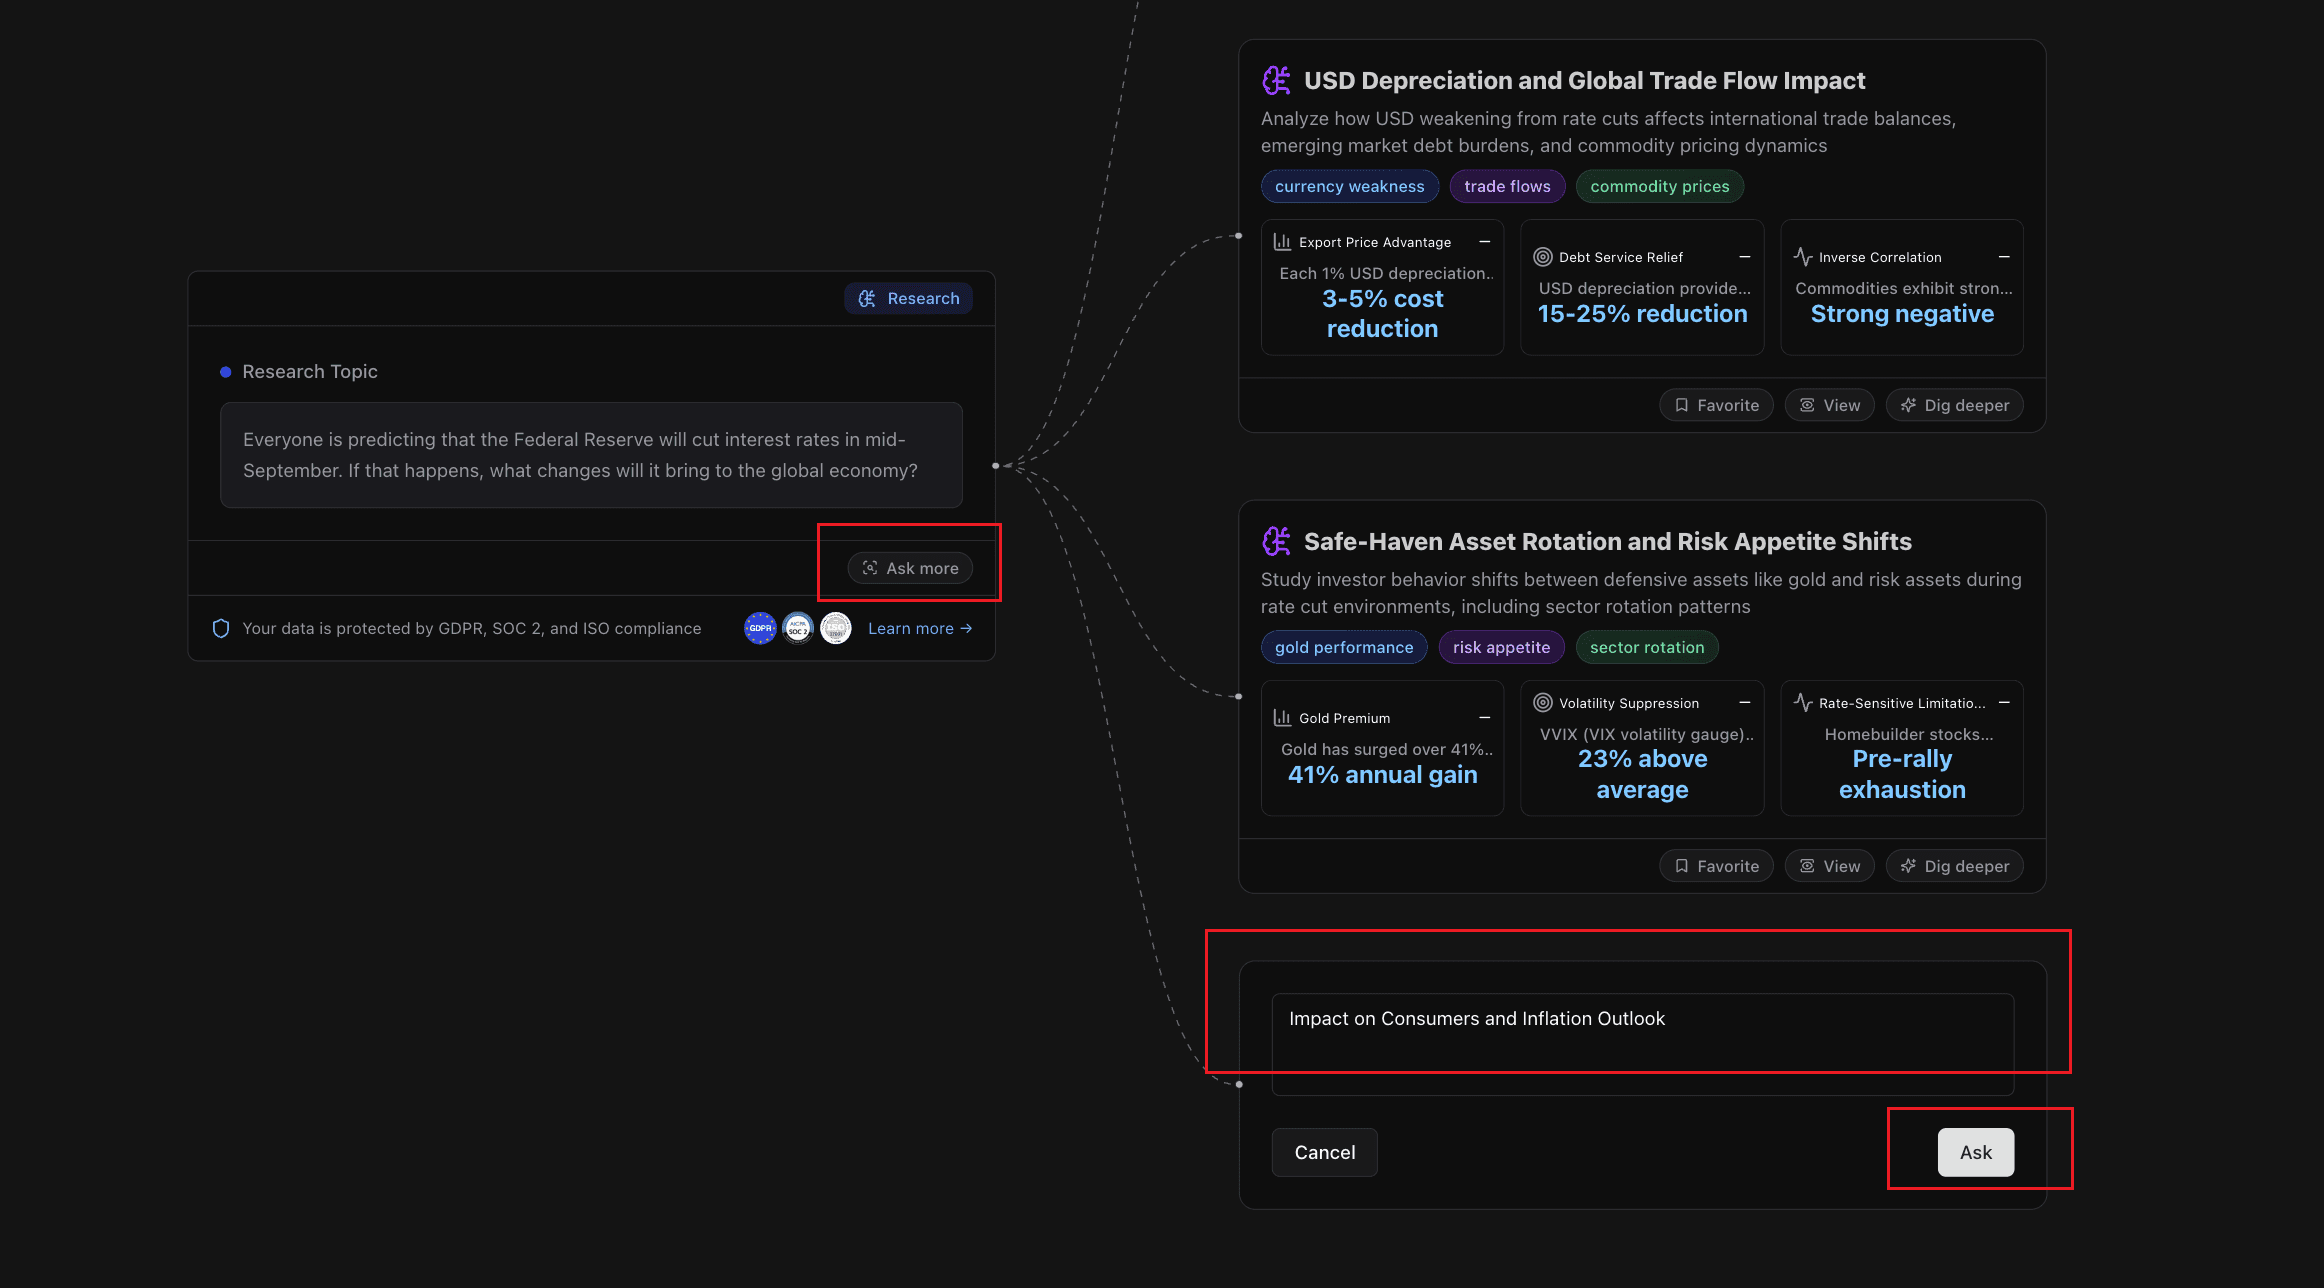
Impact on Consumers and Inflation Outlook
If you think the three nodes of the first layer are not exactly the directions you want to know, just click "Ask more", and enter your own question, for example, "Impact on Consumers and Inflation Outlook".
What consumers would likely feel first:
Credit cards and HELOCs: Most are tied to the prime rate, which typically moves one-for-one with the fed funds rate. A single cut would trim borrowing costs by about 25–50 bps depending on the move size. For a revolving balance of 5,000 dollars, a 25 bps drop saves roughly 1–2 dollars per month in interest; small per month but meaningful over time.
Auto loans: Lenders reprice more gradually, but new-loan APRs typically ease by 15–40 bps over 1–2 months if funding costs fall and credit risk is stable. On a 35,000-dollar, 60‑month loan, 25 bps lower APR saves around 3–5 dollars per month.
Mortgages: Thirty‑year mortgage rates track long-term yields more than the policy rate. If the cut lowers the 10‑year yield, new mortgage quotes could fall by 10–30 bps near term. Rule‑of‑thumb: each 25 bps lower rate saves about 15 dollars per month per 100,000 dollars of principal, so a 400,000‑dollar mortgage saves about 60 dollars/月.
Student loans and personal loans: Repricing depends on fixed vs variable. Variable-rate products adjust within one billing cycle by roughly the size of the cut; fixed‑rate products only change for new originations.
Savings yields: Online high‑yield savings and short‑term CDs would likely slip by 15–40 bps within weeks. Households relying on interest income could see monthly interest fall by 15–40 dollars per 100,000 dollars of deposits.
Knock-on consumer effects to watch:
Housing affordability: Even modest mortgage rate declines can revive purchase activity, supporting home prices. That helps existing homeowners’ wealth but can hinder first‑time buyers. If housing activity re-accelerates, shelter components may see upward pressure later.
Equity and retirement accounts: Easier policy often supports risk assets if recession risks are not rising. A positive wealth effect can lift discretionary spending with a lag of several quarters.
Dollar and imported prices: Rate cuts tend to soften the dollar at the margin. A 2–4% weaker dollar, if sustained, could add roughly 0.1–0.2 pp to headline inflation over 6–12 months via imported goods.
Inflation outlook under plausible scenarios (12–18 month horizon):
Soft‑landing baseline: If the Fed cuts because inflation progress is durable and growth is moderating, core PCE likely trends toward 2.2%–2.5%. Goods disinflation and easing wage growth offset any modest demand impulse from lower rates.
Late‑cycle/recessionary cut: If the cut responds to weakening activity, slack rises, demand cools, and both headline and core inflation drift lower, potentially into the 1.8%–2.2% range after a lag, even if the dollar stabilizes.
Re‑acceleration risk tail: If financial conditions loosen materially, housing and services demand could firm, nudging core services ex‑housing toward stickiness. This could slow disinflation, leaving core PCE around 2.5%–2.8% for longer. Energy shocks or a sharper dollar decline would amplify this risk.
Timing and magnitude reminders:
Pass‑through is staggered: Prime‑linked rates and deposit yields react within weeks; fixed‑rate credit and shelter inflation adjust over quarters.
Magnitudes are modest per cut: One 25–50 bps move incrementally eases consumer rates but does not, by itself, overhaul affordability; cumulative moves and broader financial conditions matter more.
Expectations matter: If a cut reinforces confidence that inflation is contained, inflation expectations may edge lower, supporting a glide toward target even as growth steadies.
Practical takeaways for households:
Consider refinancing variable‑rate debts first; the fastest relief is on prime‑linked loans.
Shop for auto and personal loans 2–8 weeks after the move; lender passthrough improves as funding costs reset.
Lock mortgage rates opportunistically if long yields dip; monitor 10‑year Treasury moves.
Rebalance savings: ladder short‑term CDs and be prepared for lower APYs; explore Treasury bills if yields remain attractive relative to deposits.
Conclusion & Outlook
The prospect of a September rate cut by the Federal Reserve is more than a domestic policy shift—it is a global economic turning point. Powerdrill Bloom’s analysis shows how such a decision could reshape markets across three critical dimensions:
Cross-asset correlations and portfolio strategies: Stock-bond relationships flip, yield curves steepen, and sector rotations create opportunities for tactical asset allocation.
Currency and trade dynamics: A weaker U.S. dollar fuels export competitiveness, relieves emerging-market debt burdens, and pushes commodity prices higher.
Safe-haven demand and risk appetite: Gold and defensive assets rise in prominence, while mid-cap and rate-sensitive equities open selective opportunities.
For businesses, this means preparing for shifts in input costs, trade competitiveness, and international demand. For investors, it calls for portfolio realignment—balancing risk-taking with hedges against volatility.
As global markets transition into the post-cut environment, the next 6–12 months will be defined by how quickly these patterns unfold and whether the Federal Reserve’s move successfully stabilizes growth without triggering unforeseen risks.


