Your Ultimate Guide to Data Analysis in 2024: Strategies and Tools
Vivian
Jul 11, 2024
Data analysis is crucial for gaining insights and making informed decisions in any field.
But how do you get started?
In this article, we explore various types of data analysis and outline a process you can follow to conduct effective data analysis.
What Is Data Analysis?
Data analysis is the process of examining, cleaning, transforming, and modeling data to extract useful information, draw conclusions, and support decision-making.
It involves multiple steps, from collecting and processing raw data to interpreting the results and communicating the findings.
The data analysis process involves different experts. For instance, data analysts and scientists often identify relevant datasets and apply statistical techniques to uncover patterns and insights.
Why Is Data Analysis Important?
Data analysis plays a vital role in making informed decisions and ensuring business success.
But why exactly is it so important?
Data analysis is integral to data-driven strategies. These strategies involve collecting, analyzing, and leveraging data to meet organizational goals and drive growth.
Here’s how data analysis can benefit your efforts:
Identify trends and patterns: Helps uncover important insights that inform strategic planning.
Enhance decision-making: Provides a solid foundation for making well-informed business choices.
Optimize operational efficiency: Identifies areas for improvement and streamlines processes.
Understand customer behavior: Offers a deeper understanding of customer preferences and actions.
Predict future outcomes: Uses historical data to forecast future trends and outcomes.
Improve products or services: Provides insights that drive innovation and enhance offerings.
Effective data analysis, particularly through various analytical techniques, is essential for gaining a competitive edge and achieving long-term success.
Types of Data Analysis
1. Descriptive Analysis: Summarizes raw data and provides insights into what has happened. Common techniques include mean, median, mode, and standard deviation.
2. Diagnostic Analysis: Examines data to understand the reasons behind past outcomes. Techniques include drill-down, data mining, and correlation analysis.
3. Predictive Analysis: Uses historical data to forecast future events. Techniques include regression analysis, time series analysis, and machine learning algorithms.
4. Prescriptive Analysis: Suggests actions to achieve desired outcomes based on predictive analysis. Techniques include optimization and simulation models.
To efficiently utilize AI tools for data analysis, let's take Powerdrill AI as an example to demonstrate how these tools can streamline the process.
Data Analysis Process
1. Define Objectives:
Clearly state the problem or question you aim to address with your data analysis. This helps in focusing the analysis on relevant data and techniques.
2. Collect Data:
Gather the necessary data from various sources. Ensure the data is accurate, complete, and relevant to your analysis objectives.
Tips for Collecting Data using Powerdrill AI
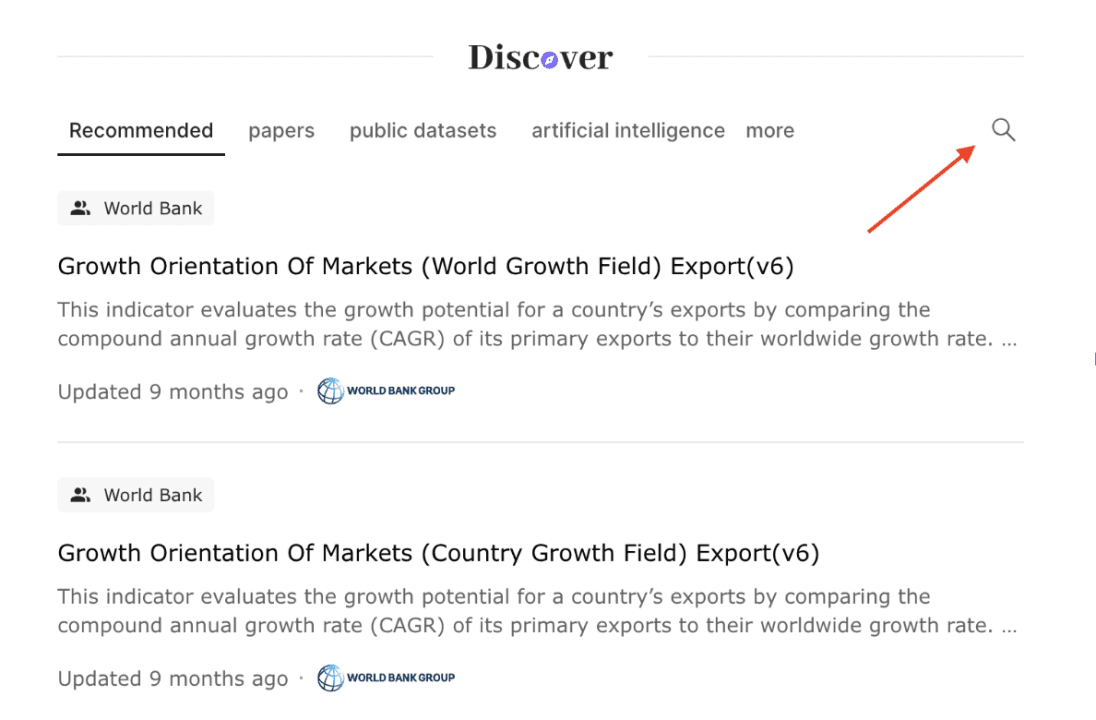
In the Discover section, find the datasets you want!

Additionally, there are many data collecting tools on the market. Some help with data acquisition, some with data organization. Others help with data storage and management.
Here’s a selection of some of the best data collecting tools:
Kaggle: comprehensive data collection tool with a diverse dataset repository
Fluix: for building complicated workflows
Data World: collaborative platform for discovering, sharing, and analyzing data.
3. Clean Data:
Prepare the data for analysis by handling missing values, removing duplicates, and correcting errors. This step is crucial for ensuring the accuracy of your analysis.
Preparation Before Using AI for Data Analysis
Data Formatting Structured Data: Data should be in a tabular format, such as CSV, Excel, SQL databases, etc. Each row represents a data sample, and each column represents a feature (variable).
Unstructured Data: If the data is unstructured, such as text, images, or audio, it needs to be converted into a format that AI can process. For example, text data can be converted into word vectors, and image data can be converted into pixel arrays.
4. Explore Data:
Perform exploratory data analysis (EDA) to understand the structure and patterns in the data. Use visualizations and summary statistics to identify trends and anomalies.
Upload the datasets before you explore it.

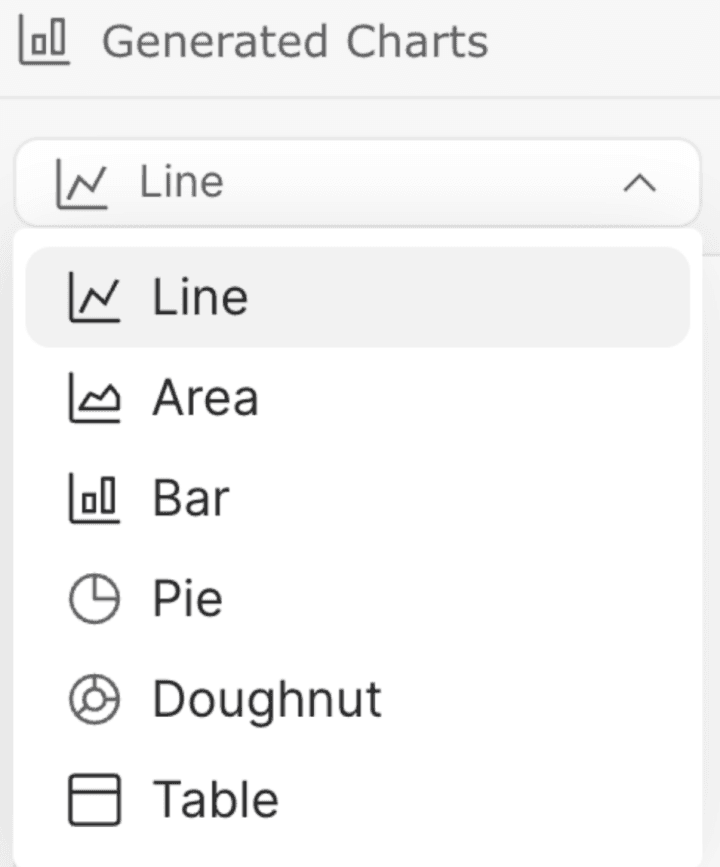
Get any type of visualization you want with Powerdrill AI!

5. Analyze Data:
Apply appropriate data analysis techniques based on your objectives. Use software tools like Excel, Python, R, or specialized analytics platforms to perform the analysis.
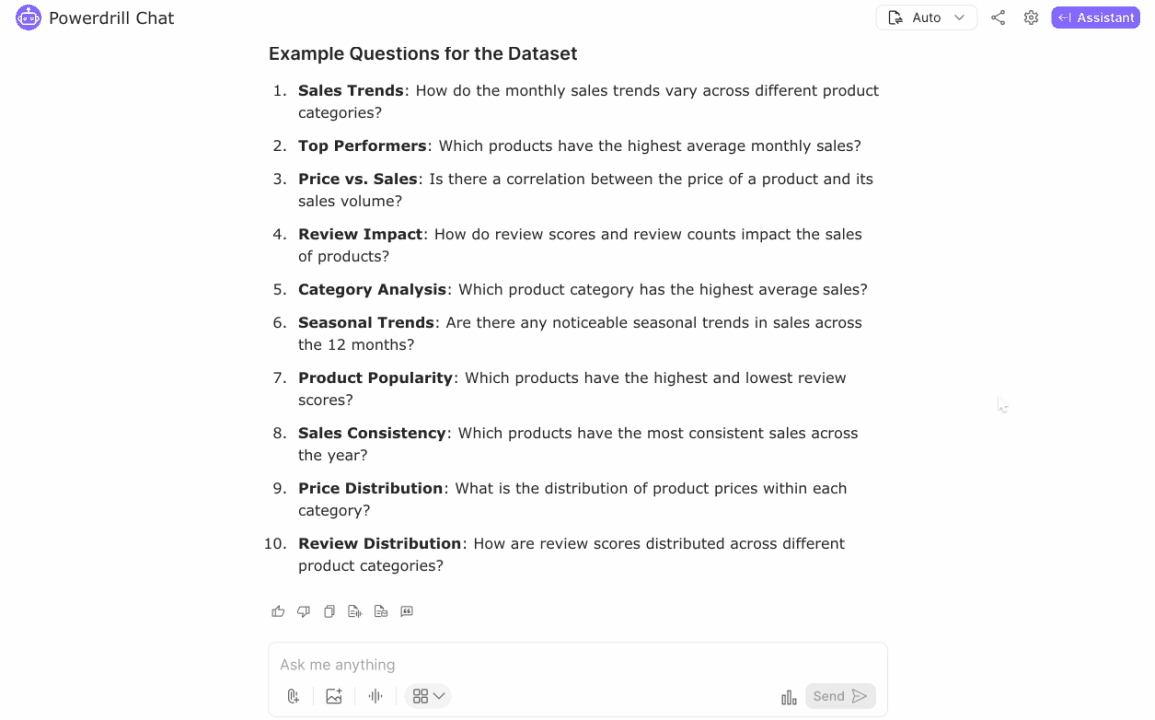
By inputting relevant inquiries, Powerdrill AI can generate comprehensive analyses from various perspectives and angles, thereby enriching the diversity of the analysis content.
For example, when I upload the datasets of e-commerce sales and input ‘relevant inquiries’, Powerdrill AI will automatically generate related questions.

6. Interpret Results:
Summarize the findings and draw conclusions from the analysis. Ensure the results align with your objectives and provide actionable insights.
7. Communicate Findings:
Present the analysis results in a clear and concise manner. Use visualizations, reports, or presentations to convey the insights to stakeholders.
8. Make Decisions:
Use the insights gained from the data analysis to make informed decisions and take actions that align with your objectives.
By following this process, you can effectively analyze data and leverage insights to drive decision-making and strategy in your organization.
Here Are Some Examples Of The Data Analysis Process:
Elevate Your Data Analysis Skills
Effective data analysis has become crucial in today's competitive landscape.
To stay ahead, it's essential to select your analysis techniques wisely and implement them meticulously.
Advance your data analysis journey with Powerdrill AI, and explore its comprehensive features for free.


