
Introduction
Are you curious about the calorie count, protein content, and macronutrient breakdown of different cuisines? Whether you're a health-conscious foodie or simply want to make better choices for your meals, understanding the nutritional values of dishes can be a game-changer.
In this blog, we dive deep into the average calorie and protein content of popular cuisines like Continental, Italian, Indian, and more. We also explore the surprising differences between veg and non-veg dishes, how common allergens impact calorie counts, and much more! Get ready to uncover insightful trends and practical takeaways that will help you make informed decisions, whether you're dining out or cooking at home.
A little background info
About the dataset
The dataset we use sources from Kaggle, which contains a curated set of global dishes—spanning Japanese, Korean, Indian, Italian, French, Continental, and Mediterranean cuisines—with comprehensive information across key dietary dimensions.
About the data analysis tool
For our analysis, we're using — an AI-powered data analytics platform. AI-powered data analytics platform designed to turn complex datasets into clear, actionable insights. With its powerful features and intuitive interface, Powerdrill makes exploring trends not only fast and efficient, but surprisingly fun.
Key Takeways
Cuisine Calorie Counts: Korean and Italian dishes are the most calorie-dense, while Continental cuisine is the lightest.
Non-Veg Dishes Have More Protein: Non-veg dishes average 13.40g of protein, making them a better choice for protein intake.
Allergens Increase Calories: Dishes with allergens like dairy and nuts tend to have higher calorie counts due to calorie-dense ingredients.
Indian Cuisine is Fat-Heavy: Indian dishes are high in fat (34.78g), with moderate carbs and protein, making them energy-dense.
Balanced Meal Distribution: Breakfast, lunch, and dinner are fairly evenly distributed, with lunch slightly leading in some cuisines.
Positive Nutritional Relationships: Higher-calorie dishes generally contain more protein, fat, and carbs.
Nutritional Clusters Identified: Dishes cluster into groups based on similar calorie, protein, fat, and carb content, revealing different meal profiles.
High-Calorie, Low-Protein Dishes: Some dishes, like the Hojiki Noodle Breakfast, are high in calories but low in protein, relying on carbs and fats.
Cuisine-Specific Meal Trends: Mediterranean cuisine favors lunch, while French cuisine focuses more on breakfast.
Key Insights
1. Calorie Count Across Different Cuisines
Insight 1: Korean and Italian cuisines have the highest average calorie counts, which suggests that these cuisines may often feature richer, heavier dishes. This could be due to the use of ingredients like fats, meats, and oils that are more calorie-dense.
Insight 2: Continental cuisine stands out with the lowest average calorie count, possibly reflecting simpler, lighter dishes with fewer high-calorie ingredients. It might be more common to find dishes like salads, lean meats, and simple grains.
Insight 3: Mediterranean cuisine has a relatively high average calorie count, but it's still less than Korean and Italian, which points to its focus on heart-healthy fats, such as olive oil, that add calories without being unhealthy.

2. Protein Content in Veg vs. Non-Veg Dishes
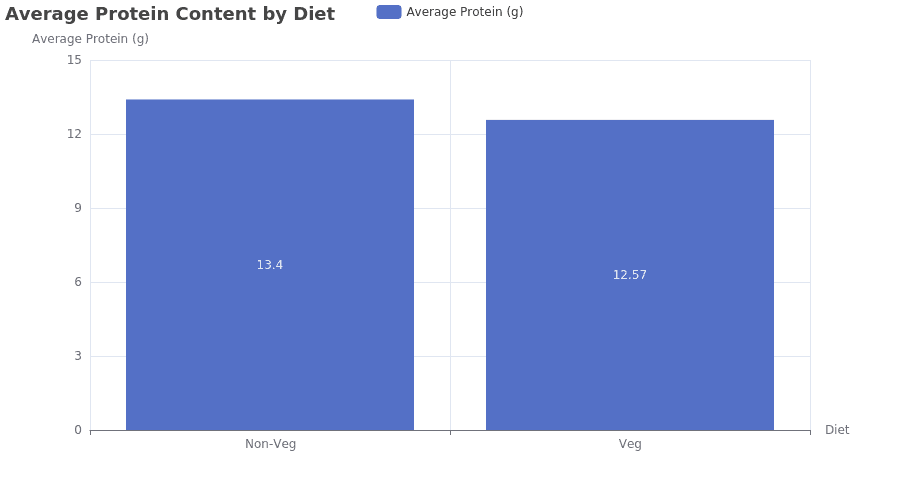
Insight 4: Non-veg dishes contain more protein on average (13.40g) than veg dishes (12.57g), which is expected given that animal products like meat and fish are generally higher in protein compared to plant-based foods.
Insight 5: While non-veg dishes generally have more protein, the gap is relatively small, suggesting that there are significant plant-based dishes rich in protein, possibly due to the inclusion of beans, legumes, and high-protein grains.

3. Calorie Count in Dishes with and without Common Allergens
Insight 6: Dishes containing allergens (like dairy, gluten, nuts, etc.) have a higher average calorie count (275.95 kcal) than those without allergens (229.75 kcal). This suggests that many allergen-containing ingredients, such as dairy, nuts, or gluten, may contribute to higher caloric content. These ingredients are often calorie-dense and contribute to richer, fuller dishes.
Insight 7: This insight may also imply that dishes without allergens tend to be lighter or more plant-based, focusing on simpler ingredients with lower caloric values.

4. Macronutrient Distribution in Indian Cuisine
Insight 8: In Indian cuisine, fat makes up the largest proportion of macronutrients (34.78g), which is likely due to the use of rich cooking methods, such as frying, and the inclusion of ghee or oil. Carbohydrates come next (27.83g), reflecting the popularity of rice, bread, and lentils in Indian meals.
Insight 9: Protein (13.03g) is comparatively lower than fat and carbs, which could suggest that Indian cuisine often leans toward plant-based dishes where protein levels may not be as high as in meat-based dishes.

5. Meal Type Distribution
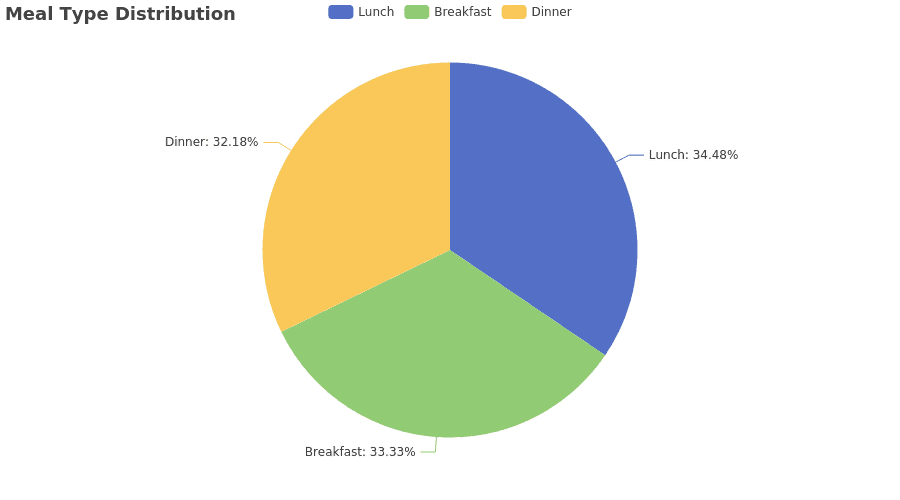
Insight 10: Lunch is the most common meal type (34.48%) in the dataset, which aligns with the general cultural trend in many countries where lunch is considered the largest or most significant meal of the day.
Insight 11: Breakfast (33.33%) and dinner (32.18%) are fairly evenly distributed, suggesting that these meals are similarly important in the dataset, with only slight variations across cuisines.
Insight 12: Mediterranean cuisine has a significantly higher percentage of lunch dishes (40%), which could reflect the cultural tradition of having larger meals at midday. In contrast, French cuisine has a higher percentage of breakfast dishes (39.47%), which may reflect a greater focus on breakfast-oriented foods in French culture.

6. Nutritional Clusters in Dishes
Insight 13: The scatter plot matrix reveals that dishes with higher calorie content generally contain more protein, fat, and carbohydrates. This highlights a common trend in nutrition where high-calorie dishes are often more nutrient-dense, providing more energy through an increased presence of all macronutrients.
Insight 14: There seems to be a cluster of low-calorie, low-protein, low-fat, and low-carb dishes, which could represent lighter, more health-conscious choices, possibly focusing on vegetables, salads, or minimal ingredients.
Insight 15: Outliers with high fat or high carbohydrates point to dishes that may have unbalanced macronutrient profiles, possibly representing indulgent or specialty meals.
7. Dishes High in Calories but Low in Protein
Insight 16: The analysis identifies a number of high-calorie, low-protein dishes, such as the Hojiki Noodle Breakfast and Cuisin's Vege Tofu Bowl. These dishes may contain more calories from carbohydrates and fats rather than proteins. This could suggest that these dishes are designed to provide energy through carbs (e.g., noodles, rice) or fats (e.g., oils, nuts), but lack substantial protein sources.
Insight 17: These dishes could cater to people who need quick energy or those following specific diets, like those focused on high-carb, low-protein meals.

8. Cuisine-Specific Meal Type Distribution
Insight 18: Mediterranean cuisine consistently features the highest percentage of lunch dishes, which could be a cultural trend where the main meal of the day is consumed at lunchtime. This aligns with Mediterranean lifestyle practices, where lunch is the most significant meal.
Insight 19: Continental cuisine has a more balanced meal distribution, with breakfast and lunch being relatively equal in percentage, suggesting it caters to a more diverse approach to meal timing and structure.
Insight 20: Korean cuisine shows an even split between breakfast and dinner, indicating that these meal types may hold equal cultural significance in Korean dining.
Detailed Analysis
What is the Average Calorie Count for Each Cuisine?
Continental Cuisine: 240.42 kcal (lowest)
Korean Cuisine: 307.97 kcal (highest)
Italian Cuisine: 302.73 kcal
French Cuisine: 257.46 kcal
Indian Cuisine: 256.43 kcal
Japanese Cuisine: 269.25 kcal
Mediterranean Cuisine: 292 kcal

What is the average protein (g) content for Veg and Non-Veg dishes?
Non-Veg Dishes: 13.40 g of protein (higher)
Veg Dishes: 12.57 g of protein
What is the Average Calorie Count for Dishes with Common Allergens vs. No Allergens?
Dishes with Allergens: 275.95 kcal (higher)
Dishes without Allergens: 229.75 kcal

Dishes containing allergens tend to have a higher average calorie count (275.95 kcal) compared to those without allergens (229.75 kcal), suggesting that allergens may contribute to a higher caloric value.
What is the Average Macronutrient Proportion in Indian Cuisine Dishes?
Fat: 34.78 g (highest)
Carbohydrates: 27.83 g
Protein: 13.03 g

What is the Percentage Distribution of Each Meal Type (Breakfast, Lunch, Dinner)?
Lunch: 34.48%
Breakfast: 33.33%
Dinner: 32.18%
Meal types are evenly distributed, with lunch accounting for the largest share (34.48%), followed closely by breakfast (33.33%) and dinner (32.18%).
Can We Identify Clusters of Dishes Based on Their Calorie Density, Protein, Fat, and Carbohydrate Content Using a Scatter Plot Matrix?

What Does the Nutritional Data Overview Reveal?
Dataset Overview: 261 dishes
Average Nutrients: 274.35 kcal, 12.96 g protein, 17.55 g fat, 28.68 g carbs
Max Values: 1150 kcal, 42 g protein, 750 g fat, 79.68 g carbs
What Can We Learn from the Scatter Plot Matrix Observations?
Calories vs. Protein: Positive correlation – higher calorie dishes tend to have more protein.
Calories vs. Carbs: Positive correlation – higher calorie dishes tend to have more carbs.
Calories vs. Fat: Positive correlation – higher calorie dishes tend to have more fat.
Protein: Two distinct peaks in protein distribution.
Fat: Most dishes have low fat, with some outliers having high fat content.
Carbs: Most dishes have low carbs, with some outliers having high carbohydrate content.
Are There Dishes Higher in Calories but Low in Protein?
Here are the top 10 dishes filtered for high-calorie, low-protein content, listed in descending order of calories:
Hojiki Noodle Breakfast: 610 kcal, 12.0 g protein, 14.0 g fat, 78.0 g carbs
Cuisin's Vege Tofu Bowl: 600 kcal, 12.0 g protein, 15.0 g fat, 20.0 g carbs
Veggie Booty Breakfast Bowl: 500 kcal, 12.8 g protein, 39.6 g carbs
Vegetarian Breakfast Bowl with Hummus and Cucumber: 480 kcal, 12.0 g protein, 35.0 g fat, 29.0 g carbs
Roasted Brussels Sprouts with Mediterranean Green Beans: 460 kcal, 8.5 g protein, 12.5 g fat, 25.5 g carbs
Spinach & Bacon Frittata: 450 kcal, 11.0 g protein, 23.0 g fat, 9.0 g carbs

What is the Percentage Distribution of Each Meal Type in Each Cuisine?
How is the Meal Type Distribution Calculated?
The percentage of each meal type within each cuisine is calculated by dividing the 'Dish Count' by the 'Total Dishes' for that cuisine and multiplying by 100.
Mean Percentage: 33.33%
Standard Deviation: 4.52%
Minimum Percentage: 22.86%
Maximum Percentage: 40.00%
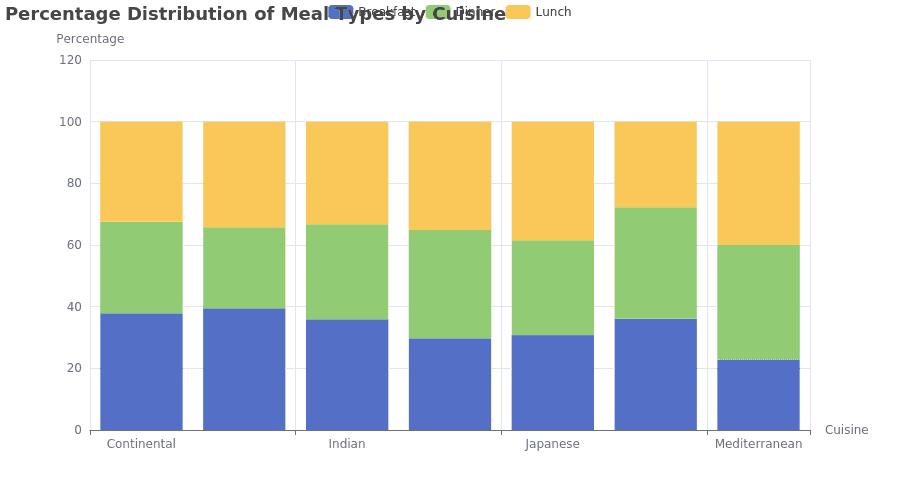
What Does the Stacked Bar Chart Reveal?
A stacked bar chart visualizes the percentage distribution of meal types within each cuisine:
X-axis: Represents cuisines (Continental, Indian, Japanese, Mediterranean)
Y-axis: Represents percentage
What Are the Key Insights from the Meal Type Distribution by Cuisine?
Mediterranean Cuisine: Has the highest percentage of lunch dishes (40.0%) and the lowest percentage of breakfast dishes (22.86%).
French Cuisine: Has the highest percentage of breakfast dishes (39.47%).
Continental Cuisine: Has an even distribution of meal types, with breakfast at 37.84%, lunch at 32.43%, and dinner at 29.73%.
Korean Cuisine: Has the same percentage for breakfast and dinner (36.11%).
Conclusion
Understanding the nutritional profiles of different cuisines not only helps us make healthier choices but also deepens our appreciation of diverse food cultures. By exploring calorie counts, protein levels, and macronutrient distributions, we can better align our meals with our dietary goals. Want to dive even deeper into this data and gain more insights? Try Powerdrill today and uncover even more valuable information from the dataset.


