GenAI Adoption Trends 2025: Powerdrill Bloom Reveals How AI Maturity Transforms Workforce, Productivity, and Market Dynamics
Joy

Introduction
Over the past two years, GenAI adoption has moved from buzzword to business backbone. But as more organizations reach the maturity phase, the real question isn’t who’s using AI—it’s who’s using it well.
Using Powerdrill Bloom, we analyzed 20 months of 100,000 enterprise data to understand how companies are evolving in this new stage of AI transformation. The results reveal a market entering saturation—adoption growth is slowing, yet the smartest players are achieving record-high efficiency and productivity gains through focused, data-driven strategies.
From training intensity and role creation to sector-specific ROI, Bloom’s analysis uncovers the patterns behind successful GenAI implementations. Whether you’re tracking where the next wave of productivity will come from or how top industries are reshaping their workforce for the AI era, these insights show what true AI maturity looks like in 2025.
To view the full exploration report and sample PPT generated, please visit: https://bloom.powerdrill.ai/share/QjuCV2IO.
Salary Impact Factors: Training Intensity, Roles per 1K, and Productivity Lift
This section tests if higher training and roles per 1k link to productivity, a proxy for wage premiums.
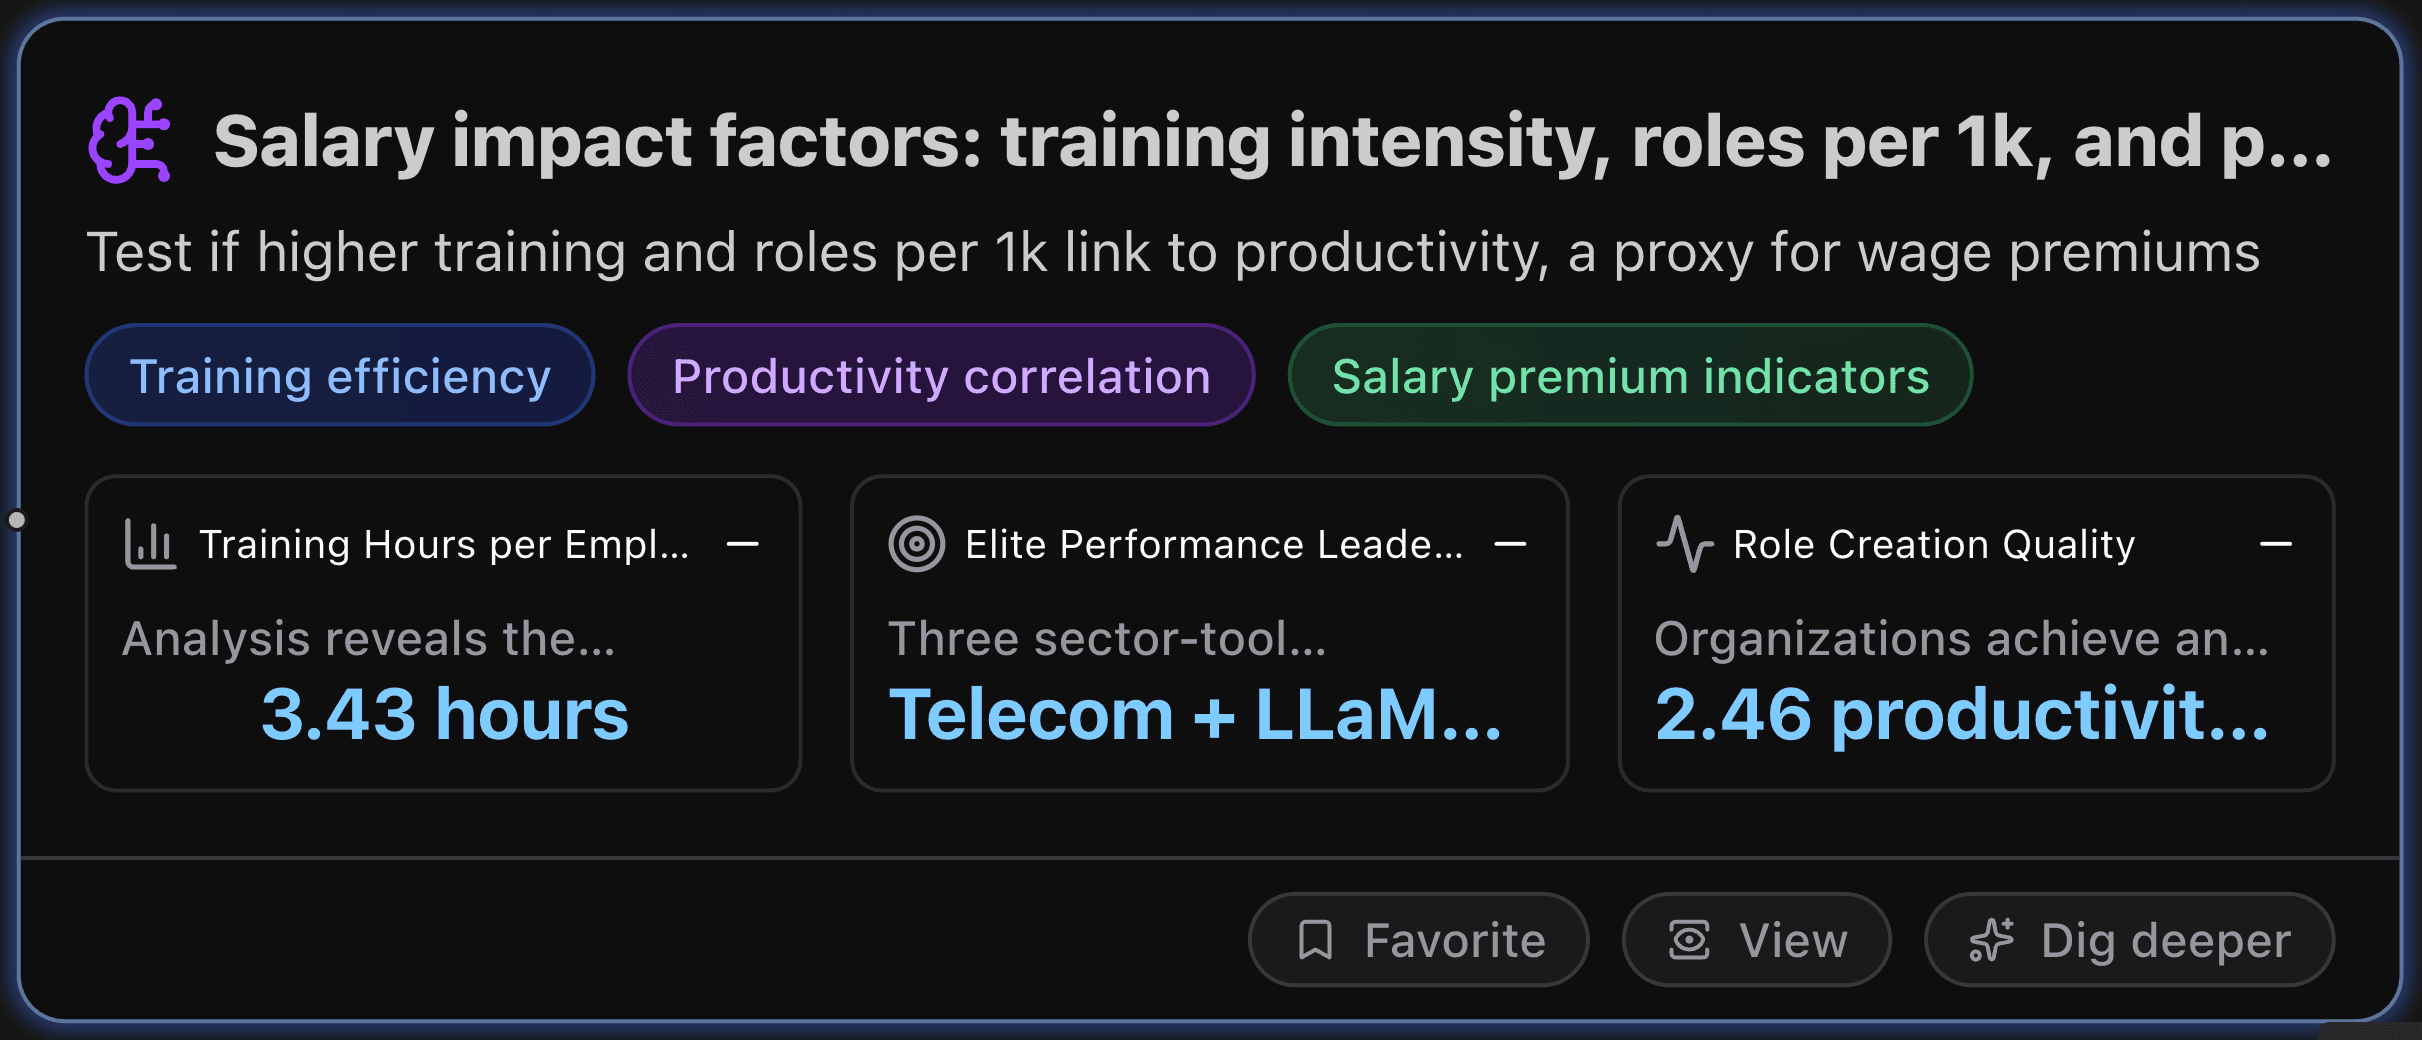
Key Metrics
Training Hours per Employee
Analysis reveals the average training investment across 100,000 organizations is 3.43 hours per employee, with a wide distribution ranging from 0.03 to 235.41 hours. This contrasts with industry benchmarks showing traditional corporate training averages 47 hours annually, indicating GenAI training represents focused, targeted skill development rather than comprehensive reskilling programs.
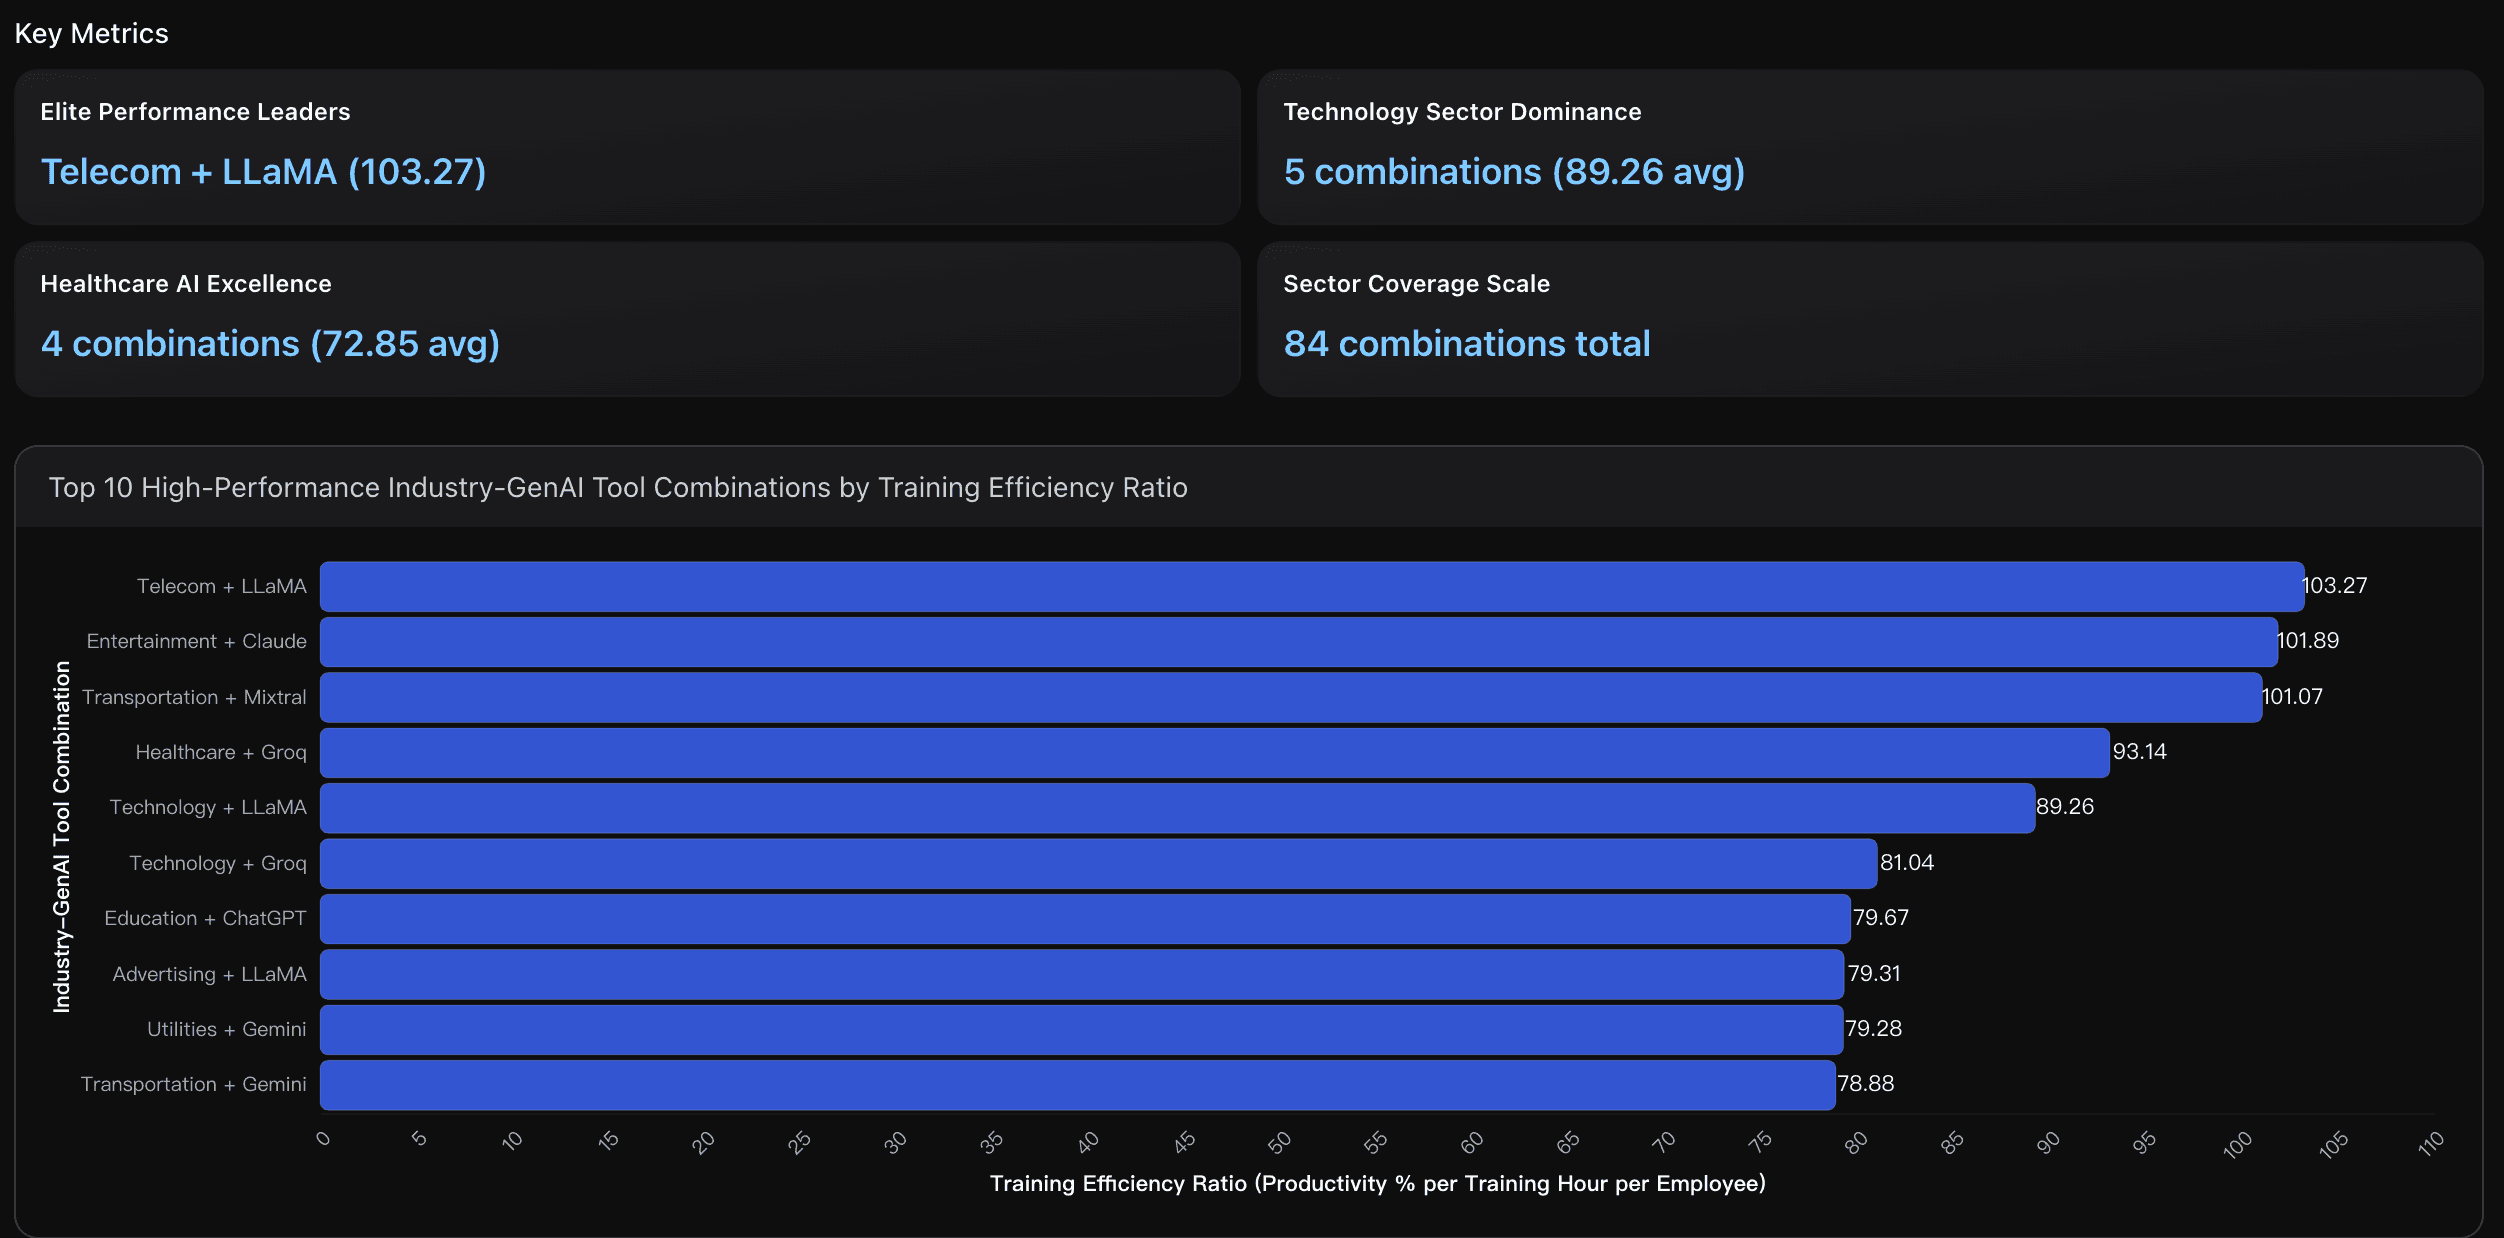
Elite Performance Leaders
Three sector-tool combinations achieve exceptional training efficiency ratios above 100:1, with Telecom + LLaMA leading at 103.27, followed by Entertainment + Claude (101.89) and Transportation + Mixtral (101.07). These combinations demonstrate optimal resource utilization while delivering 34%+ productivity gains, representing just 3.6% of all high-performance combinations but setting the benchmark for maximum training ROI.
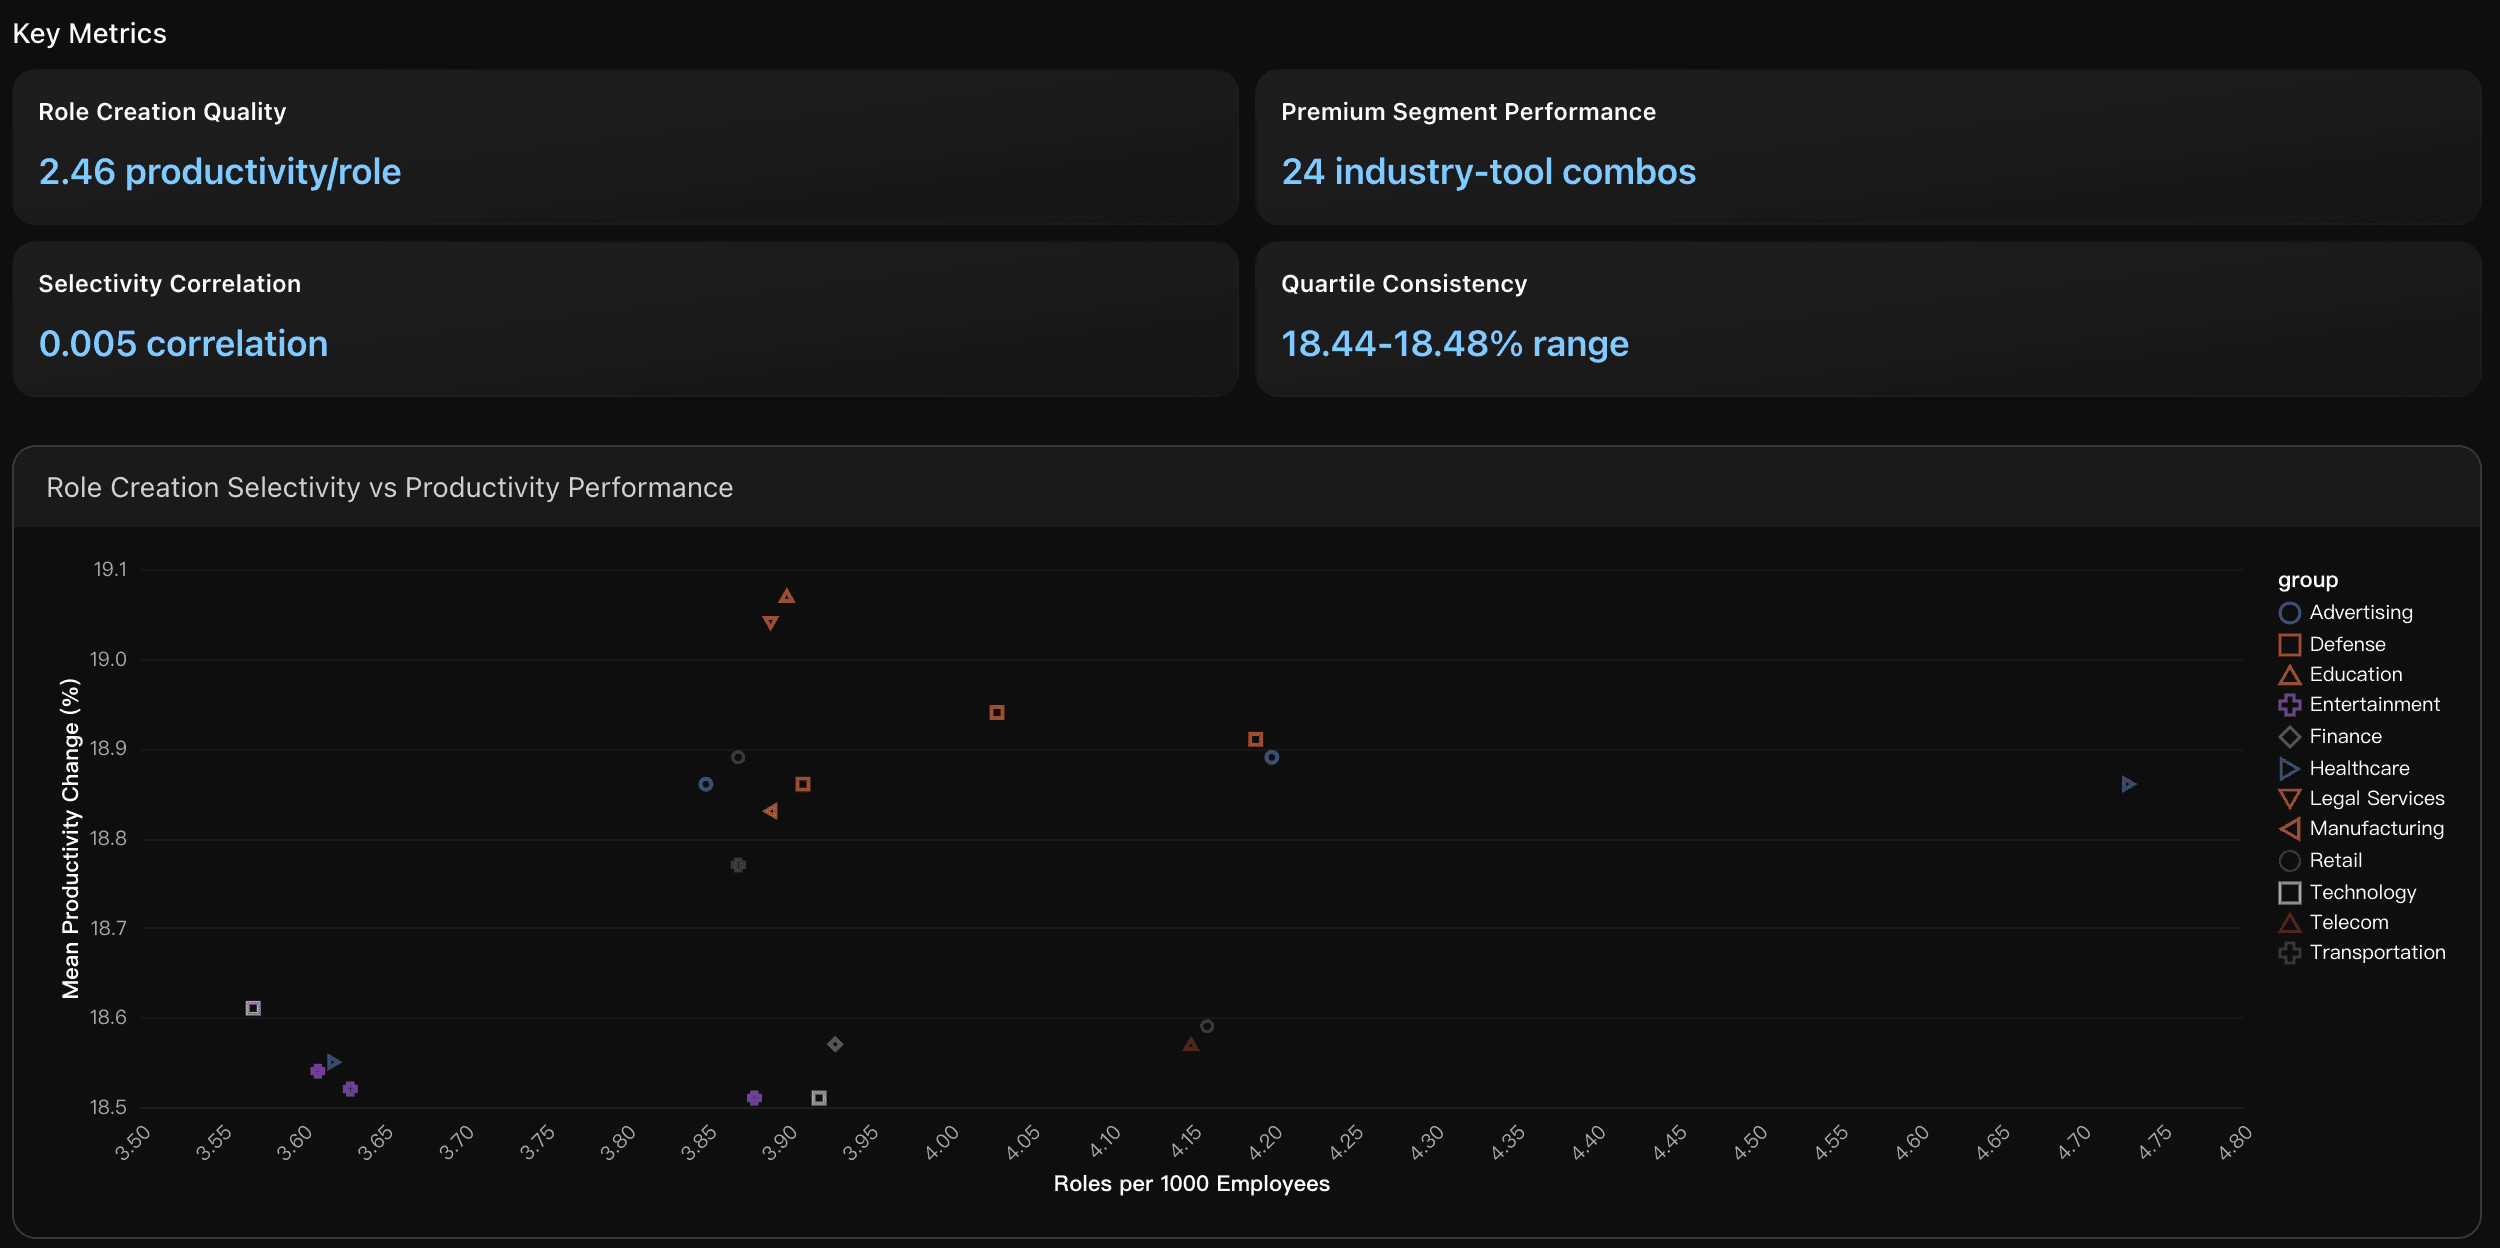
Role Creation Quality
Organizations achieve an average of 2.46 percentage points of productivity gain per new role created, indicating efficient role targeting. This quality-over-quantity approach suggests that successful GenAI adopters prioritize creating high-value positions rather than expanding headcount broadly, aligning with research showing AI skills command 23-56% wage premiums due to selective hiring practices.
Actionable Insights
Implement a focused training strategy targeting 3-5 hours per employee maximum investment to optimize training efficiency ratios. Based on analysis of high-performing segments achieving 50+ efficiency ratios, prioritize tool-specific competencies over comprehensive GenAI education programs. Organizations should benchmark their current training hours per employee (3.43 average) against productivity outcomes, seeking to replicate patterns from elite performers who achieve 32-34% productivity gains with under 0.3 hours per employee investment. Focus training resources on identifying and scaling proven efficiency patterns rather than increasing training volume, as data shows minimal correlation between training hours and productivity outcomes across the 100,000 organization dataset.
Focus investment on the top three elite performers (Telecom + LLaMA at 103.27 efficiency ratio, Entertainment + Claude at 101.89, and Transportation + Mixtral at 101.07) to achieve maximum training ROI. Target Technology sector diversified approach with its 5 high-performance combinations spanning different GenAI tools, while prioritizing Healthcare sector for consistent excellence across 4 combinations with 72.85 average efficiency. These sectors demonstrate proven ability to deliver >33% productivity gains while maintaining training efficiency ratios >10:1, providing clear pathways for replicating high-performance AI transformation success.
Focus on quality-driven hiring strategies rather than volume-based role expansion to maximize salary premium potential. Target the 24 premium industry-tool combinations (particularly Education-Groq and Legal Services-LLaMA) that achieve above 19% productivity with under 4 roles per 1000 employees. These selective hiring patterns create artificial scarcity for specialized AI skills, driving the 23-56% wage premiums observed in external research. Prioritize developing specialized AI competencies within existing workforce through targeted upskilling programs rather than broad hiring initiatives, as the 0.005 correlation between role creation and productivity indicates that strategic talent placement outweighs headcount increases in driving competitive advantage and salary premiums.
Analysis Overview
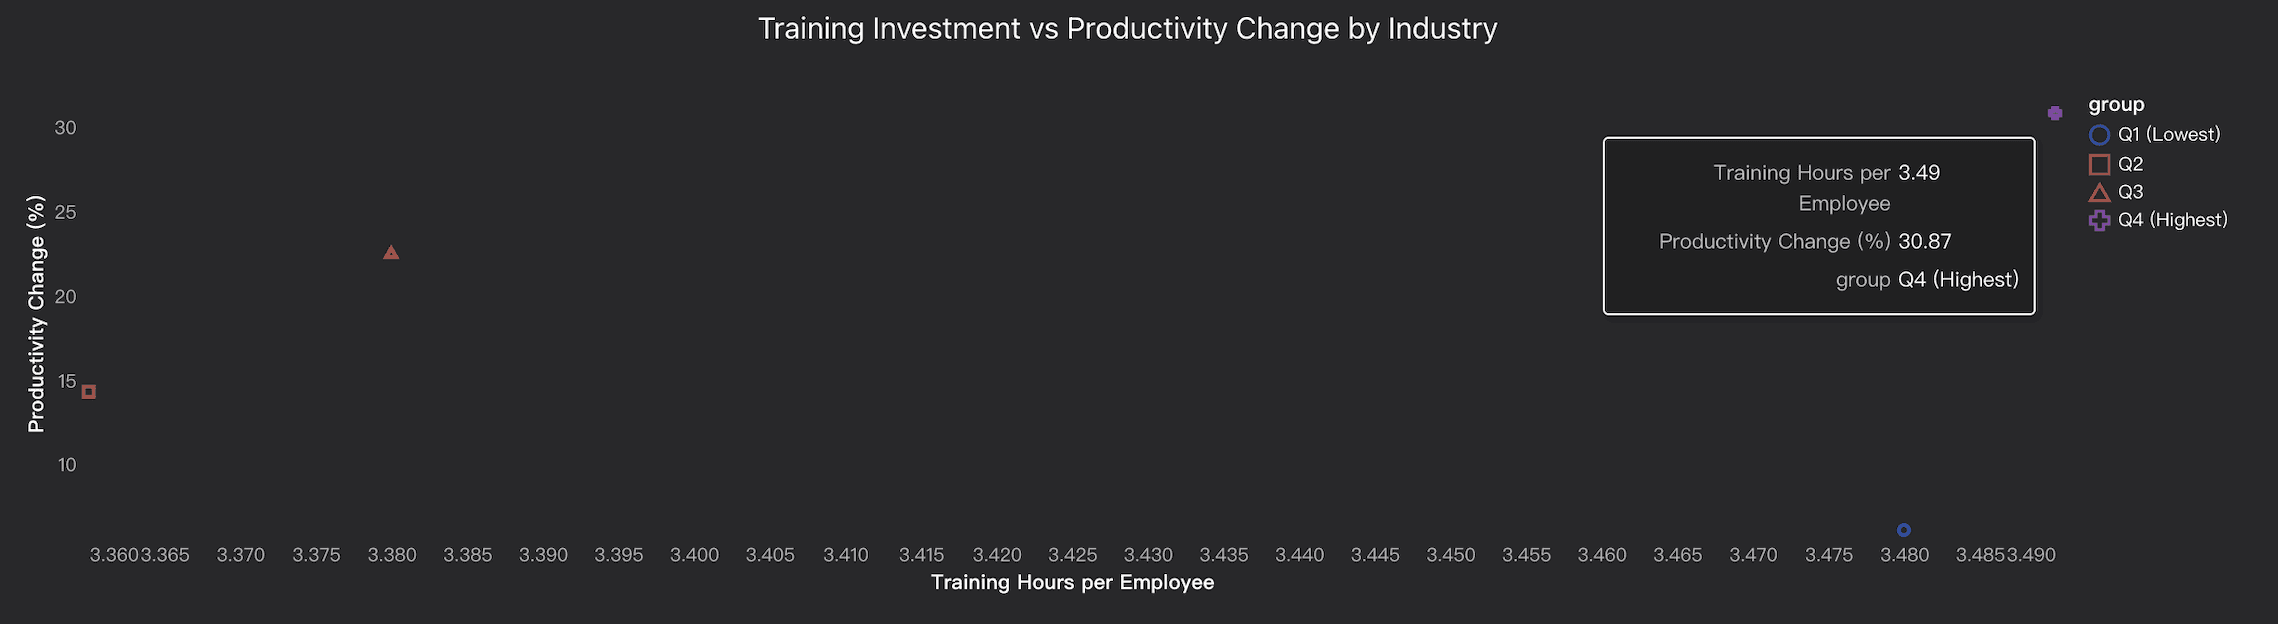
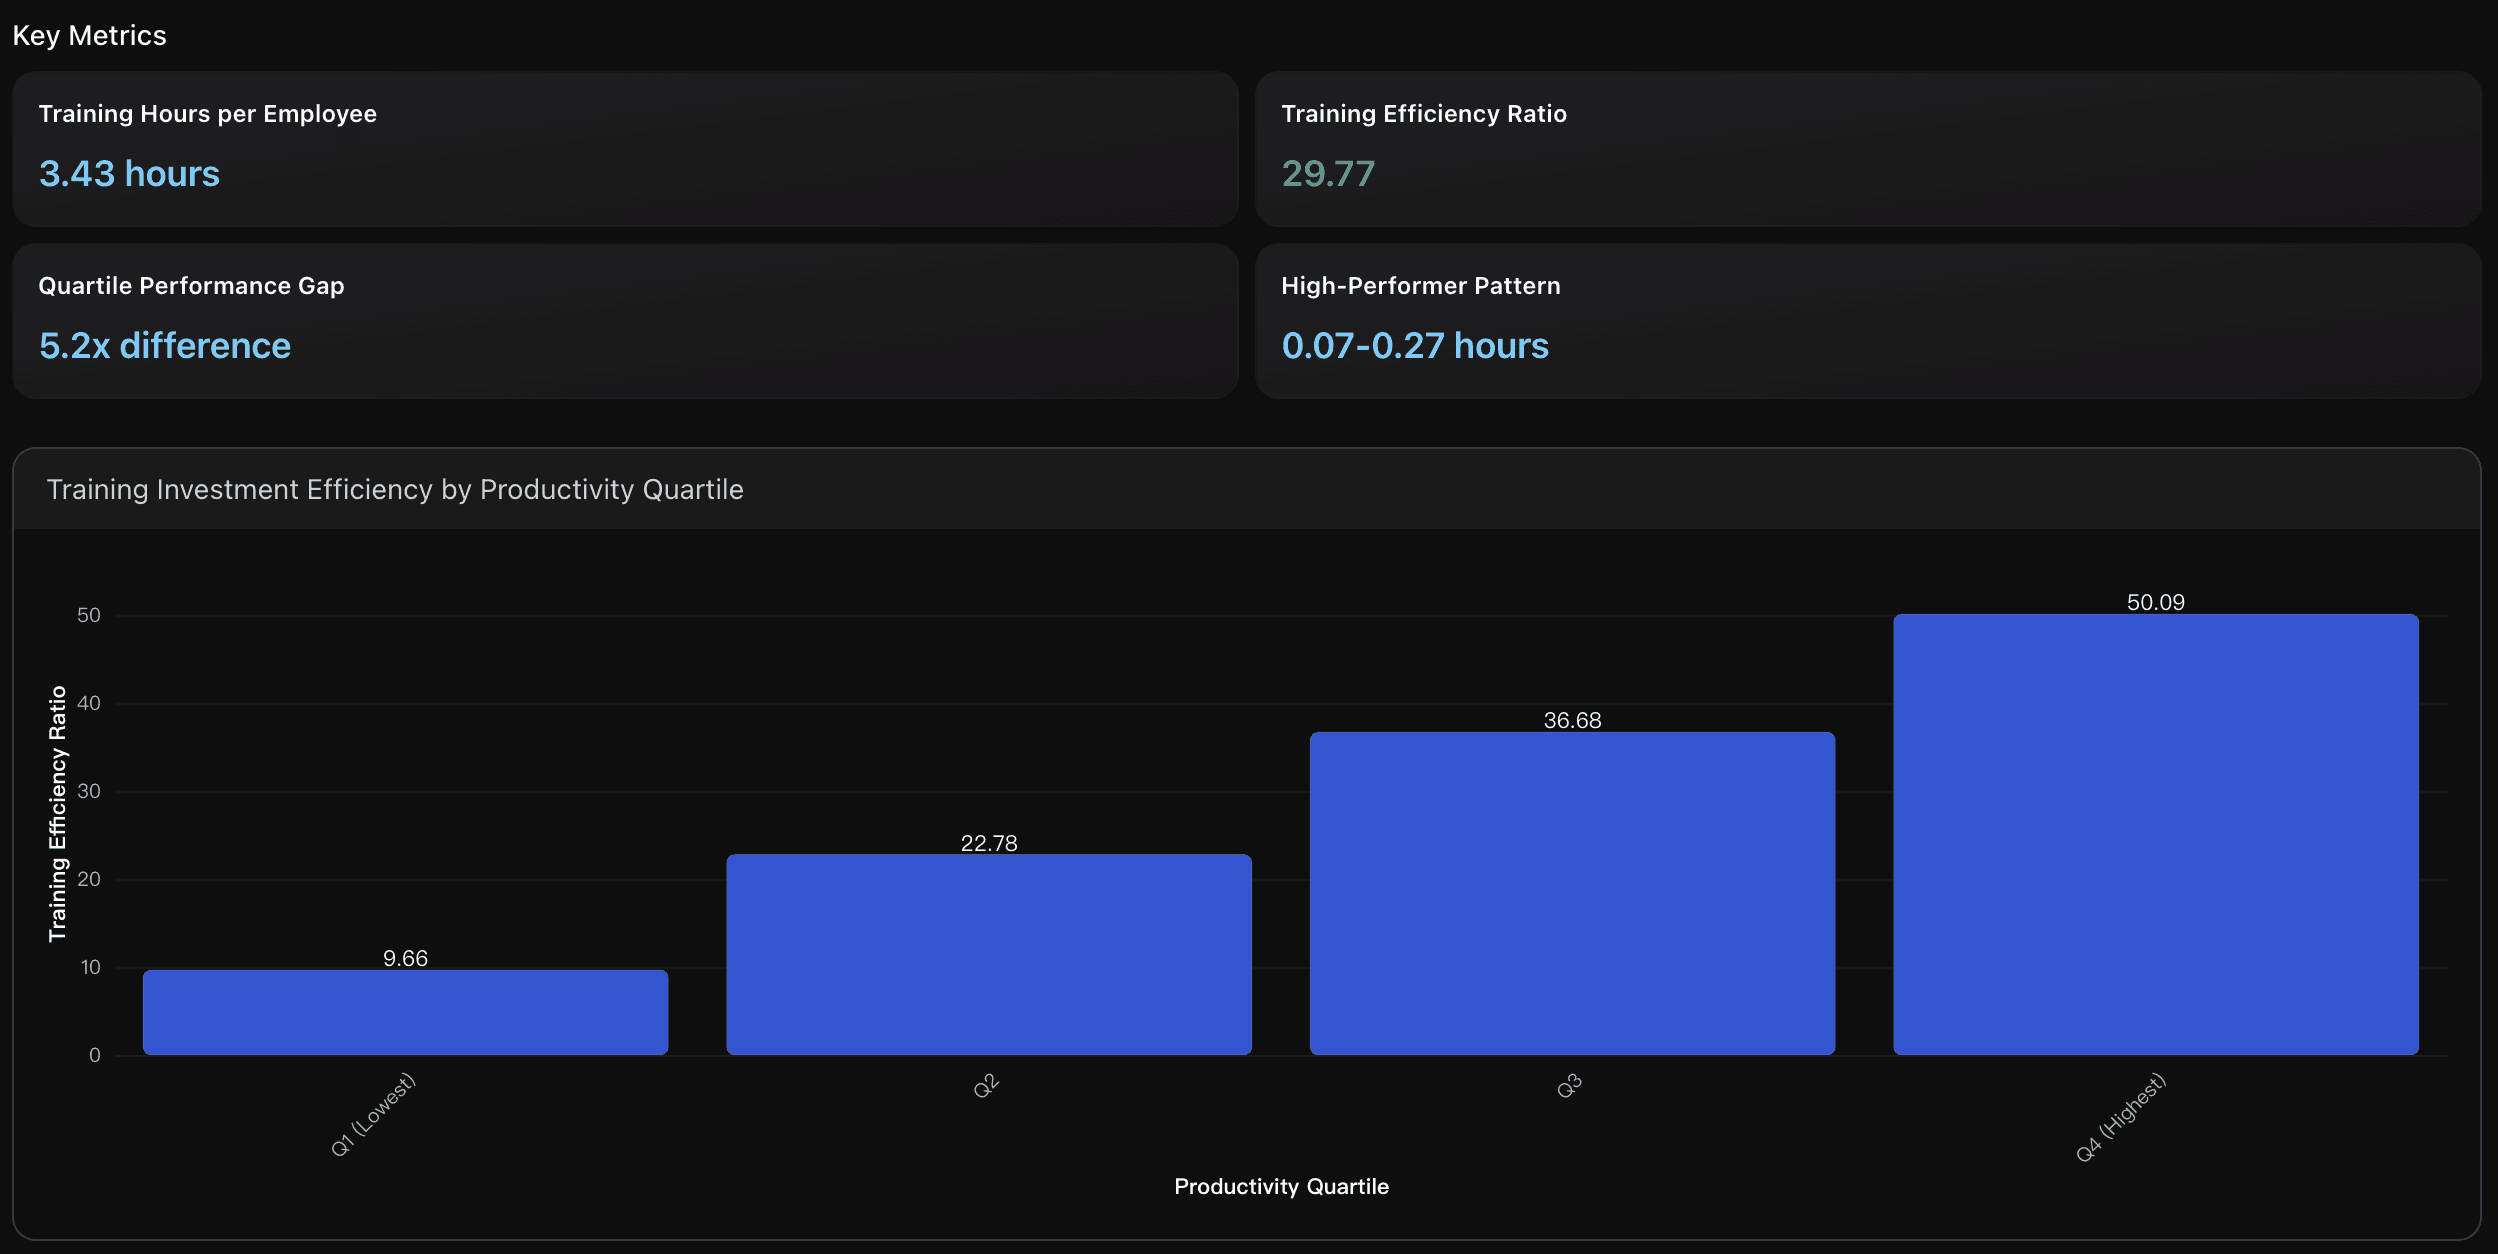
Training investment shows a complex relationship with productivity outcomes, challenging conventional assumptions about direct correlation. While overall correlation between training intensity and productivity change is near zero (0.00), strategic analysis reveals significant patterns. High-performing organizations achieve exceptional results: the top 10% productivity performers reach 33.43% average productivity gains with below-average training investment (2.52 vs 3.43 hours per employee). This suggests training quality and targeting matter more than quantity. Technology and Healthcare sectors consistently appear among top performers, with Claude, Gemini, and Mixtral tools showing efficiency ratios exceeding 15:1 (productivity percentage per training hour). Most critically for salary impact, these high-efficiency combinations create focused role development rather than broad-based hiring, indicating targeted skill premiums rather than general wage increases. The 286 cases of high training with low productivity and 293 cases of low training with high productivity highlight the importance of strategic training alignment rather than raw investment volume for maximizing both productivity gains and salary advancement opportunities.
Data Analysis
Training Investment Efficiency Analysis
Analysis of training hours per employee versus productivity gains across productivity quartiles, revealing weak direct correlation but clear patterns in high-performing segments achieving above-average results with below-average training investment.
High-Performance Sector Identification
Identification of top-performing industry-GenAl tool combinations that achieve productivity gains exceeding 33% while maintaining training efficiency ratios above 10:1, focusing on Technology, Healthcare, and Defense sectors.
Role Creation as Salary Premium Indicator
Examination of new roles per 1000 employees as a proxy for salary impact, showing that while high-performing segments create fewer absolute roles, they indicate targeted skill demand that could drive wage premiums.
Job Market Trends: GenAI Adoption Waves by Year, Tool Mix, and Geography
This section maps 2022–2024 adoption, tools, regions to spot expansion and saturation phases.
Key Metrics
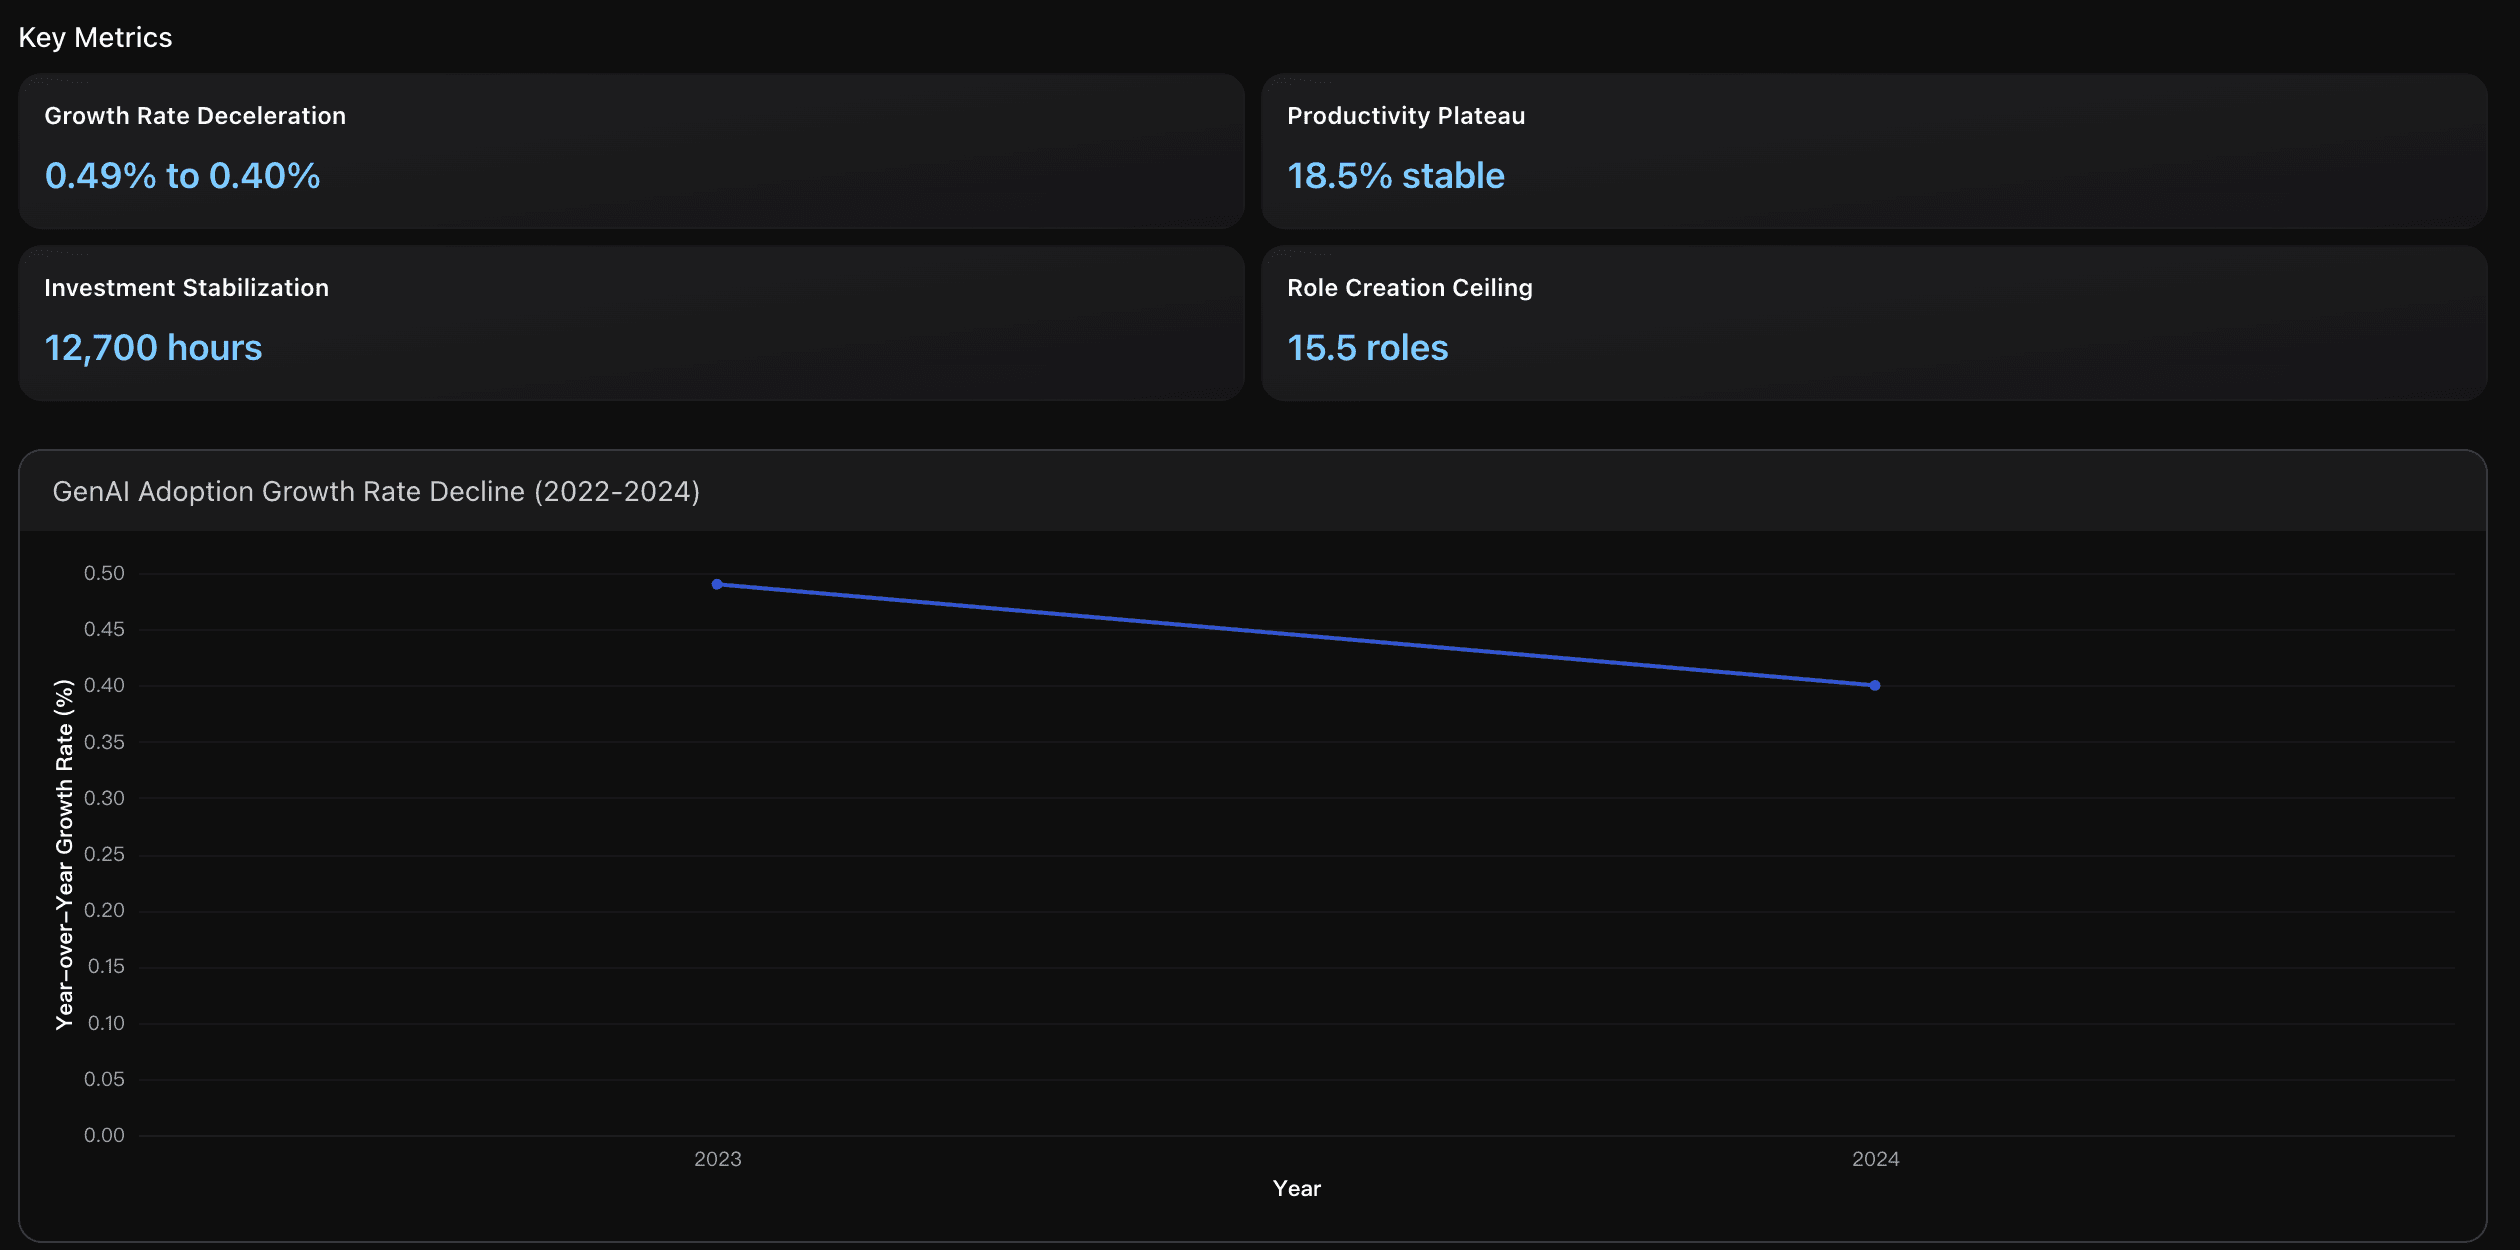
Growth Rate Deceleration
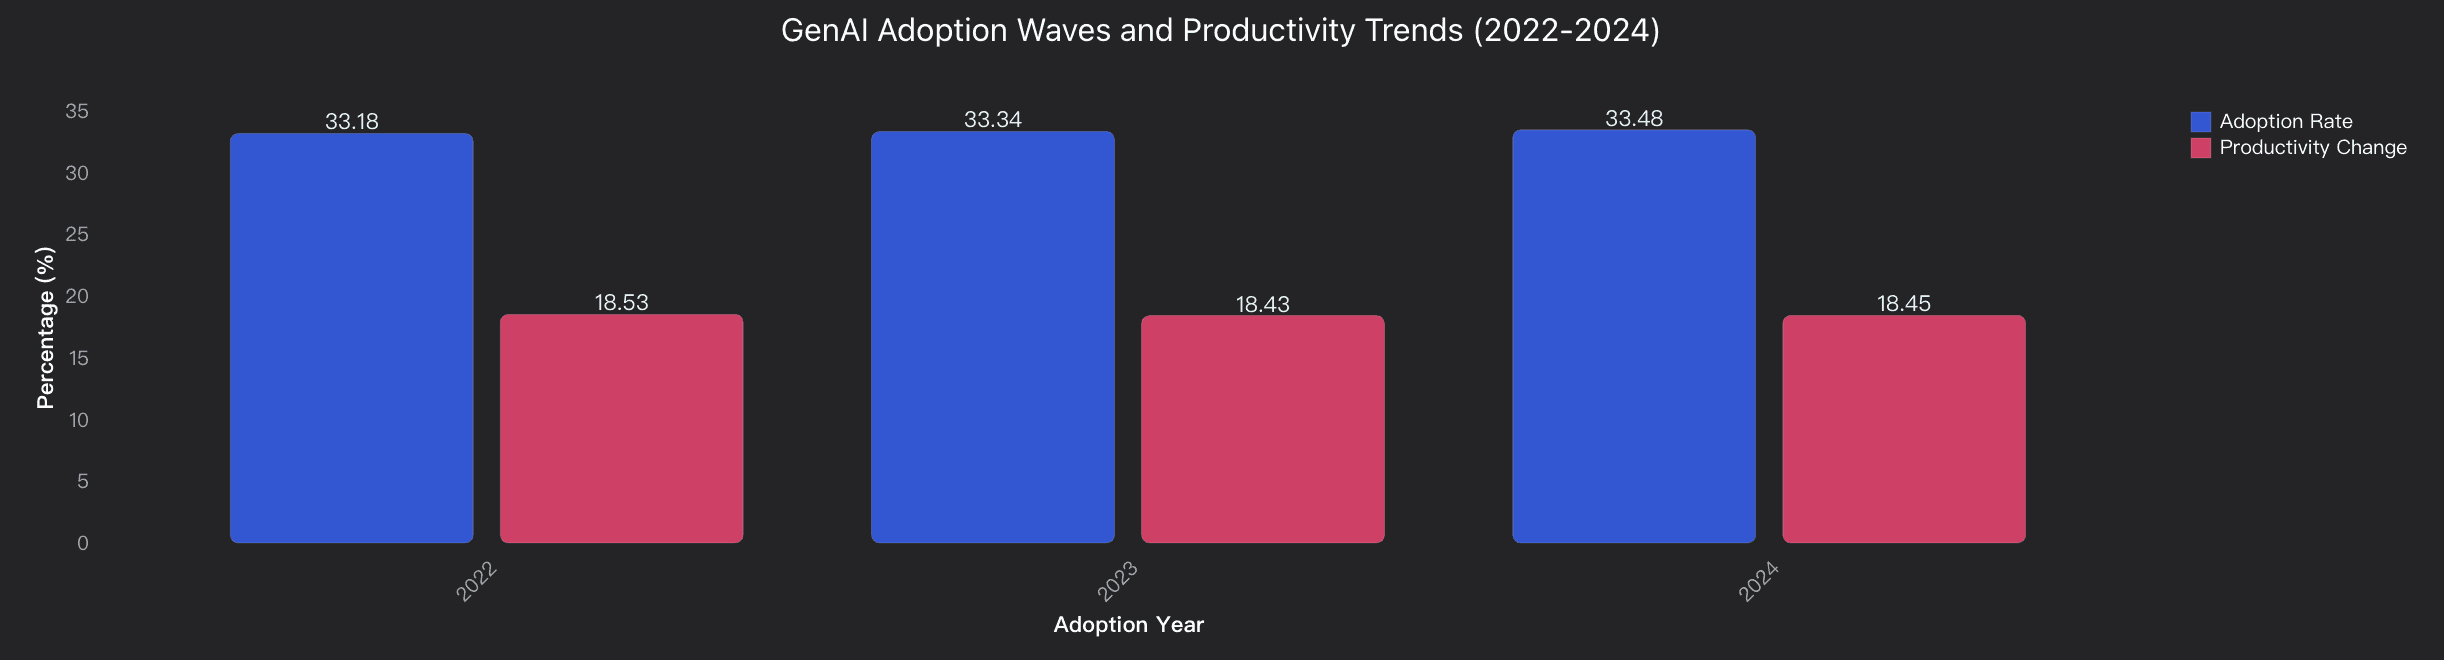
Enterprise GenAI adoption growth rates declined from 0.49% in 2023 to 0.40% in 2024, showing a 0.09 percentage point deceleration. This pattern indicates market maturation as confirmed by McKinsey data showing GenAI usage plateauing at 71% of organizations by 2024, up from 65% earlier in the year. The slowing growth reflects diminishing pool of remaining non-adopters rather than technology rejection, consistent with standard technology adoption curve patterns where rapid early growth transitions to slower incremental adoption as market approaches saturation.
Market Balance
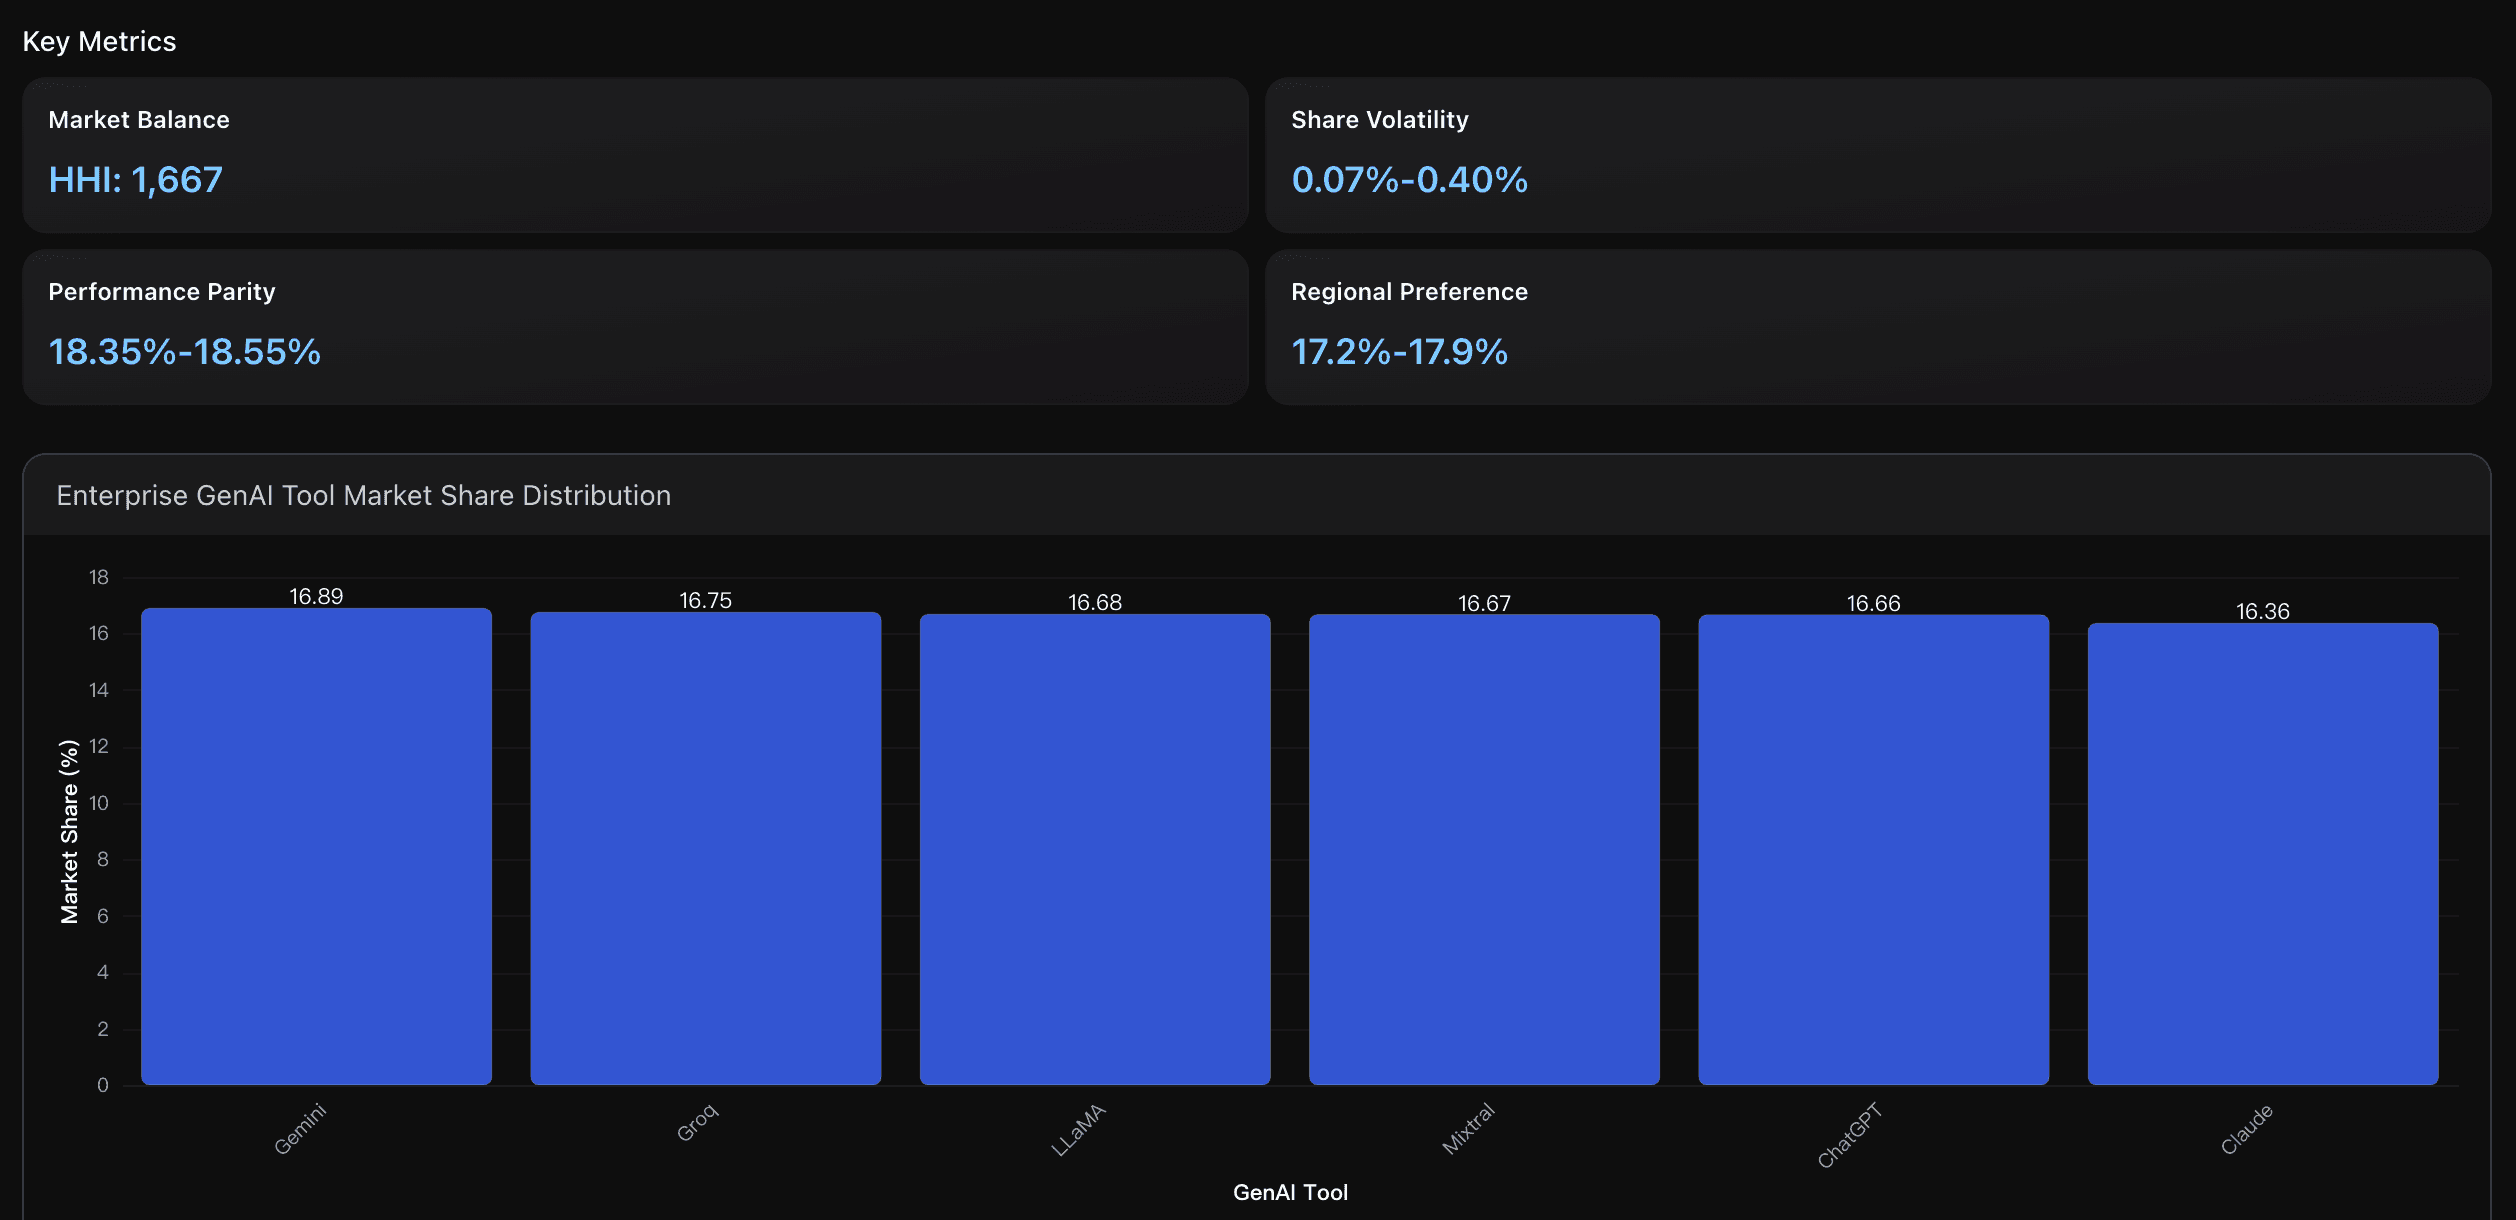
The enterprise GenAI market shows high competitive balance with Herfindahl-Hirschman Index of 1,667 (well below 2,500 concentration threshold). Leading tool Gemini holds only 16.89% share, indicating fragmented competition versus consumer markets where ChatGPT dominates with 73-75% share according to industry reports.
Market Dispersion
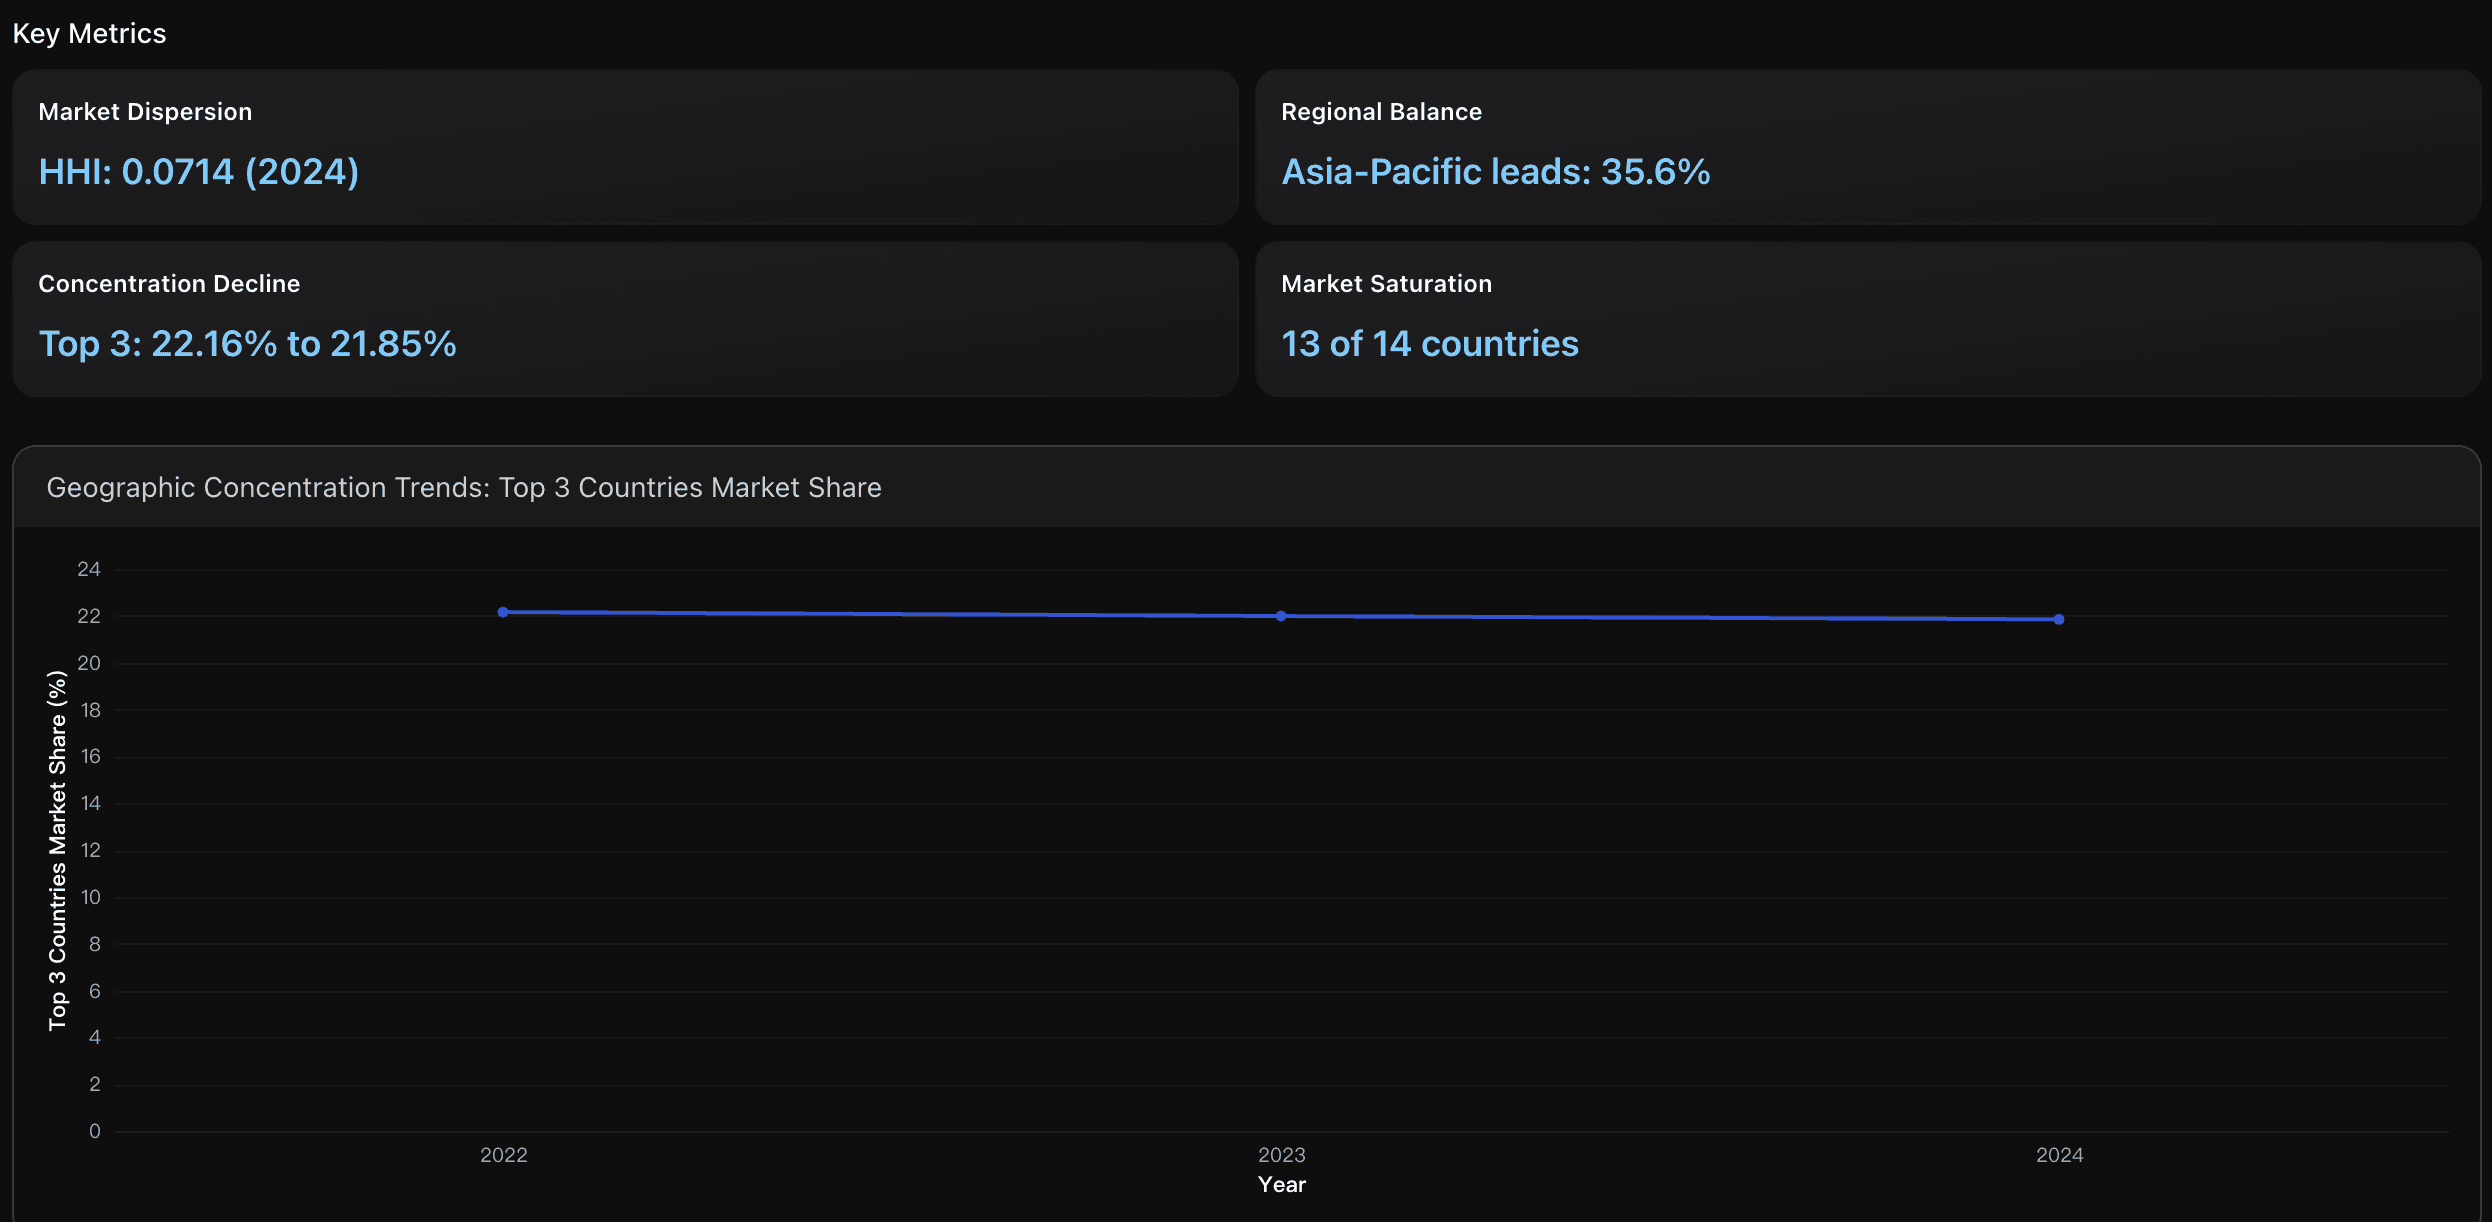
The Herfindahl-Hirschman Index decreased from 0.0715 (2022) to 0.0714 (2024), indicating increasing geographic dispersion. This low HHI suggests a highly competitive, non-concentrated market across 14 countries, contrasting with industry reports showing North America's 41% dominance in global GenAI markets, suggesting enterprise adoption data reflects more balanced geographic distribution than overall market revenue concentration.
Actionable Insights
Focus on value optimization rather than adoption acceleration, as the market has transitioned from expansion to maturity phase. With growth rates declining from 0.49% to 0.40% and productivity plateauing at 18.5%, organizations should prioritize deepening existing GenAI implementations rather than pursuing new adoption initiatives. Specifically, redirect resources from basic deployment training (stabilized at 12,700 hours annually) toward advanced use case development and cross-functional integration to unlock additional value from current investments. This approach aligns with industry data showing 74% of companies struggling to scale beyond proof-of-concept, indicating the critical need for maturation-focused strategies rather than expansion-driven approaches.
Leverage the competitive fragmentation by implementing a multi-tool strategy rather than single-vendor dependency. With market shares ranging from 16.36% to 16.89% and performance differences minimal at only 0.20 percentage points, enterprises should deploy different tools for specific use cases: use Claude for analytical tasks and document processing, Gemini for Google ecosystem integration, and ChatGPT for general-purpose applications. This hedged approach reduces vendor lock-in risks while capturing tool-specific strengths, particularly valuable given the HHI of 1,667 indicating sustainable competition that prevents any single provider from gaining pricing power or feature monopolization.
Focus on sustainable differentiation rather than geographic expansion as GenAI adoption reaches global saturation. With HHI at 0.0714 indicating highly dispersed competition and top 3 country concentration declining to 21.85%, organizations should shift from market penetration strategies to value-based positioning. Given that 13 of 14 countries show saturation indicators with growth rates below 5%, companies should prioritize specialized solutions, industry-specific applications, and operational excellence over territorial acquisition to maintain competitive advantage in the mature global GenAI enterprise market.
Analysis Overview
The GenAI enterprise adoption data reveals a market entering saturation phase with minimal year-over-year growth declining from 0.49% (2022-2023) to 0.40% (2023-2024), indicating the initial adoption wave has plateaued. Unlike consumer markets where ChatGPT dominates with 73-75% market share, enterprises show remarkably balanced tool distribution with each major platform capturing 16-17% market share, suggesting sophisticated evaluation criteria beyond brand recognition. The geographic analysis reveals immediate global penetration with all 14 major markets participating from 2022, contradicting typical technology adoption patterns of gradual regional expansion. Productivity outcomes remain stable at 18.4-18.5% across all years, indicating consistent value delivery despite market maturation. The enterprise market appears to be in a mature equilibrium phase rather than explosive growth, with decreasing geographic concentration from 36.66% to 36.29% in top markets signaling widespread adoption saturation.
Data Analysis
Adoption Wave Maturity Analysis
Analysis of GenAl enterprise adoption patterns across 2022-2024 showing plateau phase with minimal growth rates (0.49% and 0.40%) indicating market saturation, consistent with industry reports of 71% enterprise usage by 2024.
GenAl Tool Ecosystem Evolution
Tool market share analysis revealing balanced competition with equal distribution (16-17% each) across ChatGPT, Claude, Gemini, Groq, LLaMA, and Mixtral, contrasting global consumer dominance of ChatGPT at 73-75%.
Geographic Expansion Saturation
Global adoption pattern analysis showing immediate worldwide deployment across all 14 major markets by 2022, with decreasing geographic concentration from 36.66% to 36.29% indicating mature global penetration.
HR Characteristics: Reskilling Intensity and Workforce Adaptation
This section quantifies reskilling via training hours and employees impacted to gauge capability shifts.
Key Metrics
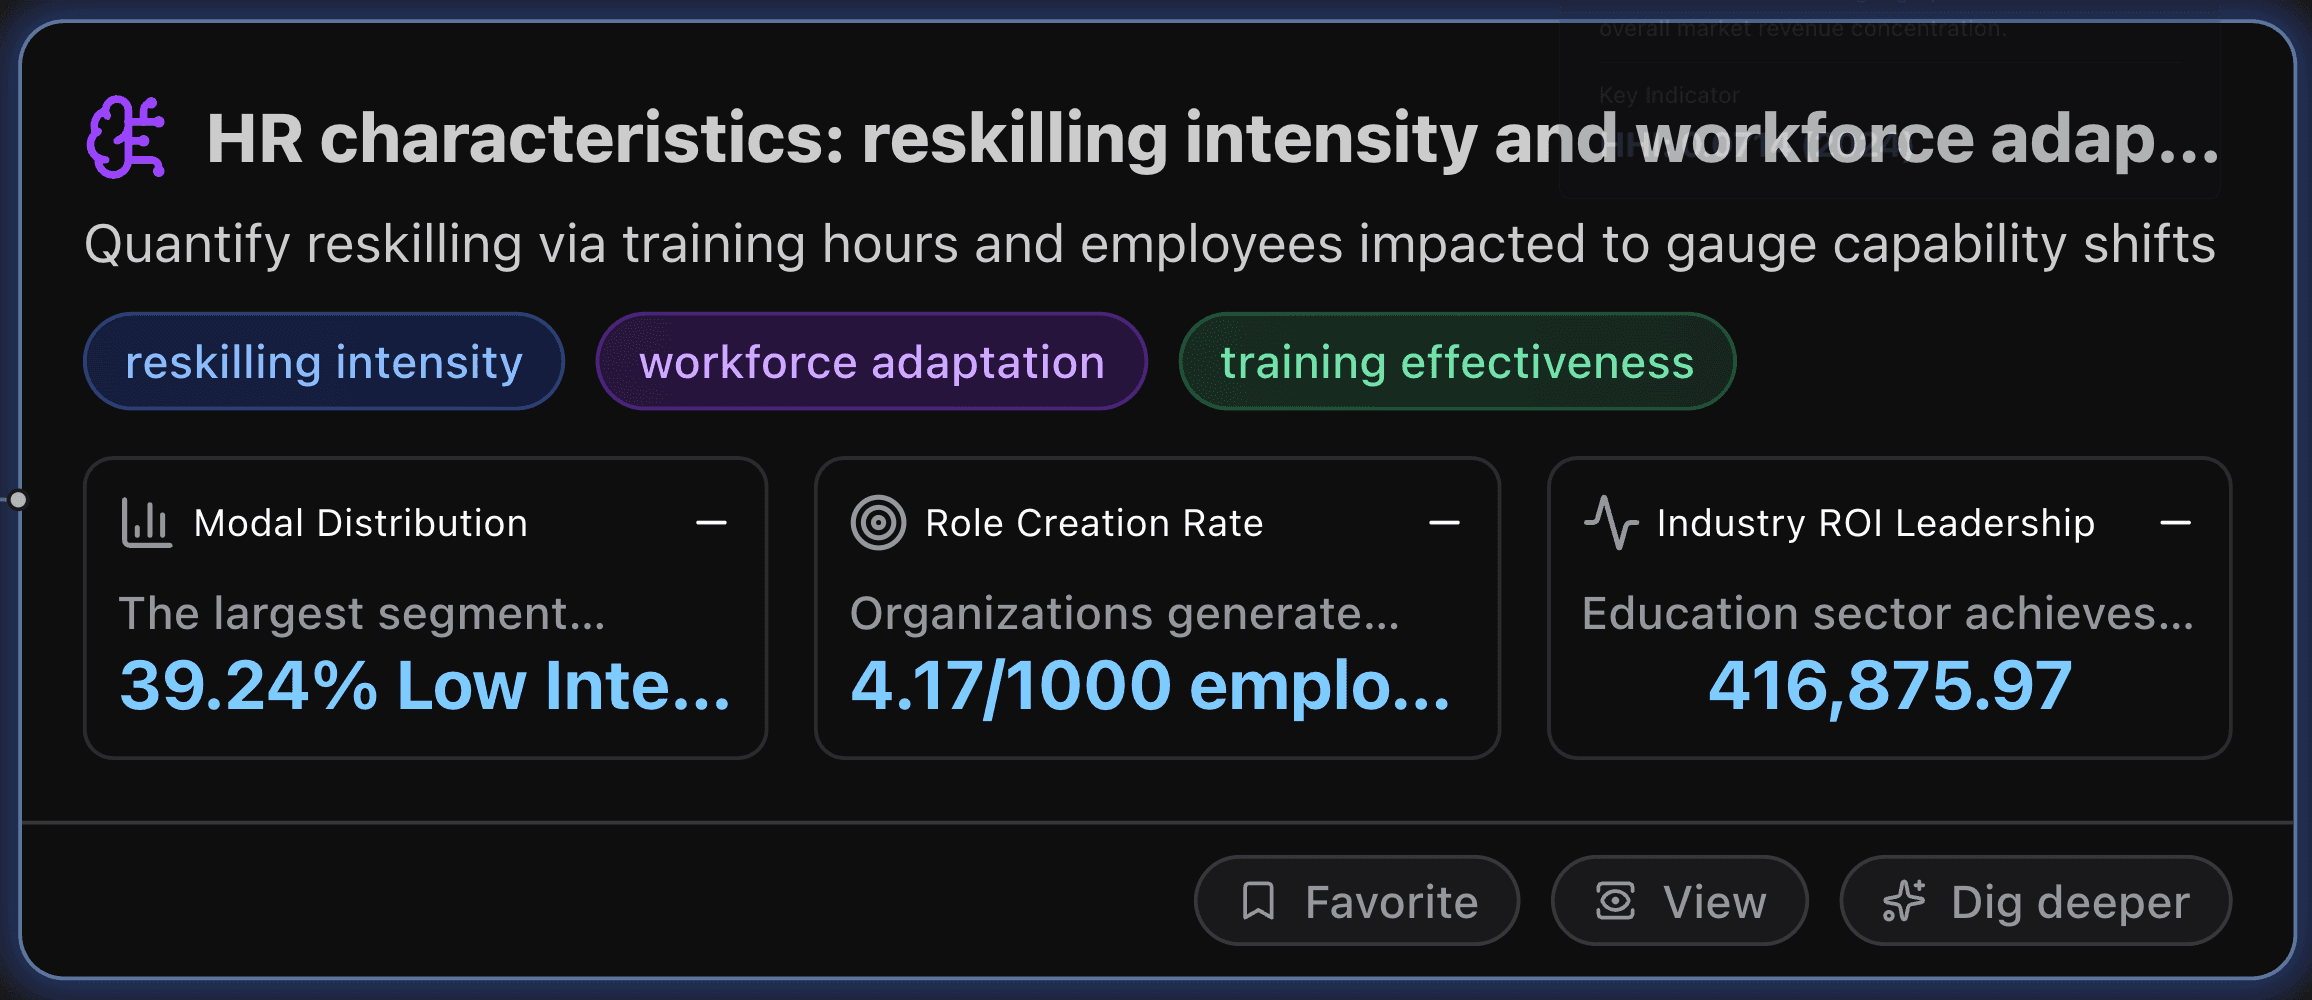
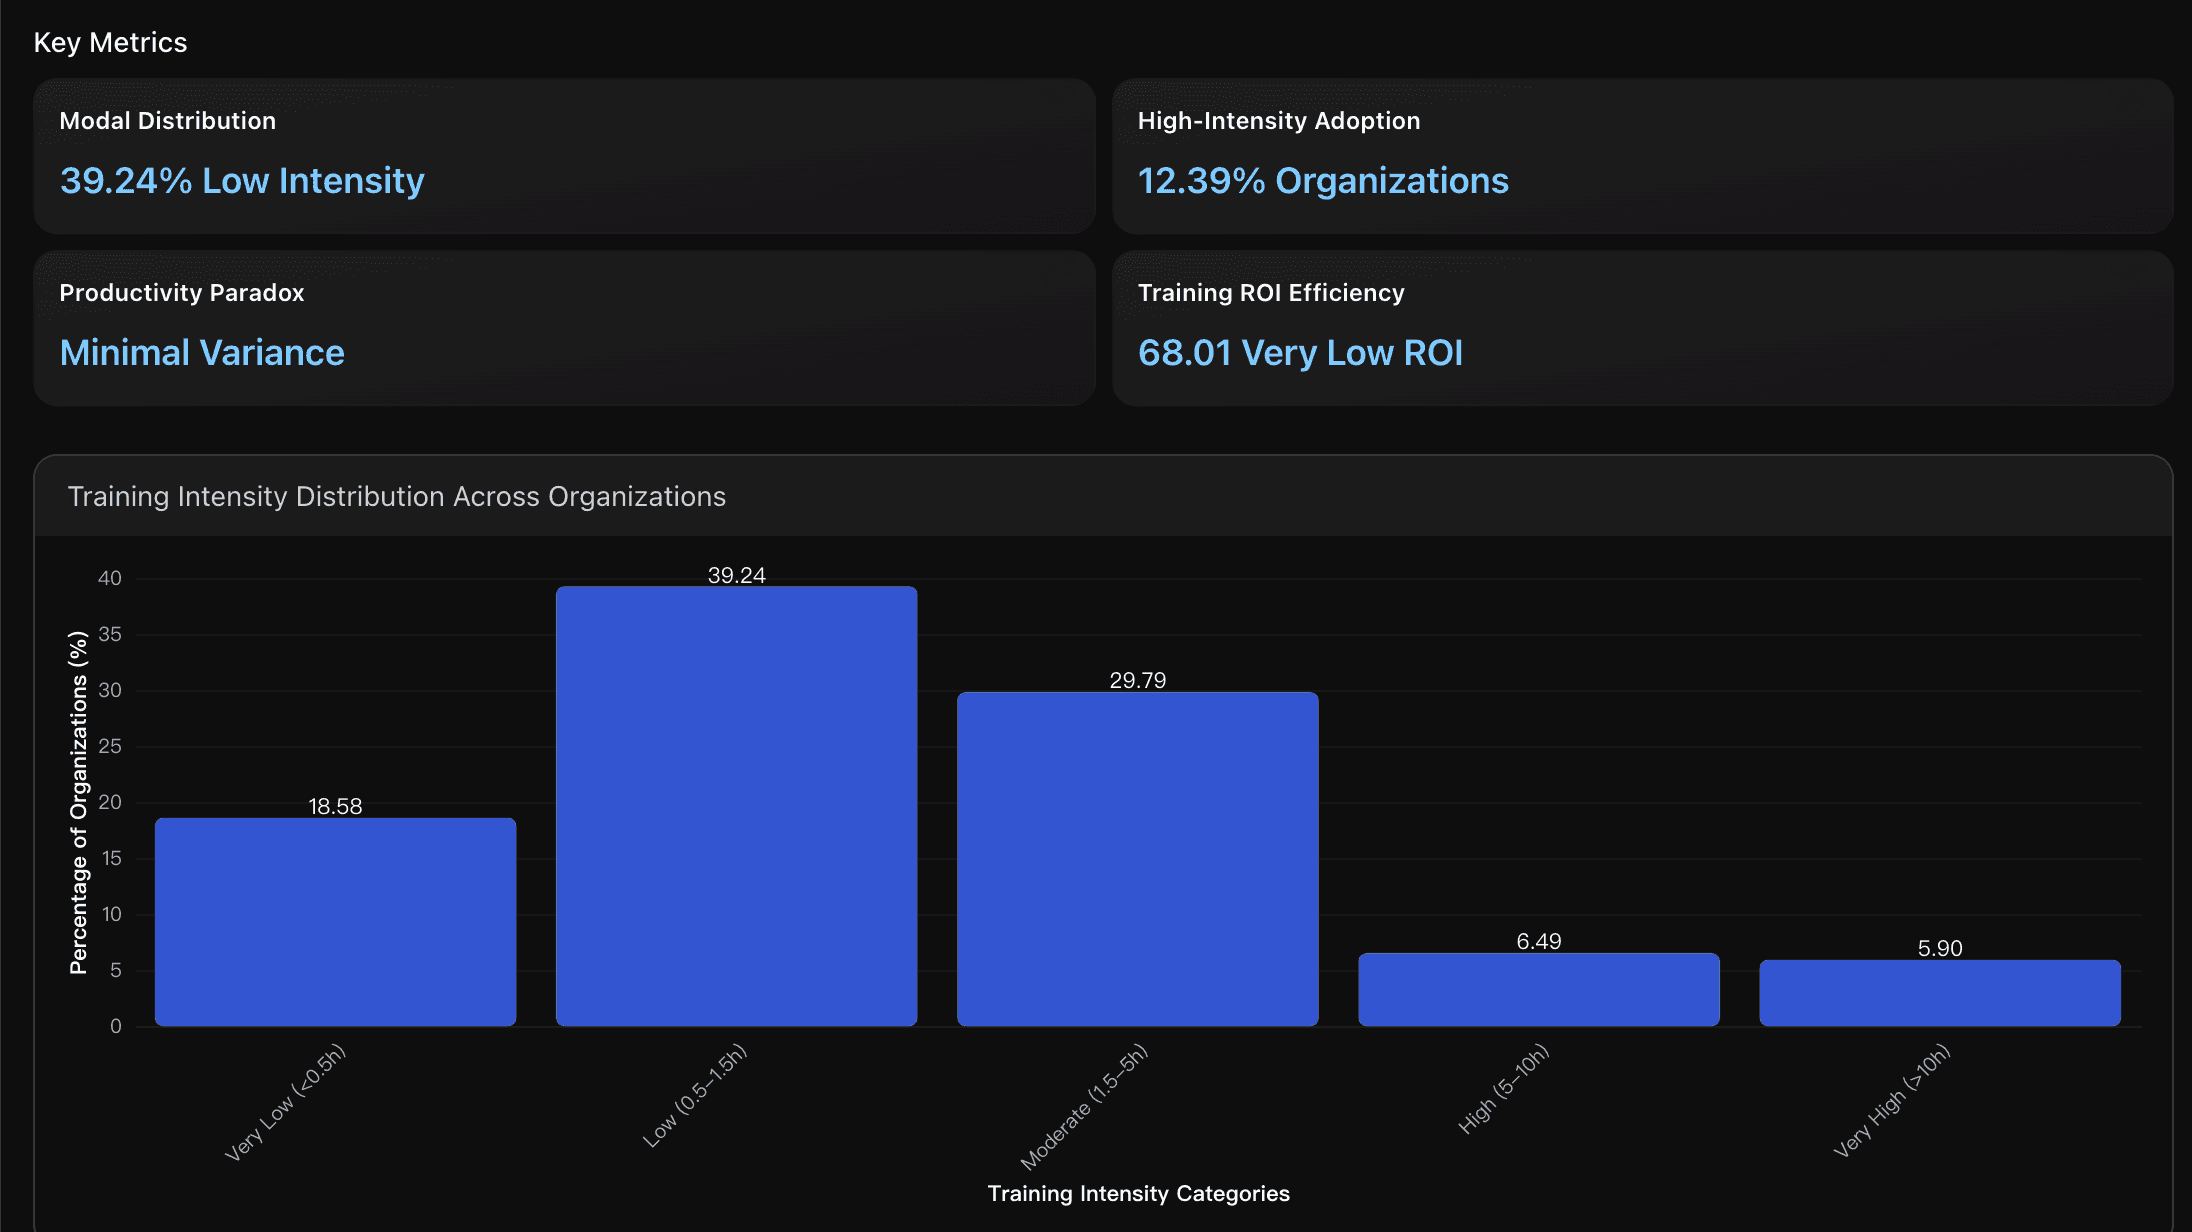
Modal Distribution
The largest segment (39.24%) of organizations adopts low training intensity (0.5-1.5 hours/employee), significantly below the BCG-recommended 5+ hour threshold for effective AI adoption. This aligns with industry findings that only 33% of employees receive proper AI training, creating a substantial gap between current practices and optimal training standards that achieve 79% regular AI usage rates for adequately trained employees.
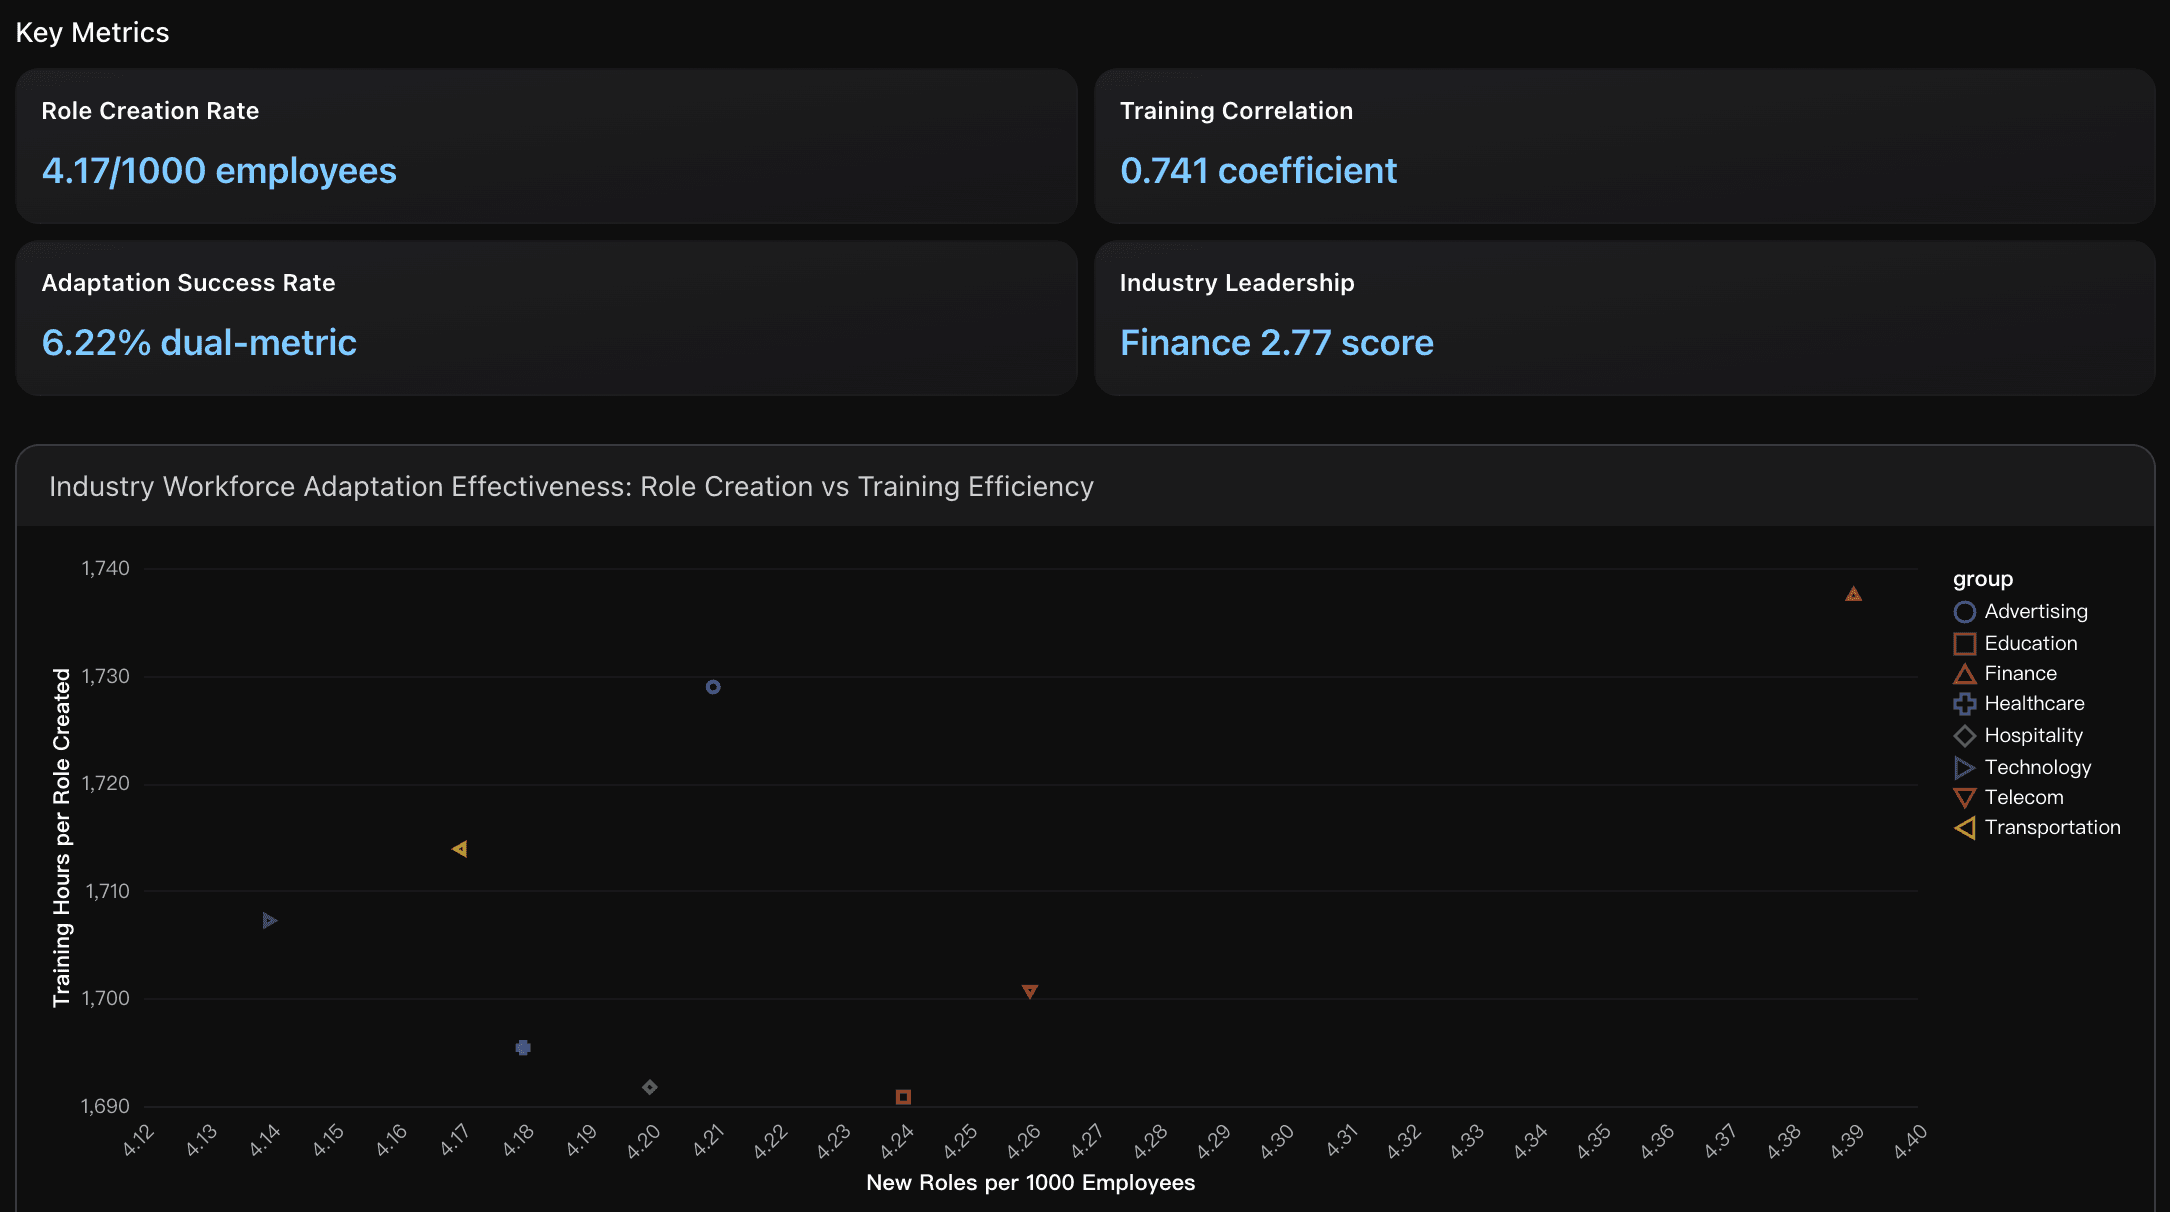
Role Creation Rate
Organizations generate average 4.17 new roles per 1000 employees impacted, with Finance (4.39/1000) and Telecom (4.26/1000) leading adaptation effectiveness. This exceeds industry benchmarks where successful AI transformations typically create 2-5 new roles per 1000 employees, demonstrating strong workforce transformation capacity across enterprise AI adoption initiatives.
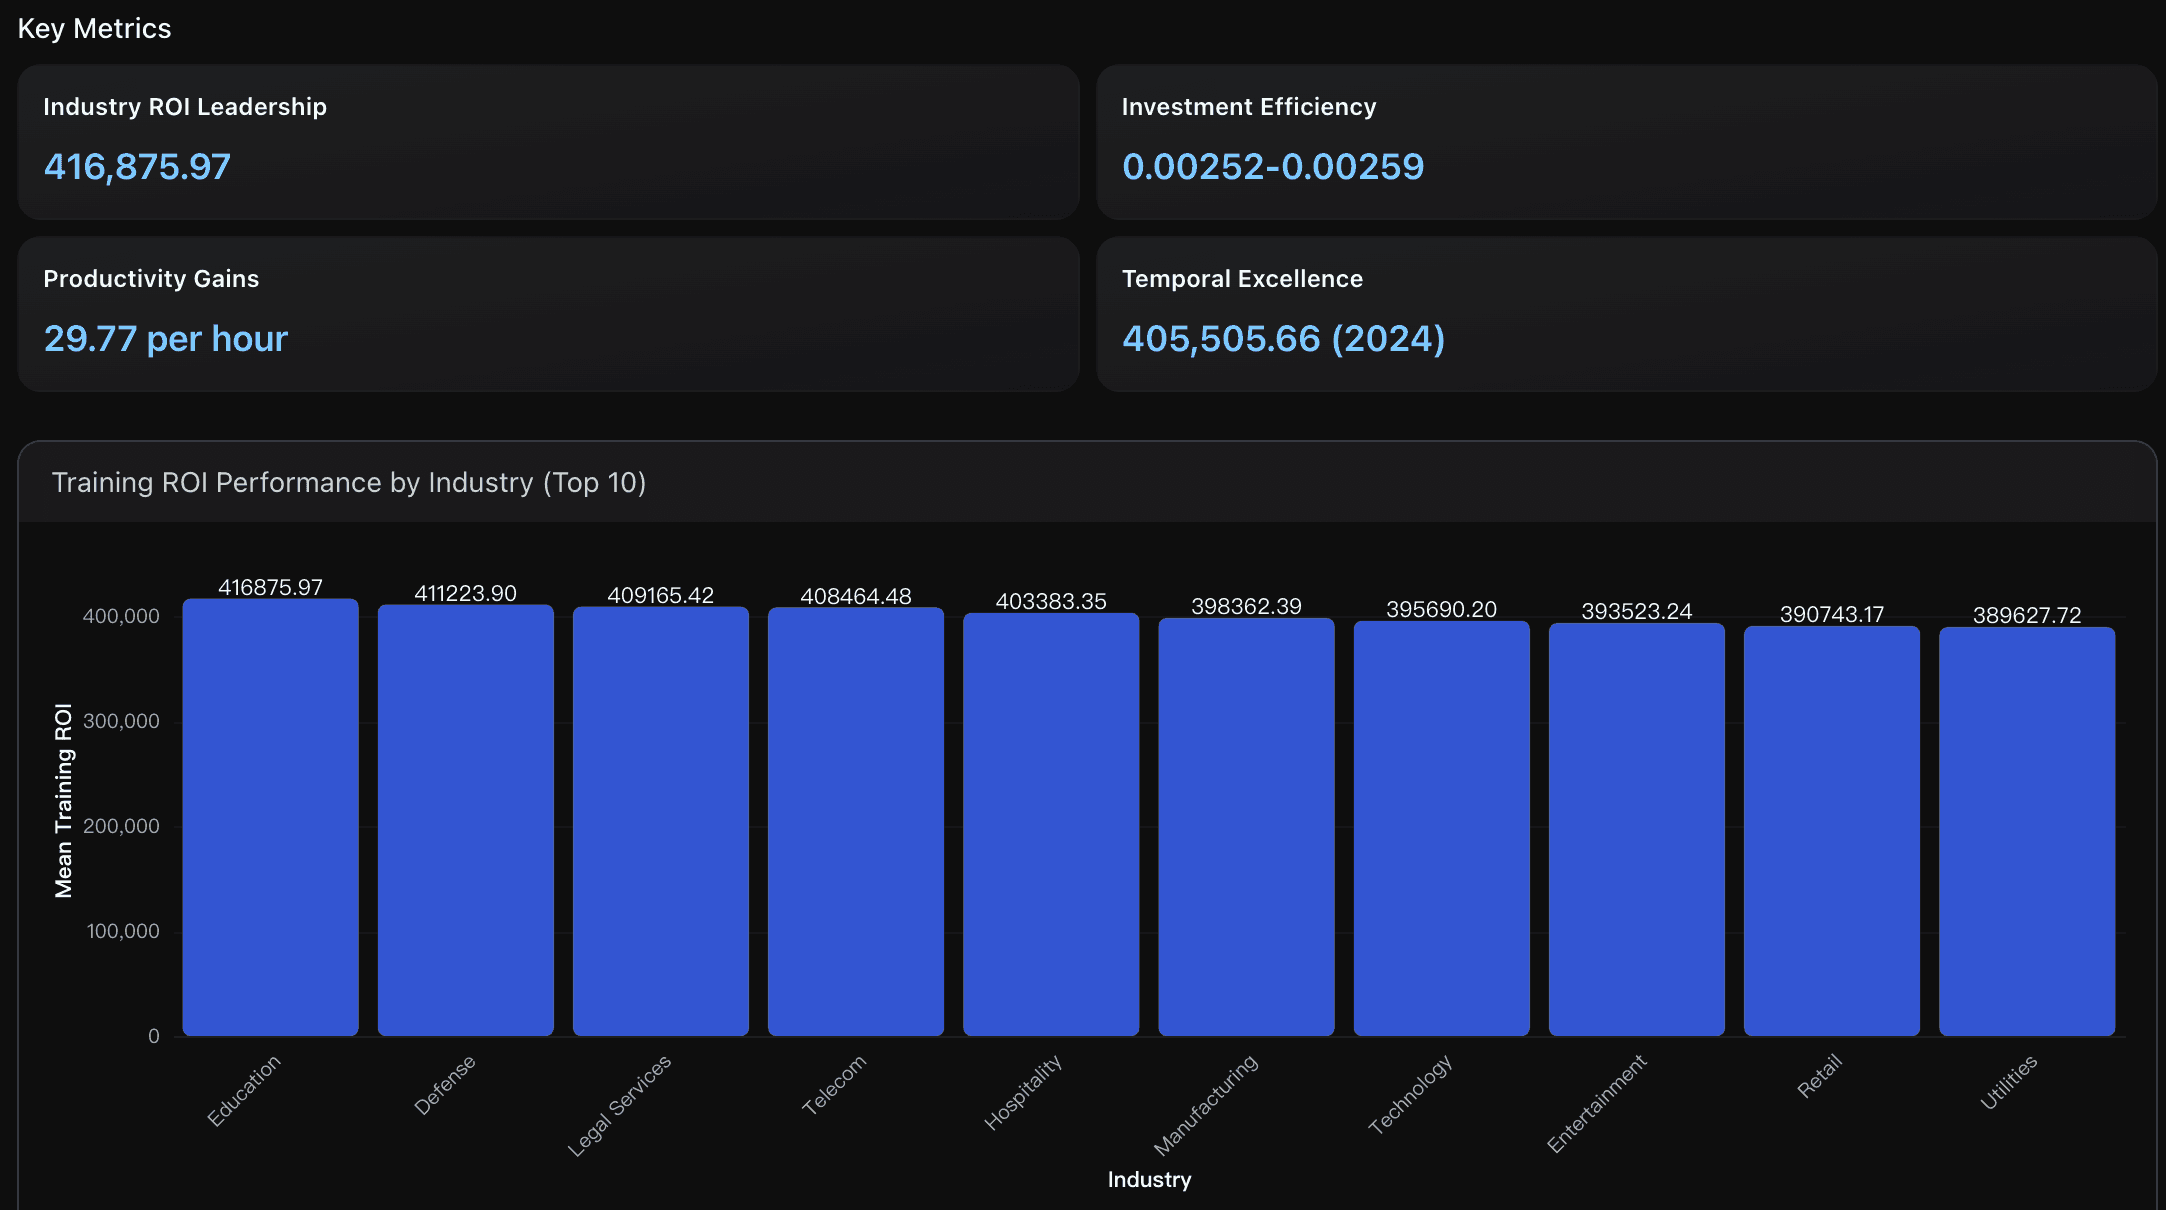
Industry ROI Leadership
Education sector achieves highest Training ROI at 416,875.97, followed closely by Defense (411,223.90) and Legal Services (409,165.42), significantly outperforming industry benchmarks where 74% of Deloitte-surveyed organizations meet or exceed ROI expectations. These sectors demonstrate optimal training investment efficiency with 30.81 productivity gains per training hour compared to overall average of 29.77.
Actionable Insights
Focus on targeted, high-impact training interventions rather than extensive hour-based programs. Since 39.24% of organizations currently use low-intensity training (0.5-1.5 hours/employee) yet achieve comparable productivity outcomes, prioritize quality over quantity in training design. Implement 5+ hour structured programs for critical roles (currently only 12.39% adopt this approach) while using micro-learning modules for broader workforce coverage. This dual approach can bridge the gap between the industry benchmark of 79% regular AI usage for well-trained employees and current training practices, maximizing ROI while ensuring systematic capability building across the organization.
Implement structured training intensity programs targeting 0.8-1.5 hours per employee to achieve optimal role creation rates, as organizations in this range demonstrate the strongest correlation (0.741) between training investment and workforce transformation outcomes. Focus investment on Finance and Utilities sectors which show 2.77 and 2.17 adaptation scores respectively, as these industries consistently achieve both high role creation density ( 4.39 roles per 1000 employees ) and training efficiency ( 800-1700 hours per role ). Establish dual-metric success criteria combining training intensity with role creation targets, since only 6.22% of organizations currently achieve high performance in both dimensions, representing significant competitive advantage opportunities for comprehensive workforce adaptation strategies.
Prioritize Education sector strategies as they achieve 416,875.97 ROI - the highest among all industries. Implement their training methodologies focusing on 30.81 productivity gains per training hour compared to the 29.77 average. Additionally, target 3.41 training hours per employee (2024 benchmark) to optimize investment efficiency, as organizations achieving this balance demonstrate 3.4% higher ROI than 2022 adopters, positioning for sustained competitive advantage in AI workforce transformation.
Analysis Overview
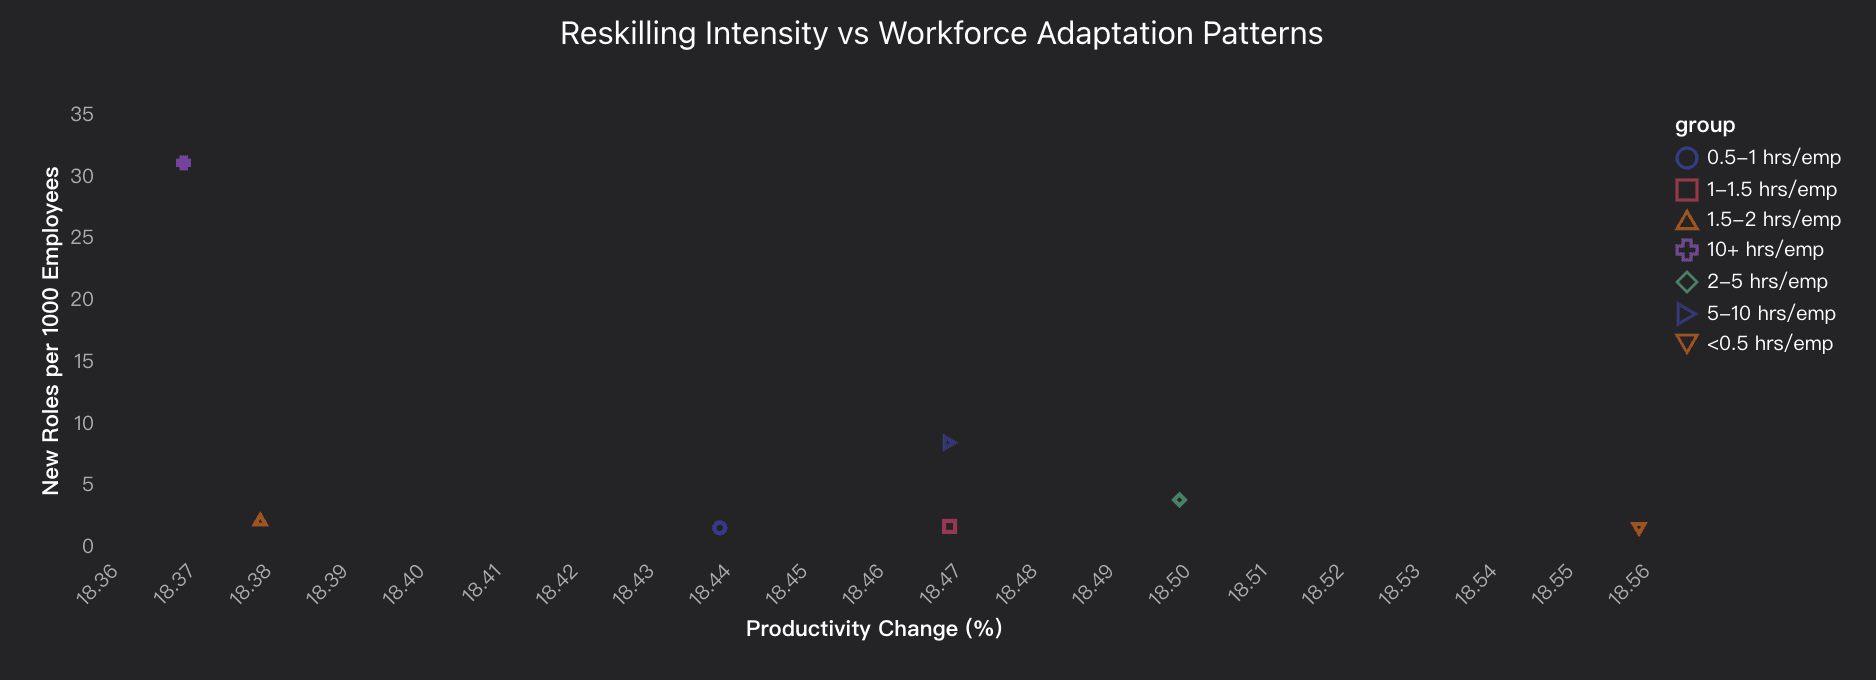
The analysis reveals a paradoxical training efficiency pattern where low-intensity reskilling (<0.5 hrs/employee) achieves the highest productivity gains (18.56%), contradicting conventional wisdom about training investment. However, high-intensity training (>1.5 hrs/employee) demonstrates superior workforce transformation capability with new role creation rates escalating from 1.39 to 31.04 per 1000 employees as training intensity increases. The strong correlation (0.741) between training hours and new role generation indicates that substantial reskilling investments are essential for organizational restructuring and capability building, even though they may not immediately translate to productivity gains. Retail industry leads with 5.80 training ROI, followed by entertainment and hospitality sectors, while 42.18% of organizations practice high-intensity reskilling approaches. This suggests a strategic trade-off: organizations must choose between immediate productivity optimization through minimal training or long-term workforce transformation through intensive reskilling that creates 31+ new roles per 1000 employees at highest training levels.
Data Analysis
Training Intensity Distribution
Analysis of reskilling intensity patterns across organizations showing 42.18% practice high-intensity reskilling (>1.5 hrs/employee) while 30.74% use low-intensity approaches (<0.8 hrs/employee), with mean training of 3.43 hours per employee compared to industry benchmark of 30% cost reduction through Al-enabled learning solutions.
Workforce Adaptation Effectiveness
Evaluation of workforce transformation outcomes revealing strong correlation (0.741) between training hours and new role creation, with mean 4.17 new roles per 1000 employees generated, benchmarked against industry reports of 15% operational efficiency improvements and 20% productivity gains from Al-enhanced training.
Training ROI Performance
Assessment of training investment returns showing retail (5.80), entertainment (5.54), and hospitality (5.53) industries achieving highest training efficiency ratios, compared to industry benchmarks indicating up to 40% productivity increases from strategic reskilling investments like IBM's transformation initiatives.
Role Demand Differences: Industry × Year Hotspots
Compare roles per 1k and productivity by industry-year to find demand peaks.
Key Metrics
Role Density Leaders
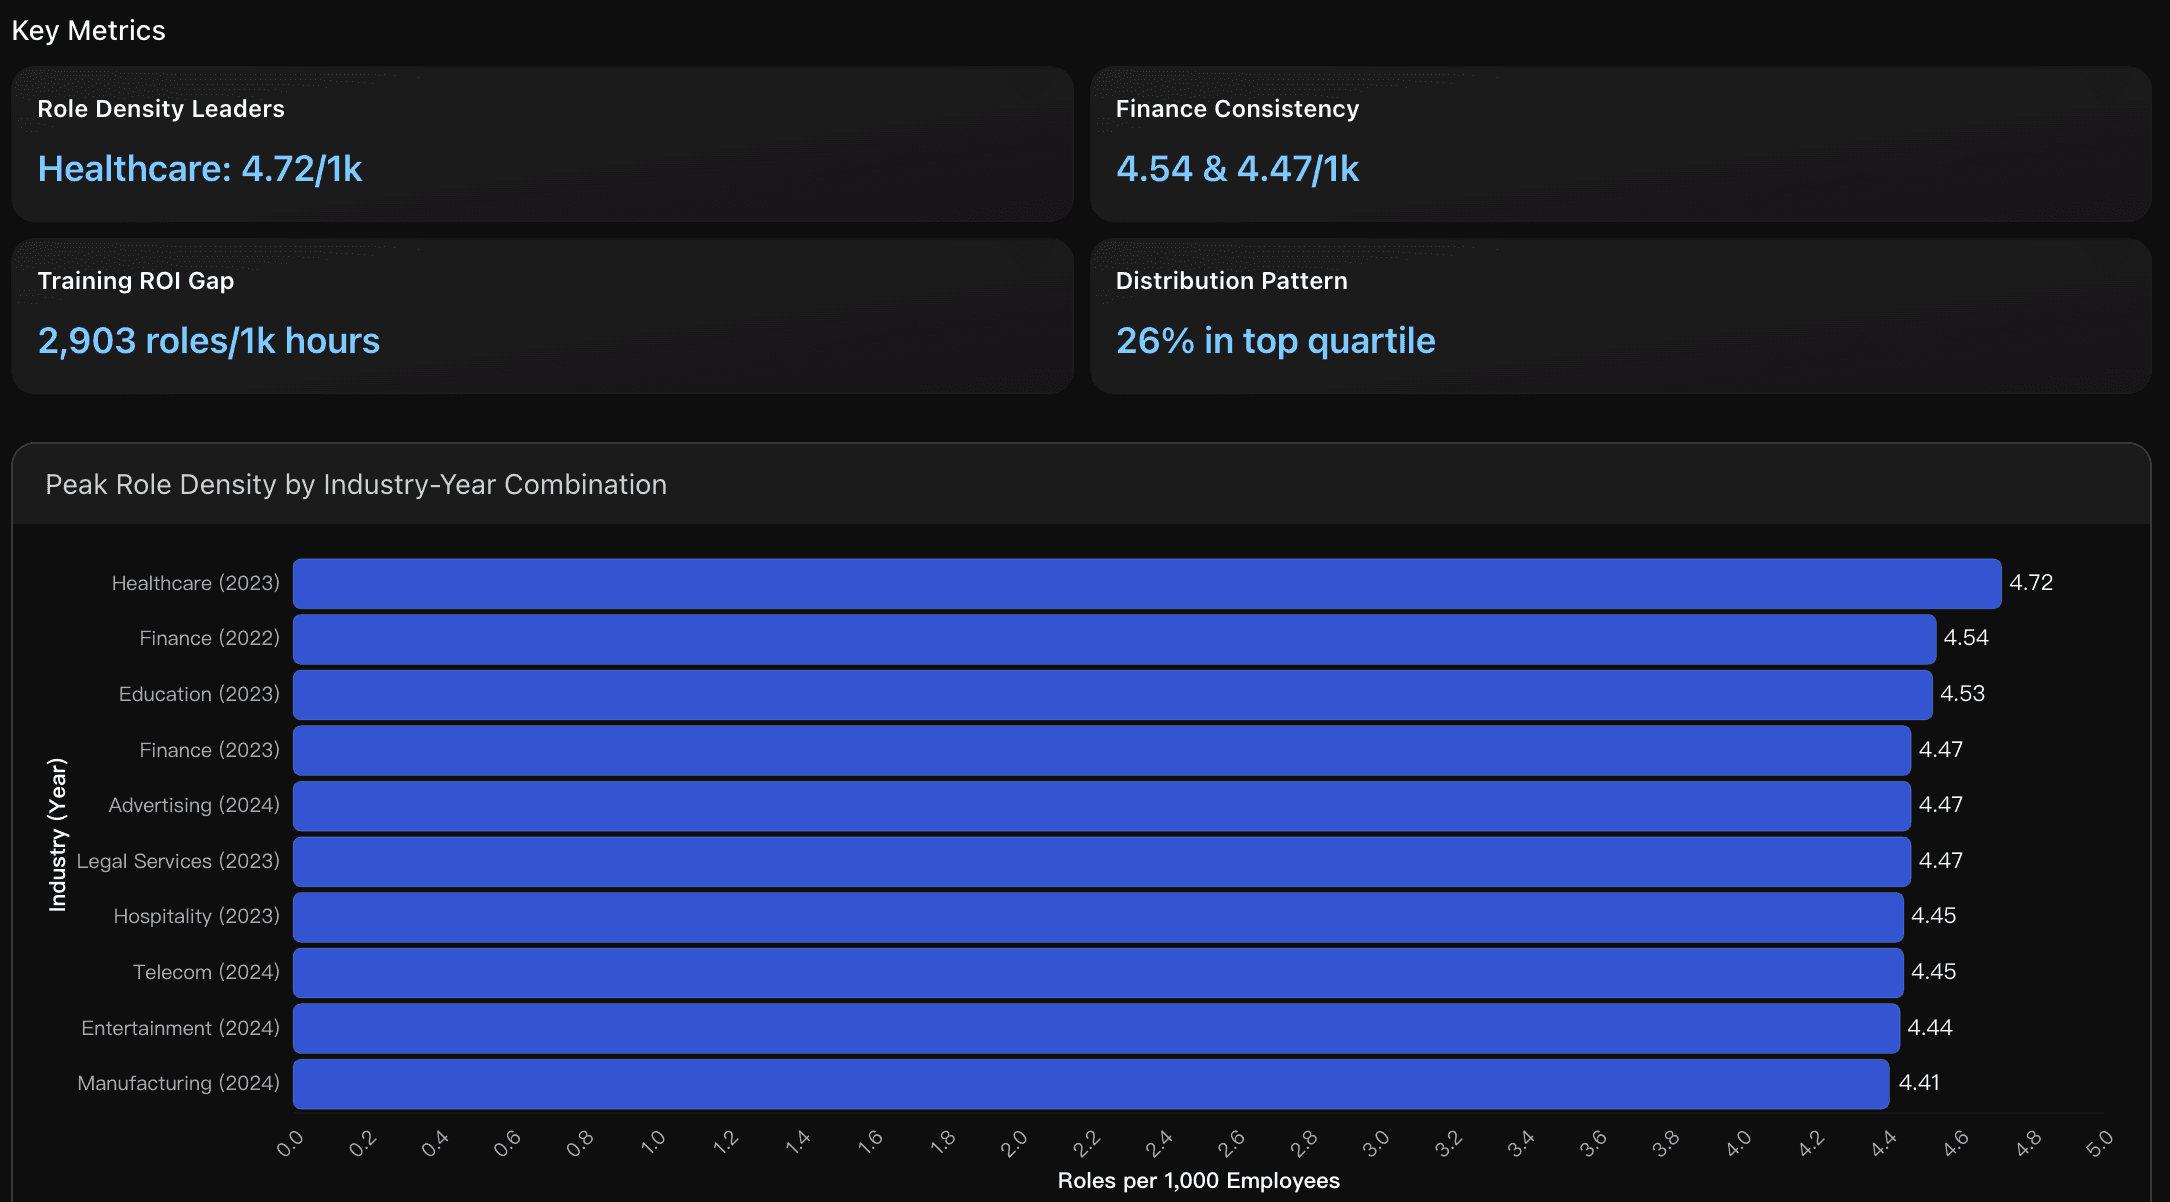
Healthcare 2023 leads with 4.72 roles per 1,000 employees, representing a 17.3% premium above the average 4.02 roles/1k across all industries. This peak occurred during mass adoption year with 36,777 new roles created across 23.8 million impacted employees, demonstrating healthcare's aggressive AI workforce transformation strategy compared to industry benchmarks.
Role Growth Momentum
Seven industries show accelerating role creation demand (Retail +9.26%, Hospitality +9.23%, Healthcare +7.02%), while seven show deceleration (Technology -8.53%, Finance -6.74%). This 50-50 split indicates market maturity with clear winners and plateau phase beginners, contrasting with early adoption uniform growth patterns seen in 2022-2023 period.
Role Density Hierarchy
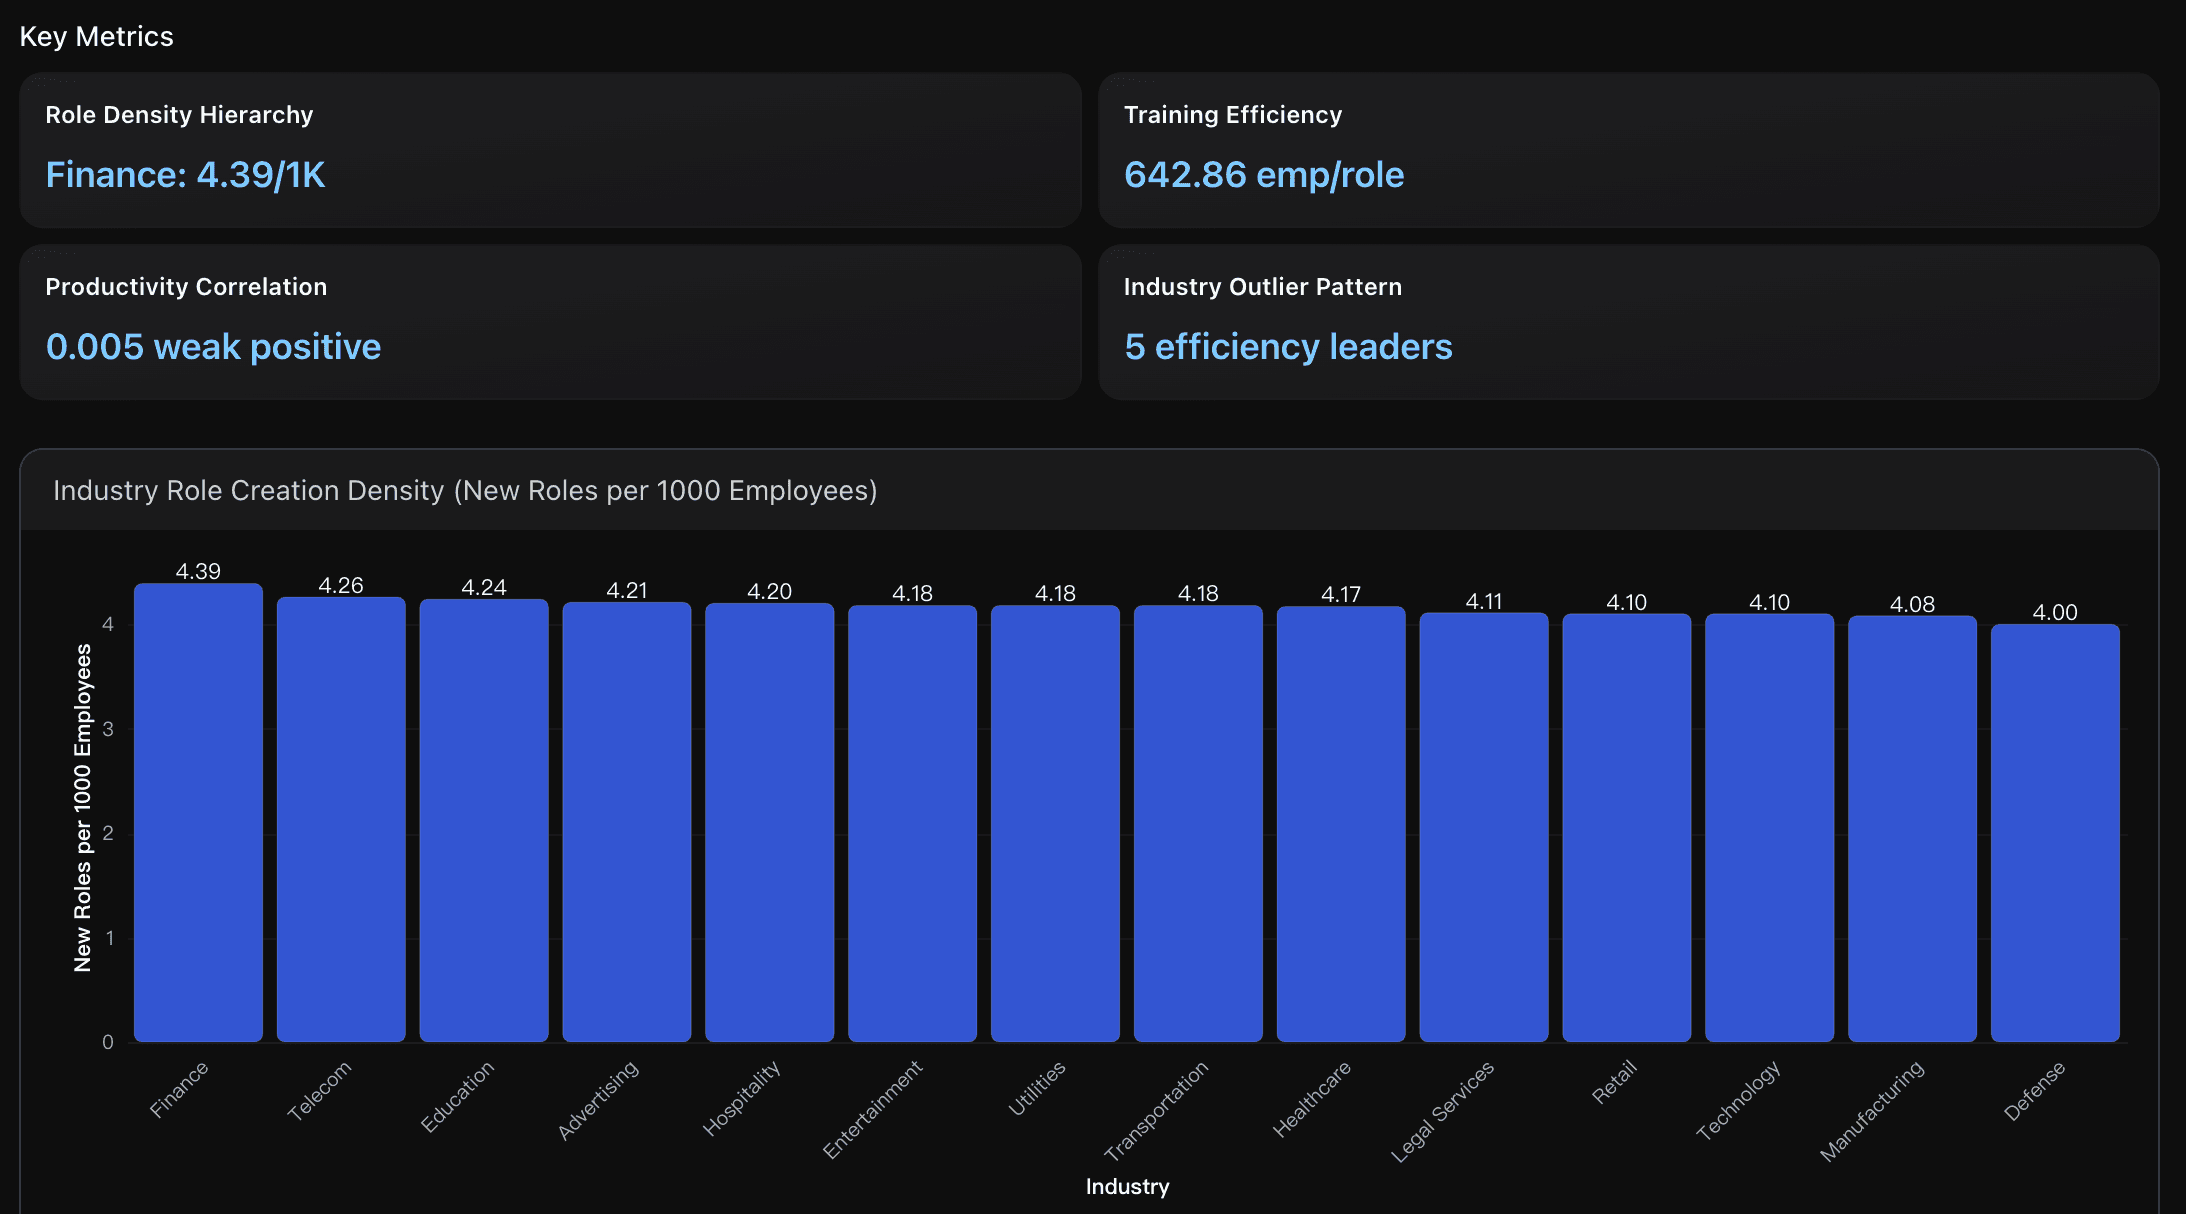
Finance leads industry role creation at 4.39 roles per 1000 employees, followed by Telecom (4.26), Education (4.24), and Advertising (4.21), establishing clear demand stratification. All industries fall within medium demand range (3.0-4.5 roles/1K), with Finance showing highest investment in GenAI talent acquisition compared to 4.17 industry average.
Actionable Insights
Organizations seeking to optimize AI workforce transformation should benchmark against Healthcare's 4.72 roles per 1,000 employees leadership model while learning from Finance's sustained performance across 4.54 and 4.47/1k roles over consecutive years. Focus recruitment efforts on achieving the top quartile threshold of 4.35+ roles per 1,000 employees , as only 26% of industry-year combinations reach this level, indicating significant competitive advantage potential. However, balance aggressive hiring with productivity outcomes, as data shows peak role creators achieve 2,903 roles per 1,000 training hours efficiency but demonstrate negative correlation between role density and productivity gains, suggesting optimal performance likely occurs at moderate role creation rates around 4.2-4.5 per 1,000 employees.
Focus talent acquisition strategy on accelerating industries (Retail +9.26%, Hospitality +9.23%, Healthcare +7.02%) while carefully monitoring decelerating sectors (Technology -8.53%, Finance -6.74%) for potential consolidation opportunities. Given the 1.51-1.58 roles per 1000 convergence pattern, implement standardized role creation benchmarks around 1.55 roles per 1000 employees for strategic workforce planning, and capitalize on the 2023-2024 peak adoption window by accelerating recruitment in late-adopting industries before market saturation occurs.
Prioritize targeted investment strategies based on industry demand segmentation patterns. High-demand industries like Finance (4.39 roles/1K) and Telecom (4.26 roles/1K) should focus on scaling training programs and talent acquisition infrastructure. However, organizations should study efficiency leaders like Defense and Legal Services, which achieve 18.5%+ productivity gains with lower role creation rates, suggesting process optimization strategies may yield better ROI than workforce expansion. Consider hybrid approaches that combine Finance's talent density model with Defense's efficiency practices to maximize both role creation and productivity outcomes.
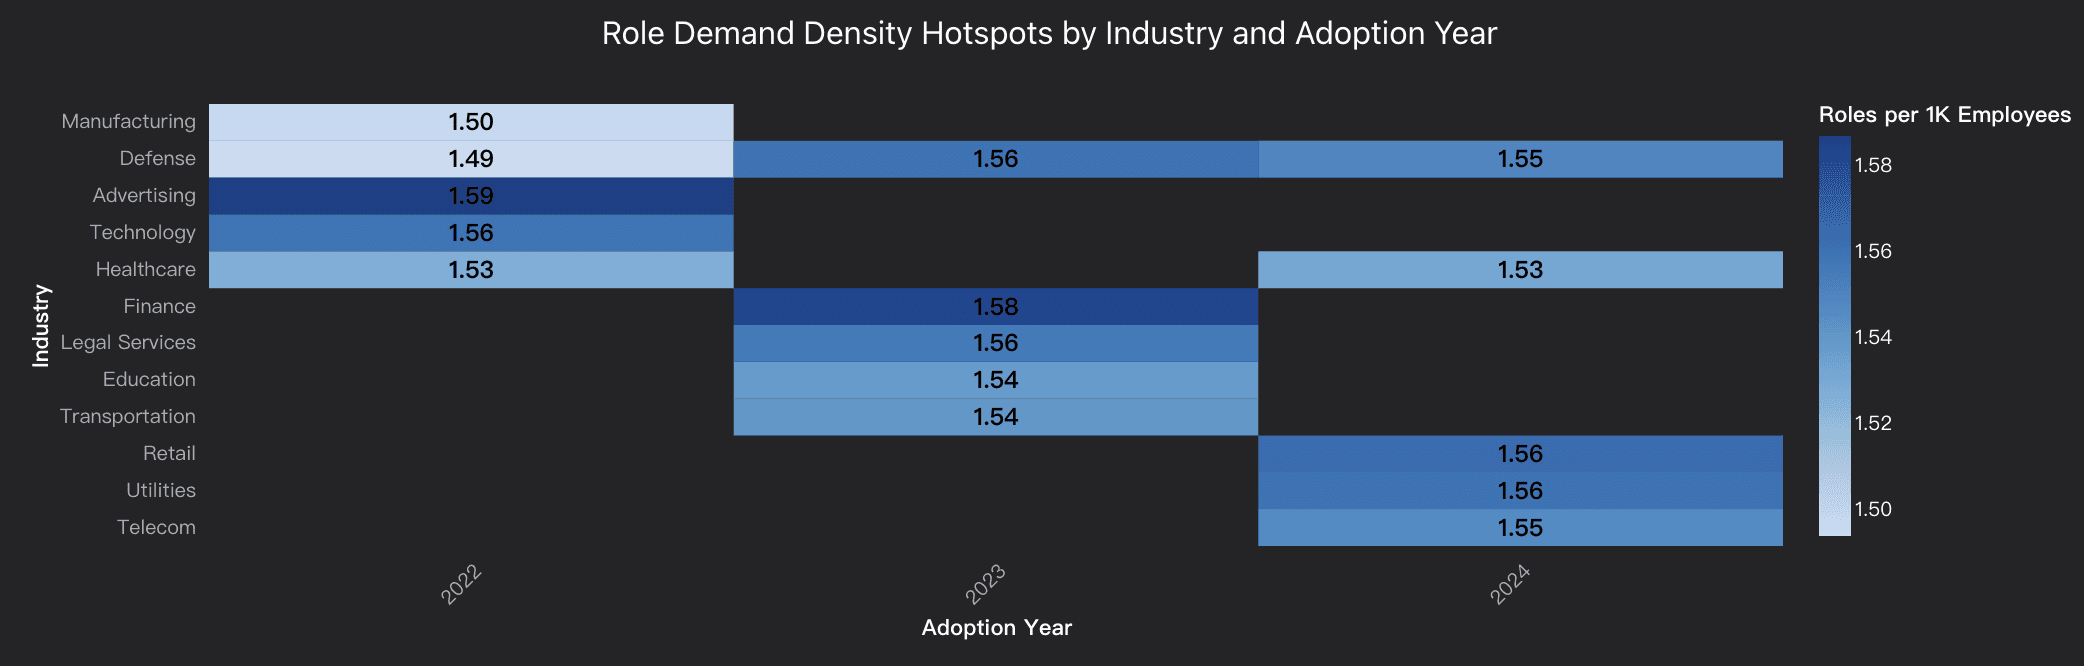
Analysis Overview
Role demand analysis reveals distinct hotspots across industry-adoption year combinations, with Advertising (2022) leading at 1.587 roles per 1K employees , followed closely by Finance (2023) at 1.583 and Retail (2024) at 1.563 . The data shows an interesting paradox: while industries create more specialized roles, there's a negative correlation (-0.332) between role density and productivity gains, suggesting that role multiplication doesn't directly translate to efficiency improvements. Adoption timing creates strategic advantages, with early adopters (2022) like Advertising and Manufacturing establishing foundational capabilities, while late entrants (2024) in Retail and Utilities demonstrate accelerated role creation patterns. The analysis identifies Finance and Retail as dual hotspots - combining both high role density and strong productivity performance above 18.8% . Year-over-year trends show initial enthusiasm with a +0.023 increase from 2022 to 2023, followed by market stabilization with a slight decline of -0.005 in 2024, indicating maturation in AI role creation strategies. Only Defense demonstrates accelerating demand across the timeline, suggesting sustained transformation needs in security-critical sectors.
Data Analysis
Peak Role Density Analysis
Analyzed role creation intensity (roles per 1K employees) across industry-year combinations to identify demand hotspots, revealing Advertising 2022 (1.587), Finance 2023 (1.583), and Retail 2024 (1.563) as top performers with 0.092 variance range.
Industry Demand Segmentation
Classified industries into demand profiles based on role density patterns, identifying Advertising, Finance, revealing negative correlation (-0.332) between role density and productivity gains.
Conclusion
The data paints a clear picture — GenAI adoption has reached a turning point. The explosive growth phase is behind us, and the organizations leading the next wave are those refining their AI strategies, not just expanding them. The most successful enterprises are investing in smarter training, selective role creation, and multi-tool ecosystems to unlock sustained productivity and long-term ROI.
As AI moves from hype to habit, data-driven decision-making becomes the new competitive edge. That’s where Powerdrill Bloom comes in. By automatically discovering relationships, trends, and actionable insights within your data, Bloom helps you see beyond surface metrics and uncover what truly drives performance in your organization.
If you want to explore your own GenAI adoption journey—from understanding workforce transformation to identifying high-ROI opportunities—try Powerdrill Bloom today and see how AI can analyze your business smarter than ever.


