Insights into Car Sales Trends: Brand Value, Usage Impact, and Pricing
Ma Li
Oct 29, 2024
This report is powered by Powerdrill—an AI-driven data analysis tool designed to boost your productivity.
Try its one-click report generation today at https://powerdrill.ai.
About the Dataset
The dataset titled "Cars_dataset_table_0.csv" comprises 8,128 entries with five key attributes: brand, km_driven, fuel, owner, and selling_price. The dataset provides insights into the automotive market, focusing on the diversity of car brands, their usage in terms of kilometers driven, fuel types, ownership history, and selling prices. The 'brand' column includes a variety of car manufacturers such as Ambassador, Ashok, Audi, BMW, and Chevrolet. The 'km_driven' column records the total kilometers each car has been driven, with values ranging from 1 to potentially much higher figures, indicating the car's usage level. The 'fuel' column categorizes cars based on their fuel type, including CNG, Diesel, LPG, and Petrol. Ownership history is captured in the 'owner' column, which includes categories like First Owner, Second Owner, and Test Drive Car, among others. Finally, the 'selling_price' column provides the car's market price, with examples ranging from 29,999 to 33,351.
From the sample data, we observe that Maruti is a common brand, with cars having varied usage from 5,000 to 175,000 km. The fuel types are diverse, with Diesel and Petrol being predominant. Most cars are either First or Second Owner, indicating a relatively new ownership history. The selling prices vary significantly, with a range from 45,000 to 500,000, reflecting differences in car condition, brand value, and market demand. This dataset is valuable for analyzing trends in car sales, understanding consumer preferences, and assessing the impact of usage and ownership on car pricing.
Average Kilometers Driven by Car Owners
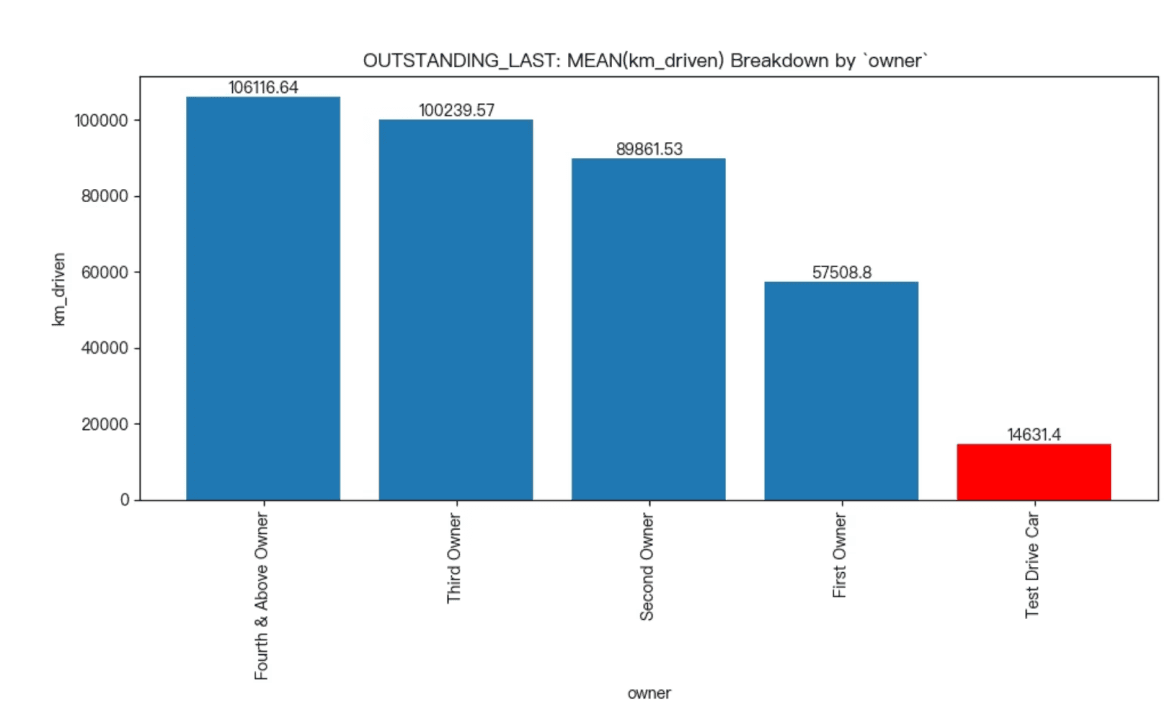
The visualization presents a breakdown of the average kilometers driven based on the ownership status of vehicles. The data indicates that vehicles owned by individuals classified as "Fourth & Above Owner" and "Third Owner" have significantly higher average kilometers driven, with values of 106,116.64 km and 100,239.57 km, respectively. This suggests that these vehicles are likely older and have been used more extensively over time.
In contrast, the "First Owner" category shows a lower average of 57,508.8 km, which may reflect less usage as these vehicles are often newer. The "Second Owner" category also demonstrates a moderate average of 89,861.53 km, indicating a balance between new and older vehicle usage. Notably, the "Test Drive Car" category has the lowest average at 14,631.4 km, likely due to its limited use for demonstration purposes. This analysis highlights the varying usage patterns of vehicles based on ownership, with implications for understanding vehicle longevity and usage trends.
Owner-Based Selling Price Analysis
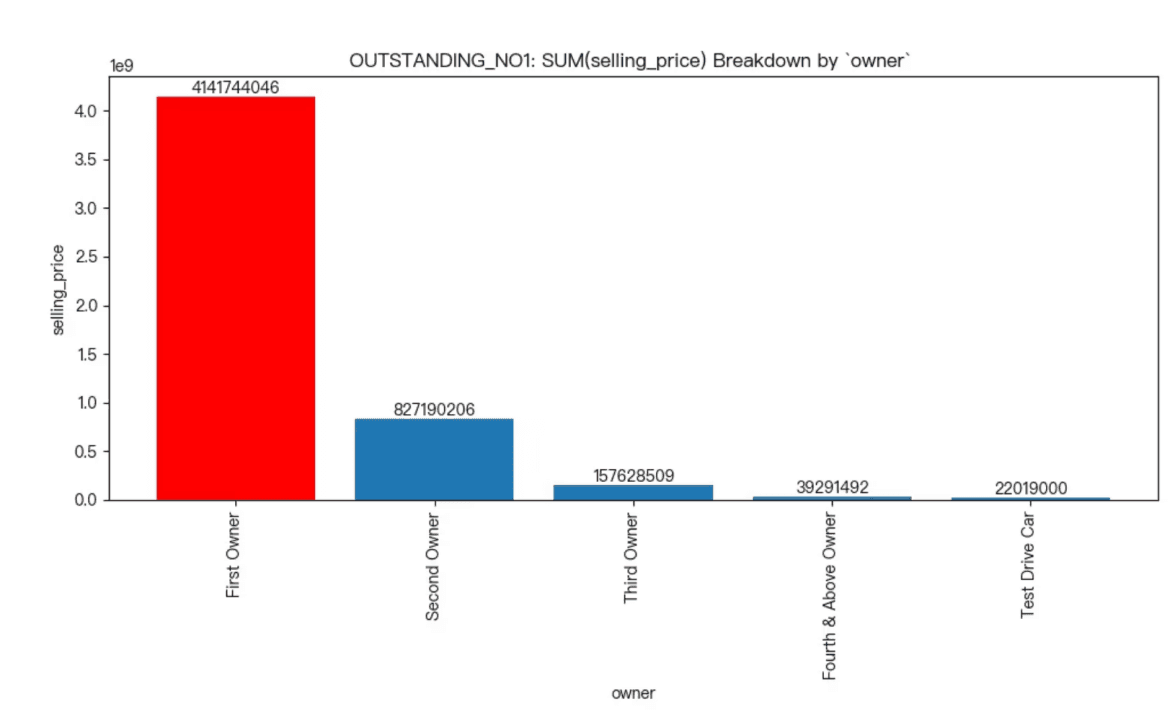
The analysis reveals a significant disparity in selling prices among different vehicle owners, with the "First Owner" category standing out prominently. The total selling price attributed to the first owner is approximately 4.1 billion, dwarfing the amounts associated with subsequent owners. This indicates a strong market preference or value retention for vehicles sold by their first owners.
In contrast, the other owner categories, including "Second Owner," "Third Owner," and "Fourth & Above Owner," show considerably lower selling prices, suggesting that vehicles tend to depreciate more significantly after the first sale. The data highlights the importance of ownership history in determining vehicle value, with first ownership being a critical factor for buyers in the market. This insight can guide potential sellers and buyers in making informed decisions regarding vehicle transactions.
Owner Attribution Analysis: Selling Price Distribution
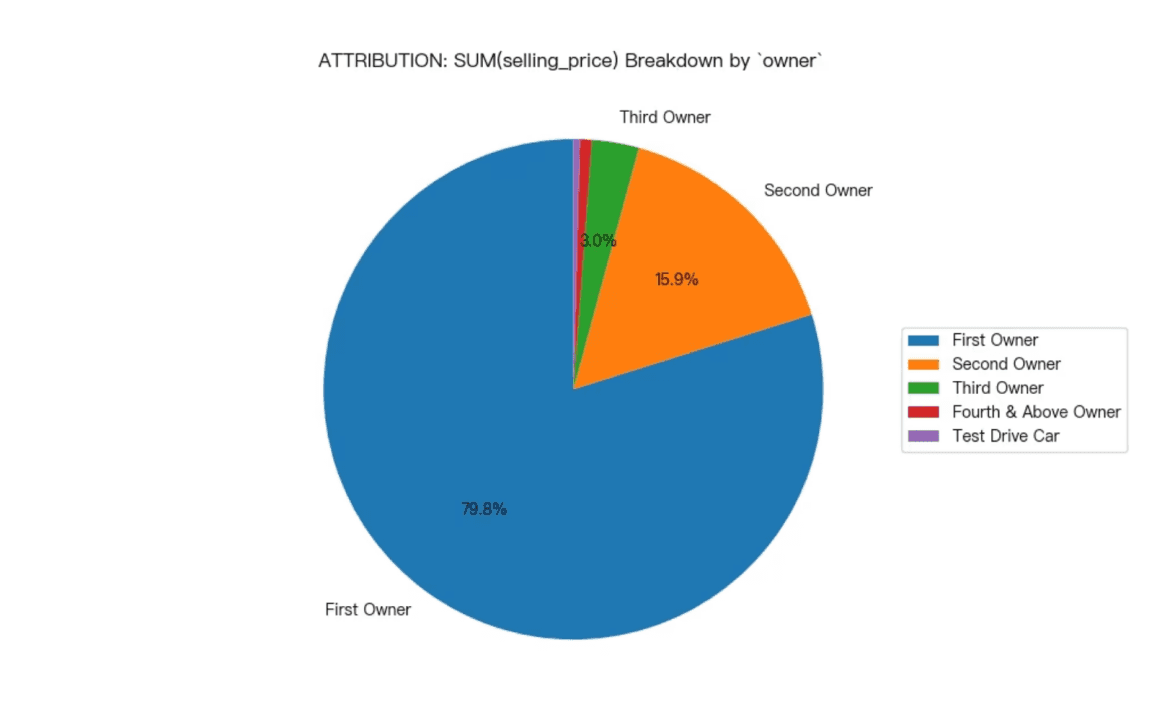
The visualization presents a clear breakdown of selling prices attributed to different vehicle owners, highlighting the dominance of the first owner. With a substantial 79.8% of the total selling price attributed to first owners, it is evident that vehicles sold by their initial owners command a significant market share. This suggests a strong preference among buyers for vehicles with a single previous owner, likely due to perceived reliability and maintenance history.
In contrast, the second owner category accounts for only 15.9% of the total selling price, while third owners and other categories contribute even less, with the third owner at 3.0%. This stark disparity indicates that as vehicles change hands, their selling prices tend to decrease, reflecting potential depreciation and buyer hesitance regarding vehicles with multiple previous owners. Overall, the data underscores the importance of ownership history in determining vehicle value in the market.
Top Brands by Selling Price: Maruti and Hyundai Lead
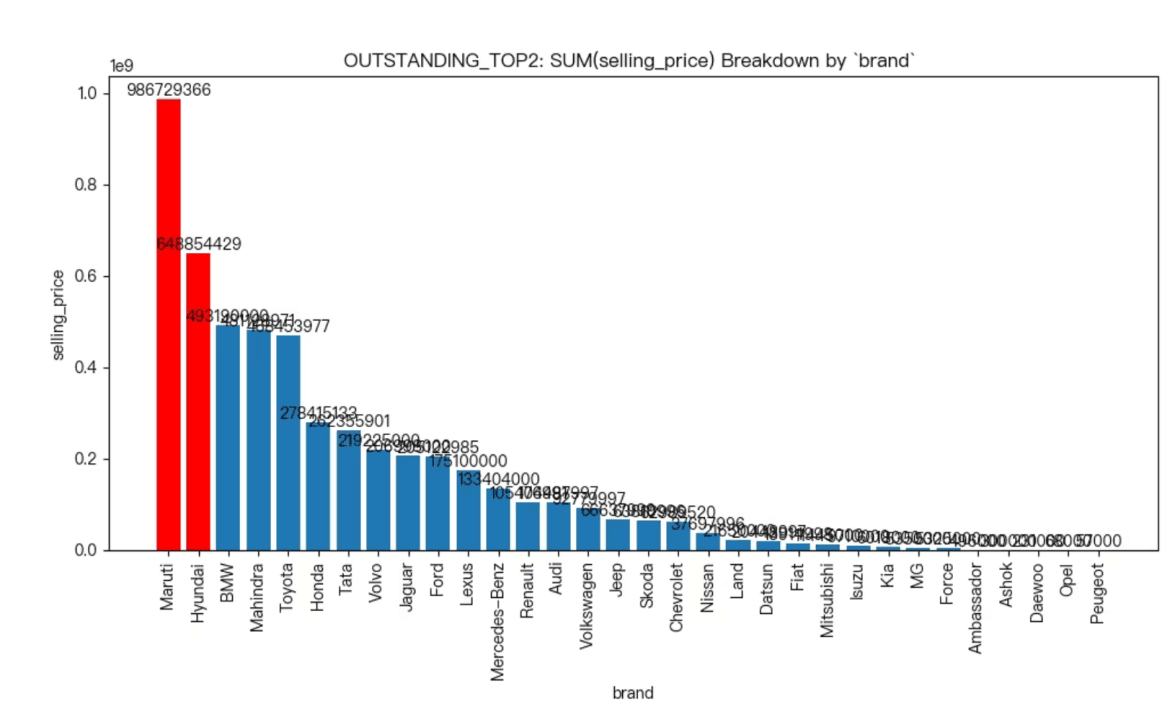
The analysis reveals that Maruti and Hyundai are the standout brands in terms of total selling price, significantly outperforming their competitors. Maruti leads with an impressive total of approximately 986.7 million, while Hyundai follows with around 648.8 million. This substantial gap indicates Maruti's dominant market position and consumer preference in the automotive sector.
The visualization highlights a clear hierarchy among the brands, with Maruti and Hyundai occupying the top two positions. Other brands, such as BMW and Mahindra, show notable figures but fall considerably short of the top two. This trend suggests that Maruti and Hyundai not only capture a larger market share but also resonate more effectively with consumers, potentially due to factors such as pricing, brand loyalty, and product offerings.
Correlation Between Selling Price and Kilometers Driven for Petrol Vehicles
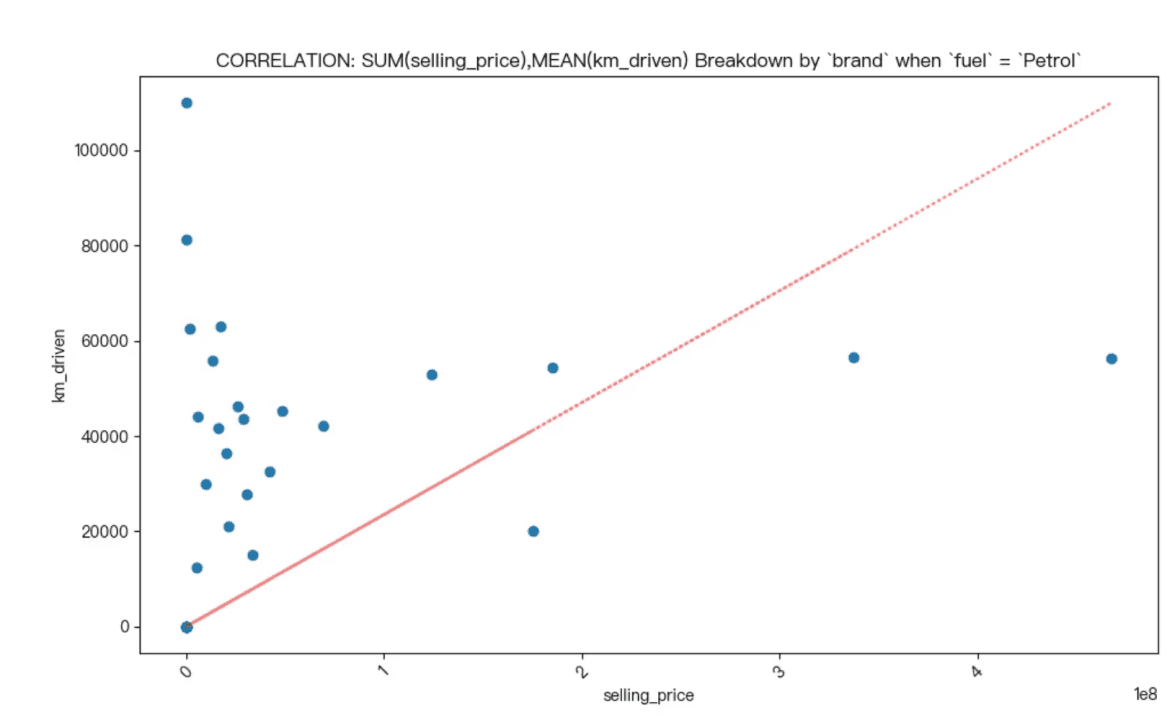
The analysis reveals a positive correlation between the selling price and the average kilometers driven for petrol vehicles, as indicated by a Pearson correlation coefficient of approximately 0.28. This suggests that, generally, as the selling price of petrol vehicles increases, the average kilometers driven also tends to rise, albeit the correlation is relatively weak.
The scatter plot visualization further illustrates this relationship, showing a trend where higher selling prices are associated with higher kilometers driven. However, the spread of data points indicates variability, suggesting that other factors may also influence selling prices and kilometers driven. This insight can be valuable for stakeholders in the automotive market, as it highlights the potential relationship between vehicle usage and pricing strategies.
How Does the Number of Kilometers Driven Affect the Selling Price of Cars?
Data Analysis
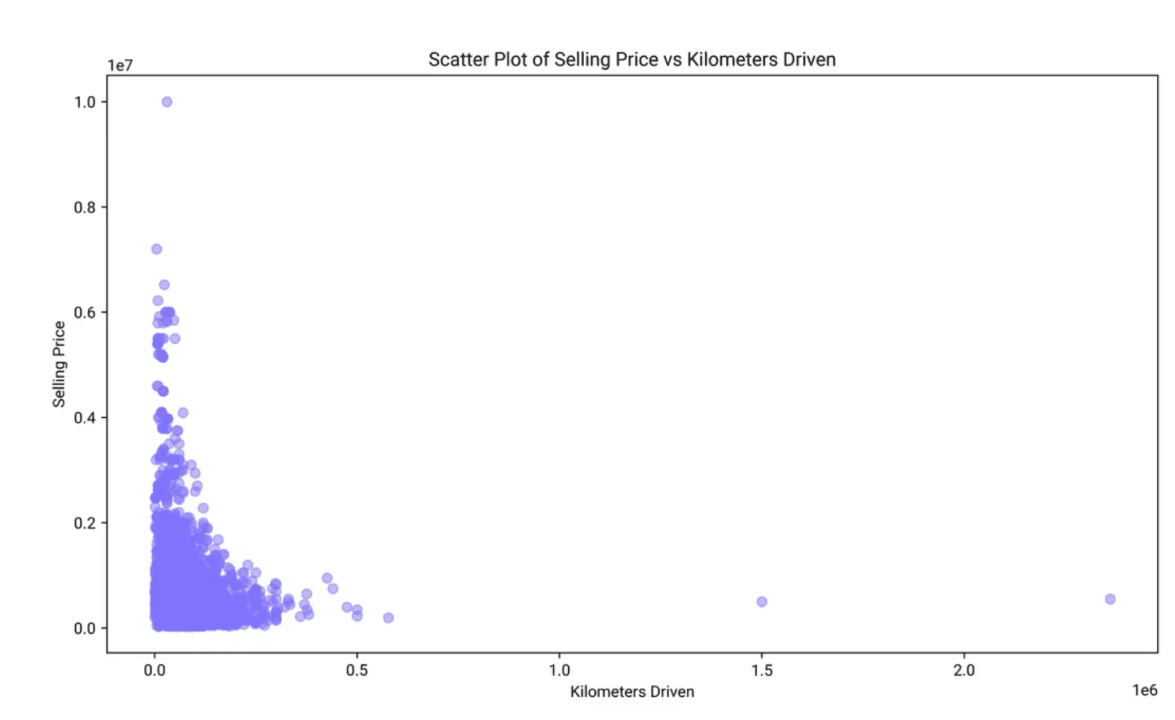
Average Kilometers Driven: The mean number of kilometers driven is approximately 69,819.51, with a wide range from 1 to 2,360,457 kilometers.
Average Selling Price: The mean selling price is about 638,271.81, with prices ranging from 29,999 to 10,000,000.
Visualization Insights
Scatter Plot Observation: The scatter plot shows a general trend where cars with fewer kilometers driven tend to have higher selling prices. As the number of kilometers increases, the selling price tends to decrease.
Density of Data Points: There is a high density of data points at lower kilometers driven and lower selling prices, indicating a common market segment.
Conclusion and Insights
Negative Correlation: There is a noticeable negative correlation between kilometers driven and selling price. Cars with higher mileage generally sell for less.
Market Implications: This trend suggests that buyers value lower mileage, likely due to perceived reliability and longevity, impacting the resale value of cars.
Distribution of Car Ownership Types
Frequency Analysis
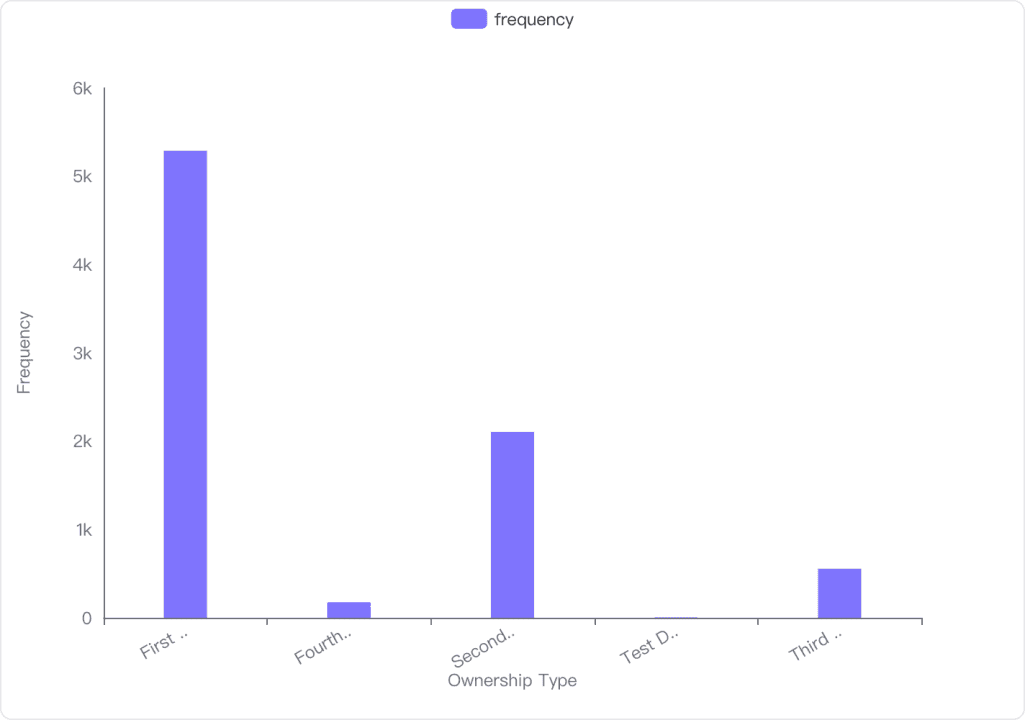
First Owner: The most common ownership type, with a frequency of 5,289.
Second Owner: The second most frequent, with 2,105 occurrences.
Third Owner: Appears 555 times in the dataset.
Fourth & Above Owner: Has a frequency of 174.
Test Drive Car: The least common, with only 5 instances.
Visualization Insights
Dominance of First Owners: The bar chart clearly shows that "First Owner" is the predominant category.
Low Frequency of Test Drive Cars: "Test Drive Car" has a negligible presence compared to other types.
Conclusion and Insights
First Ownership Prevalence: The dataset is heavily skewed towards first-time car owners.
Potential Market Insights: The low number of test drive cars suggests limited availability or demand in this category.
What Factors, Other Than Ownership History, Might Influence the Selling Price of Cars in This Dataset?
Influence of 'km_driven' on Selling Price
Mean km_driven: The average kilometers driven by cars in the dataset is approximately 69,819.51.
Median km_driven: The median kilometers driven is 60,000, indicating that half of the cars have been driven less than this distance.
Correlation with Selling Price: There is a negative correlation of -0.2255 between kilometers driven and selling price, suggesting that as the kilometers driven increases, the selling price tends to decrease.
Influence of 'fuel' on Selling Price
CNG: Cars using CNG have an average selling price of 301,017.49.
Diesel: Diesel cars have the highest average selling price at 791,452.92.
LPG: LPG cars have the lowest average selling price at 200,421.05.
Petrol: Petrol cars have an average selling price of 462,441.06.
Significant Differences: There are significant differences in average selling prices across different fuel types, with diesel cars being the most expensive on average.
Influence of 'brand' on Selling Price
Brand Variability: There is a wide range of average selling prices across different brands, from as low as 57,000 to as high as 5,150,000.
High-End Brands: Brands like Audi and BMW have significantly higher average selling prices, with BMW averaging over 4 million.
Economical Brands: Brands like Ambassador and Chevrolet have lower average selling prices, indicating a significant influence of brand reputation and market positioning on selling price.
Conclusion and Insights
Kilometers Driven: The negative correlation indicates that cars with higher mileage tend to have lower selling prices, which is a common trend in the automotive market.
Fuel Type: The type of fuel significantly influences the selling price, with diesel cars being valued higher, possibly due to their fuel efficiency and performance.
Brand Influence: The brand of the car is a major determinant of its selling price, with luxury brands commanding higher prices. This suggests that brand reputation and perceived quality play crucial roles in pricing.
Correlation Between the Number of Kilometers Driven and the Selling Price for Each Car Brand
Correlation Data Overview
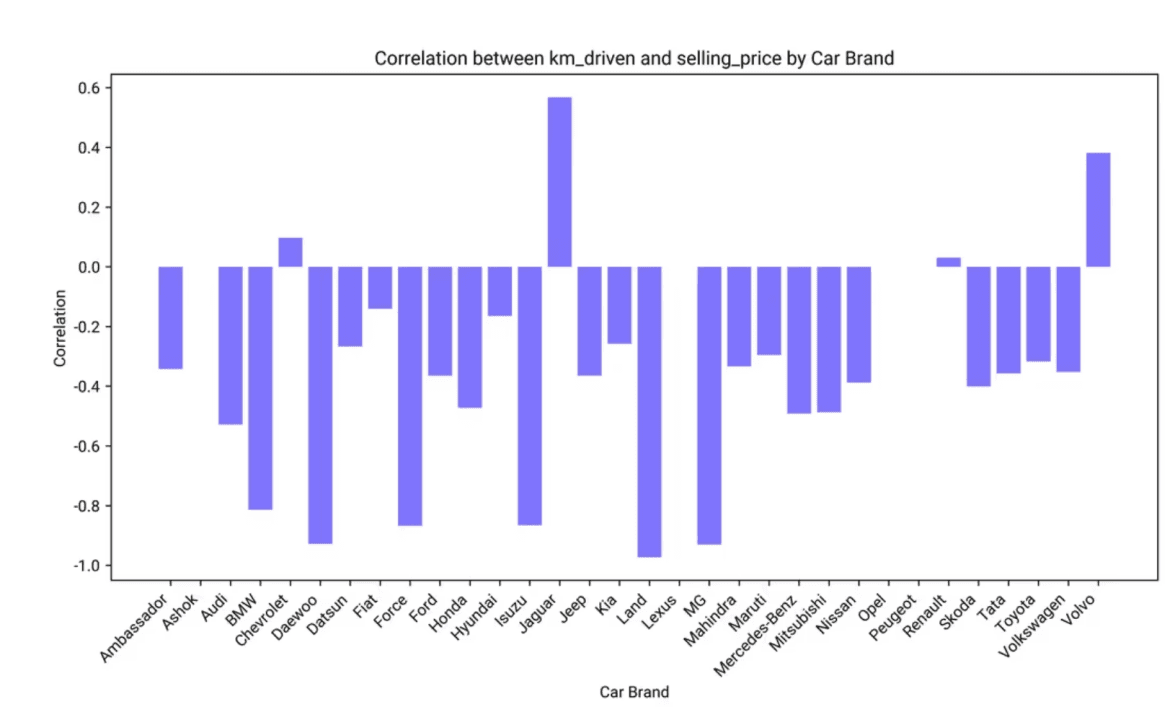
Mean Correlation: The average correlation across brands is -0.38, indicating a general negative relationship between kilometers driven and selling price.
Correlation Range: The correlations range from -0.97 to 0.57, showing significant variability among brands.
Sample Brands: Examples include Ambassador (-0.34), Audi (-0.53), BMW (-0.81), and Chevrolet (0.10).
Visual Representation of Correlations
Negative Correlations: Many brands, such as BMW and Audi, show strong negative correlations, suggesting that higher kilometers driven typically result in lower selling prices.
Positive Correlations: Some brands, like Chevrolet and Volvo, exhibit positive correlations, indicating that kilometers driven might not significantly impact the selling price or could even increase it in certain contexts.
Variability: The scatter plot highlights the diverse nature of these relationships across different brands, with some brands showing almost no correlation.
Conclusion and Insights
General Trend: Most car brands exhibit a negative correlation between kilometers driven and selling price, meaning that as cars are driven more, their selling price tends to decrease.
Brand-Specific Variations: The strength and direction of this relationship vary significantly across brands, suggesting that factors such as brand reputation, car model durability, and market demand might influence these correlations.


