Ethereum Price Prediction in November 2025: AI-Powered Insights on ETF Flows, Liquidity, and Roadmap Catalysts from Powerdrill Bloom
Joy

Introduction
Ethereum’s market is entering one of its most pivotal phases — where institutional inflows, on-chain fundamentals, and regulatory milestones converge to shape its price outlook for 2026. To uncover what’s really driving this new cycle, I ran a comprehensive 20-day analysis using Powerdrill Bloom, an AI-driven data exploration engine that transforms complex datasets into actionable market insights.
From ETF flow surges and macro liquidity tailwinds to staking dynamics and upcoming roadmap milestones, Powerdrill Bloom’s analysis highlights the key signals that could define Ethereum’s next major move. The data reveals how institutional capital is rapidly accumulating ETH through ETFs, how liquidity migration toward decentralized exchanges reshapes price discovery, and how upcoming upgrades like Fusaka could unlock the next wave of scalability-driven growth.
In this article, we’ll break down the findings from Powerdrill Bloom’s AI analysis — exploring the metrics, market structure, and catalysts that could push Ethereum toward new highs by 2026.
To view the orginal prediction report and sample PPT, please visit: https://bloom.powerdrill.ai/share/oIhLnvDQ.
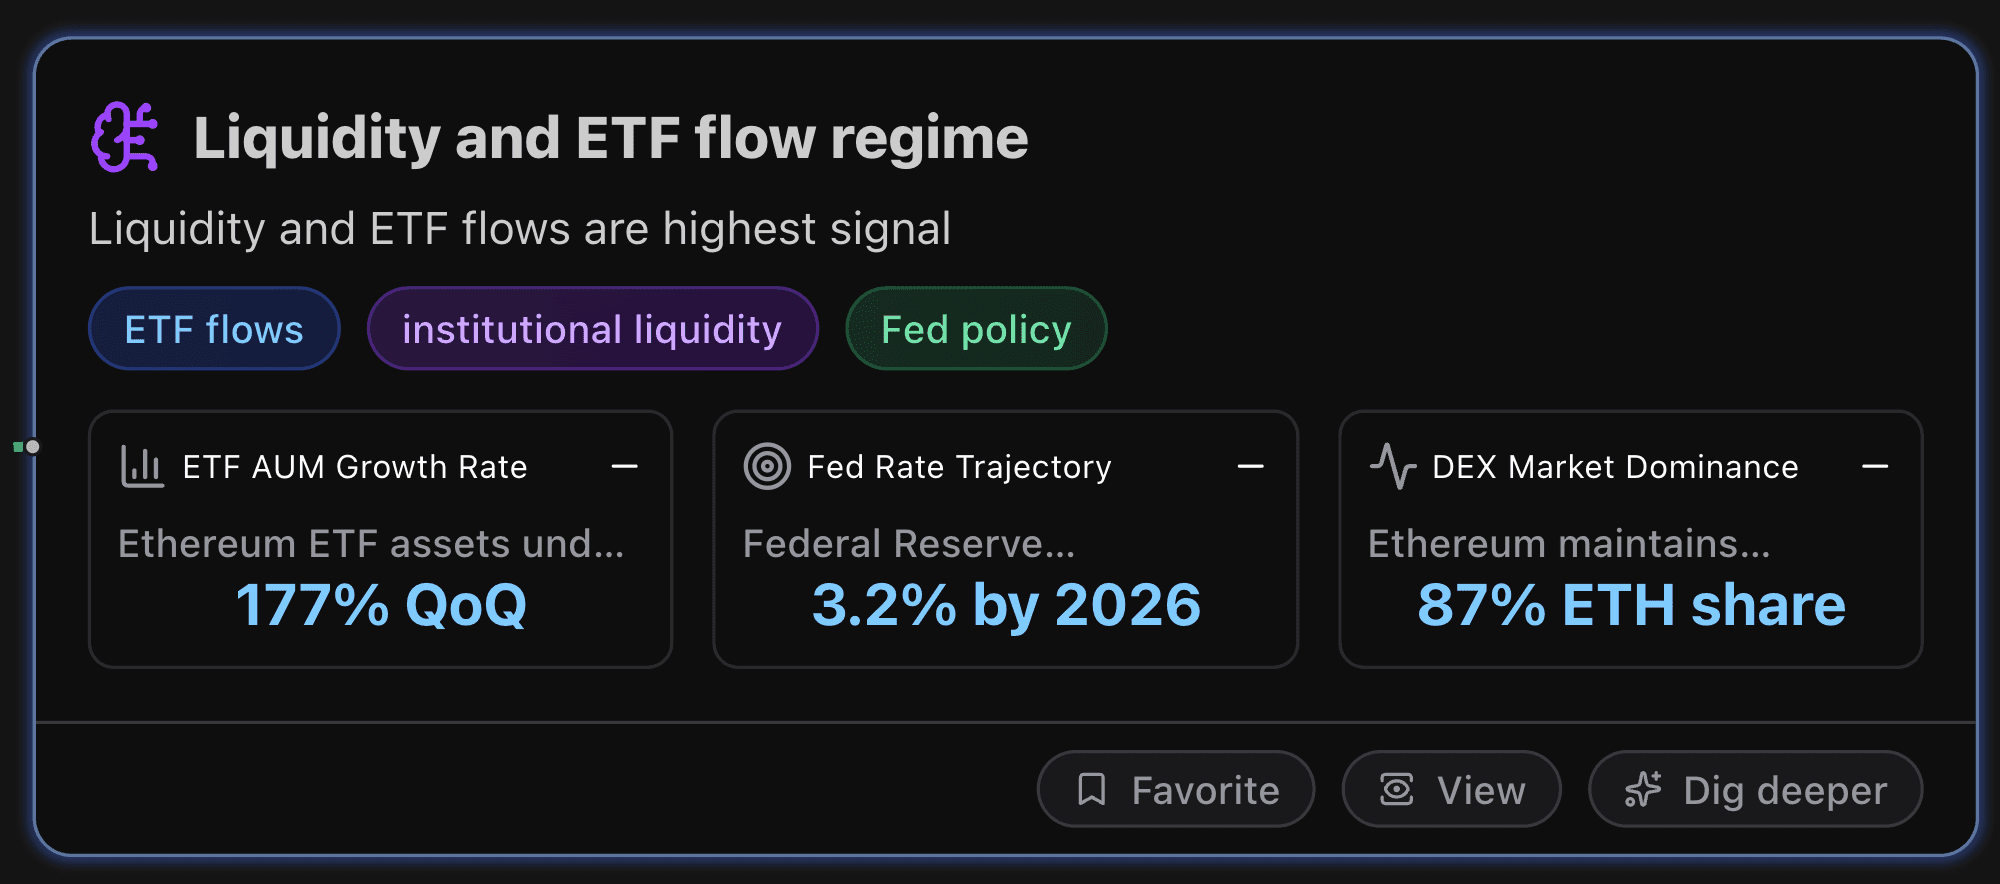
Liquidity and ETF Flow Regime
This section liquidity and ETF flows are highest signal.
Key Metrics
ETF AUM Growth Rate
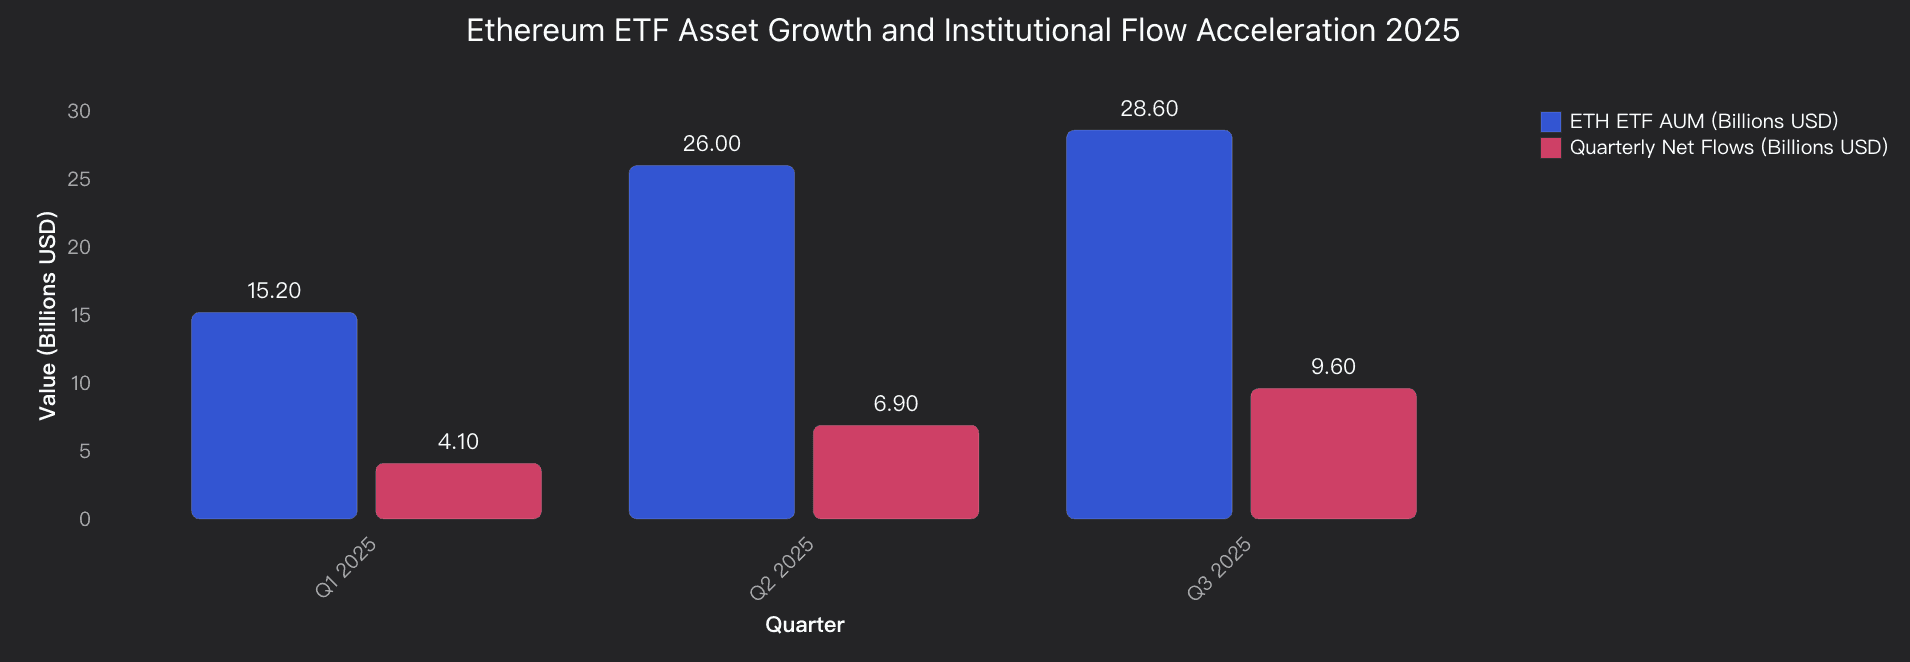
Ethereum ETF assets under management surged from $10.3B in July to $28.6B by end of Q3 2025, representing unprecedented quarterly growth that significantly outpaces traditional asset management industry benchmarks of 5-15% annually. This acceleration demonstrates institutional confidence shift from experimental allocation to strategic positioning in digital assets infrastructure.
Fed Rate Trajectory
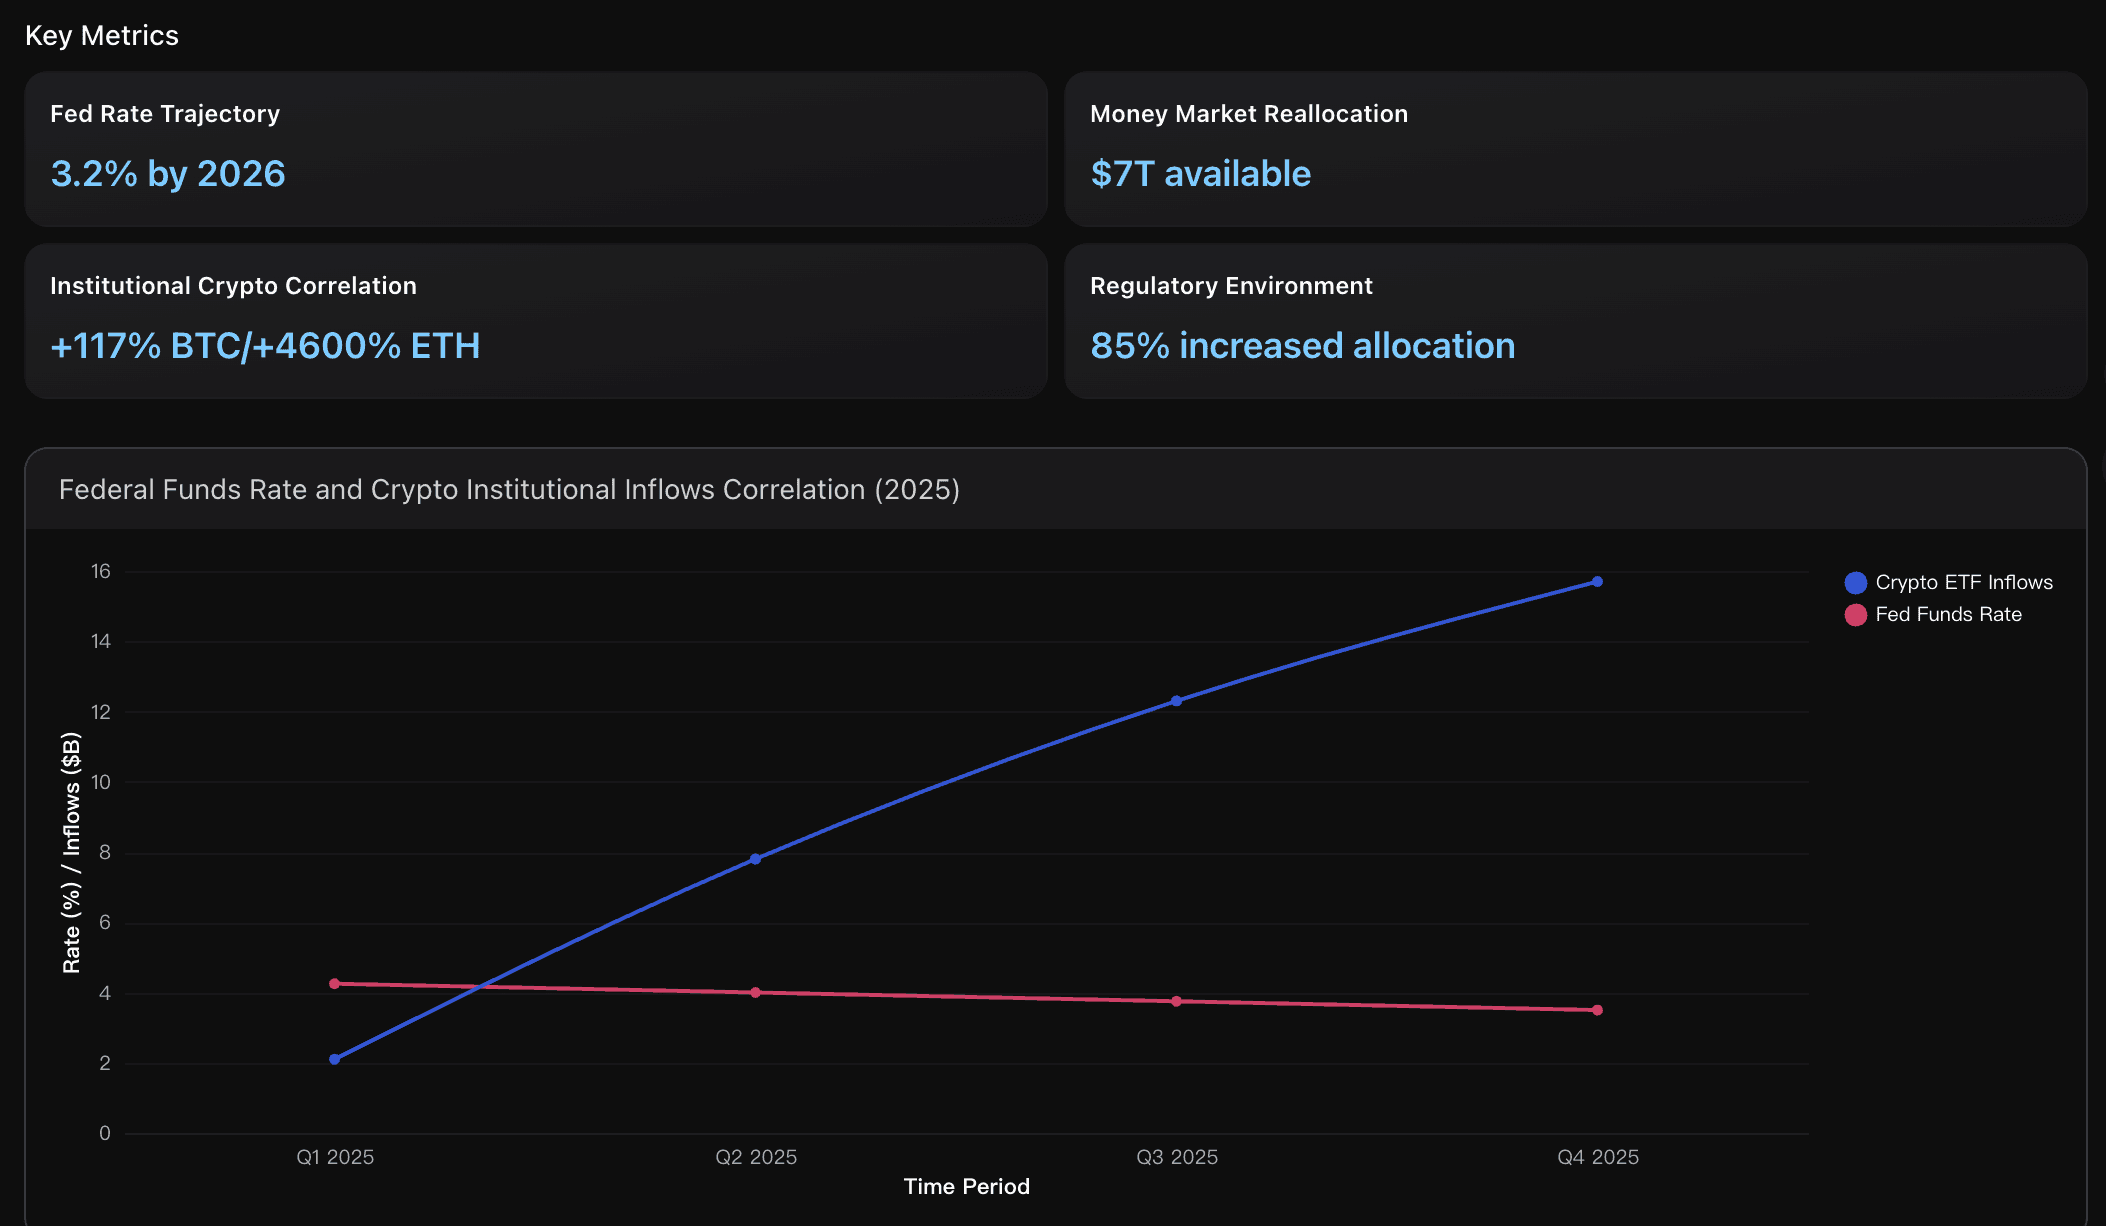
Federal Reserve implementing dovish policy with 100 basis points of cuts projected through 2026, bringing funds rate from current 4.25% to terminal 3.2%. This creates favorable liquidity conditions as 84% of analysts expect December cuts, with additional reductions in early 2026, maintaining accommodative monetary stance that historically supports risk asset performance including cryptocurrency allocations.
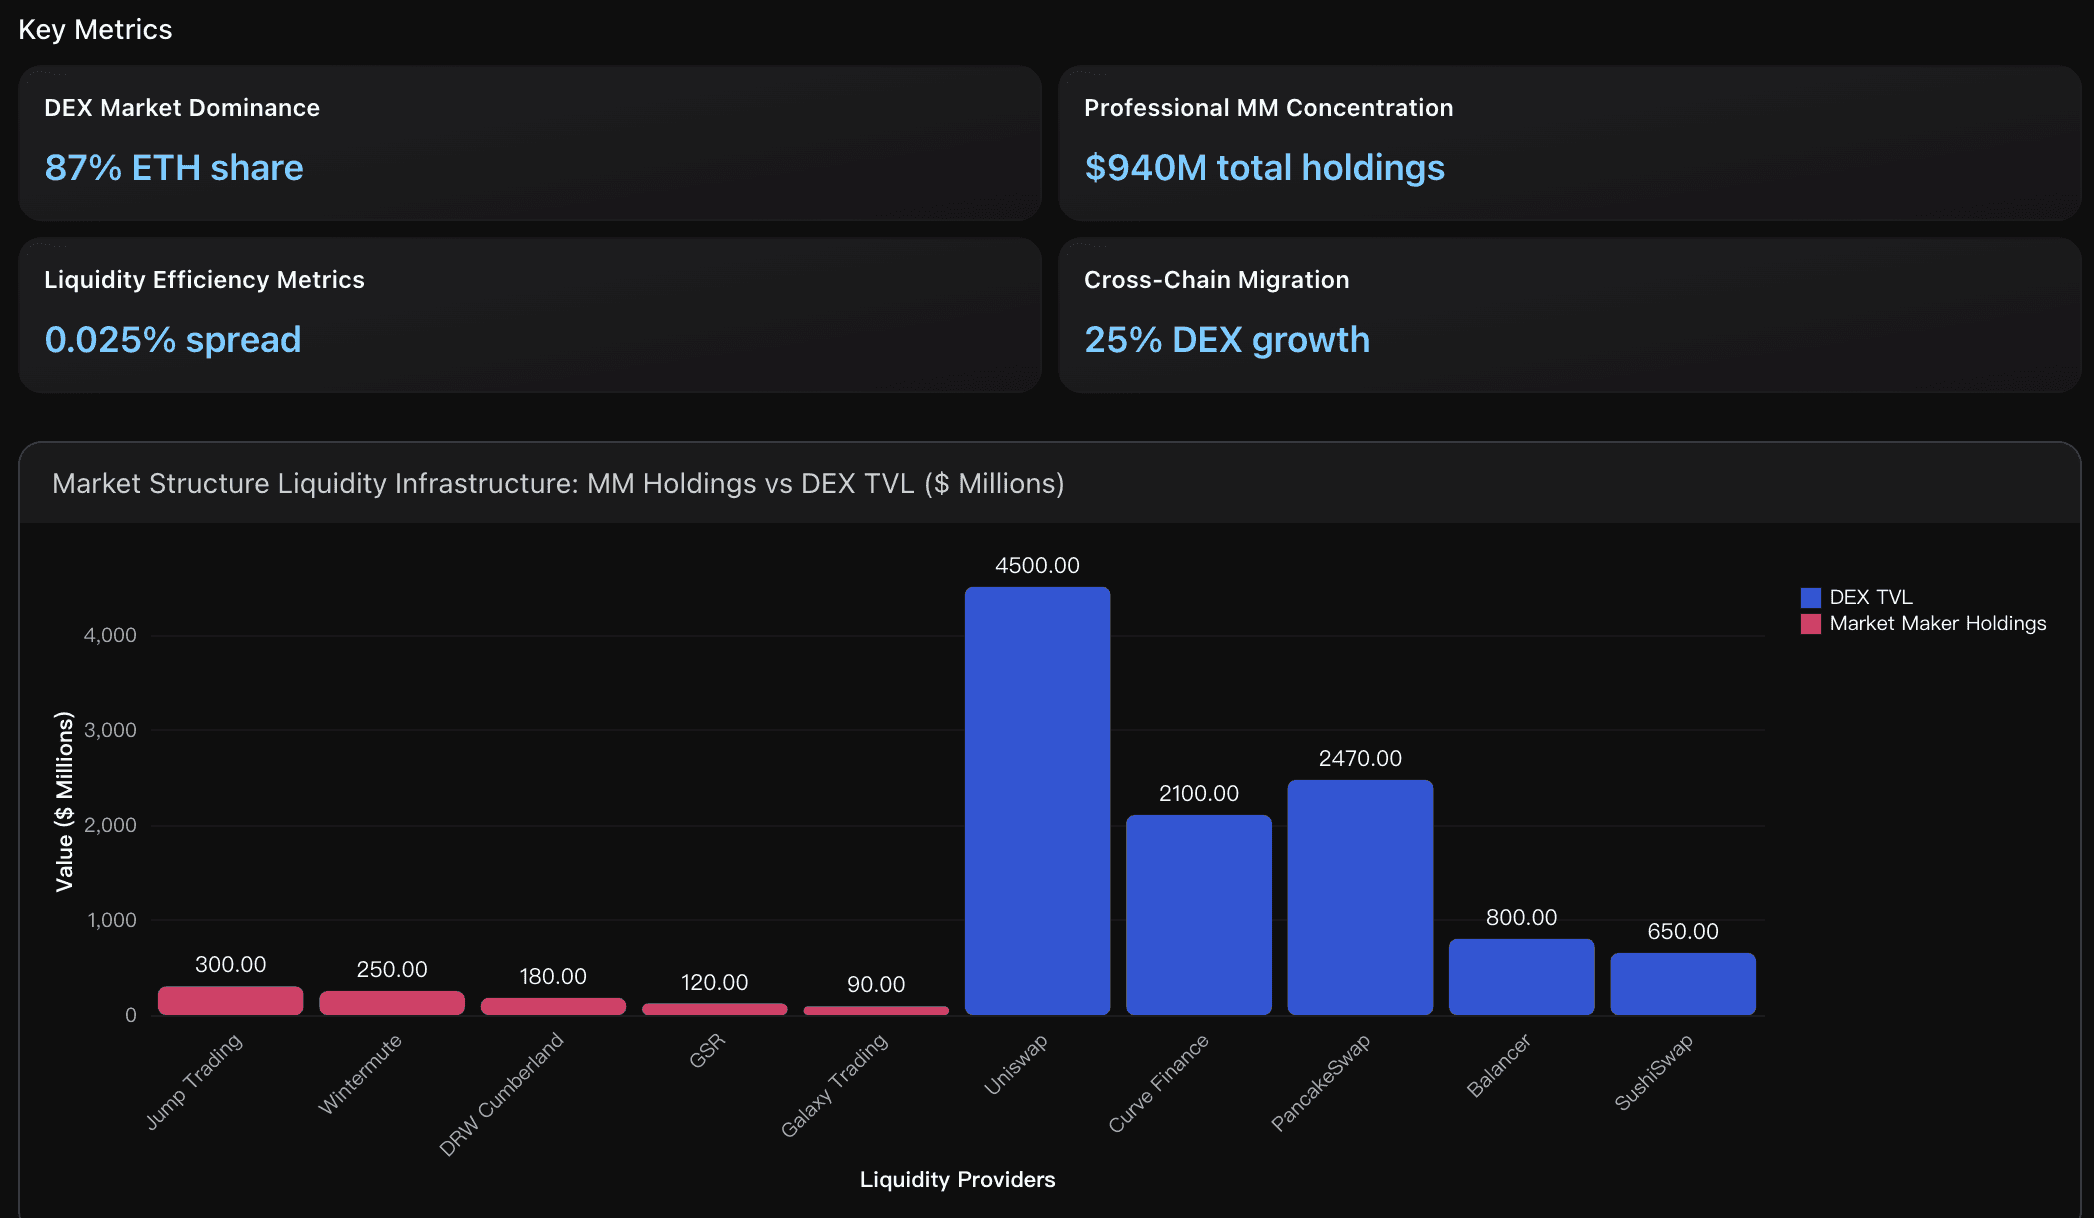
DEX Market Dominance
Ethereum maintains commanding 87% market share in decentralized trading volume with $1T quarterly DEX volume in Q2 2025, significantly outpacing competitors like Solana (institutional adoption) and BNB Chain (retail focus), demonstrating network effects and liquidity gravity that create self-reinforcing dominance in DeFi infrastructure.
Actionable Insights
Prioritize Ethereum exposure expansion through structured products to capitalize on institutional momentum. The 177% quarterly AUM growth and 1.7x flow advantage over Bitcoin ETFs signal a structural shift in institutional crypto allocation. Target allocation windows during flow consistency periods like the recent 14-day positive inflow streak when institutional demand provides price support. Monitor investment advisor sentiment closely as they control 67% of institutional ETF holdings and their continued 541K ETH accumulation patterns will likely drive price appreciation through 2026. Consider dollar-cost averaging during temporary flow reversals as institutional conviction appears sustainable based on Ethereum's unique yield-generating capabilities versus Bitcoin's pure store-of-value proposition.
Position for the macro liquidity tailwind by monitoring the Federal Reserve's dovish trajectory toward 3.2% terminal rate by 2026, which creates optimal conditions for institutional crypto adoption. As rate cuts reduce opportunity costs for non-yielding assets, expect accelerated rotation from the $7 trillion money market fund pool into ETH and other crypto assets. Focus on ETH's dual income potential through staking rewards (4-6% annual yield) which becomes increasingly attractive as traditional fixed-income yields decline. Track quarterly institutional allocation trends, as 85% of institutions have increased crypto exposure with 59% planning over 5% AUM allocation in 2025, indicating sustained demand drivers beyond short-term price movements.
Focus investment timing around the structural liquidity migration happening in 2025. The 25% growth in DEX volume while centralized exchanges declined 28% signals a permanent shift in market structure favoring Ethereum's on-chain liquidity infrastructure. With professional market makers maintaining only 2.3% concentration across $940M holdings yet providing deep liquidity across 50+ venues, and ETH maintaining ultra-tight 0.025% bid-ask spreads, the current market structure supports higher price discovery efficiency during institutional accumulation phases. Monitor DEX/CEX volume ratios as leading indicators - when this ratio reaches new highs, it typically precedes ETH price breakouts as institutional capital flows follow liquidity depth rather than driving it.
Analysis Overview
Ethereum's liquidity and ETF flow regime presents compelling bullish signals for 2026 price targets. Key institutional momentum: Q3 2025 ETF inflows of $9.6B outpaced Bitcoin ETFs for the first time, with total AUM growing 177% to $28.6B. Professional investors increased ETH exposure 63% in ETH terms and 116% in USD terms, led by investment advisors holding 541K ETH and hedge funds doubling positions to 296K ETH. Macro liquidity tailwinds: Federal Reserve's dovish pivot from $6.6T balance sheet reduction creates favorable conditions, with rates projected at 3.25-3.50% by Q1 2026. This liquidity expansion historically supports risk assets including crypto. Market structure strength: DEX ecosystem achieved $1T quarterly volume with Ethereum maintaining 87% dominance, while daily DEX volumes average $4.93B across 800+ platforms. However, temporary outflow episodes like August 2025's $422M single-day ETF redemptions highlight flow volatility risks. Standard Chartered raised ETH targets to $25,000 by 2028, while Citi projects $5,440 within 12 months, reflecting institutional confidence in the liquidity-driven rally continuing into 2026.
Data Analysis
Institutional ETF Flow Momentum
Analysis of Ethereum ETF institutional adoption patterns showing Q3 2025 net inflows of $9.6B outpacing Bitcoin ETFs, with total AUM reaching $28.6B representing 177% quarterly growth, driven by investment advisors (541K ETH) and hedge funds (296K ETH) expanding positions significantly.

Macro Liquidity Environment
Federal Reserve policy shift from quantitative tightening to dovish stance creates favorable liquidity conditions for crypto, with Fed balance sheet at $6.6T and rates projected at 3.25-3.50% by Q1 2026, supporting risk asset performance including ETH as traditional financial institutions increase exposure.
Market Structure Liquidity Depth
DEX ecosystem reaches $1T quarterly trading volume in Q2 2025 with Ethereum maintaining 87% market dominance, while professional market makers provide substantial liquidity infrastructure across both CEX and DEX platforms, with daily DEX volumes averaging $4.93B across 800+ platforms.
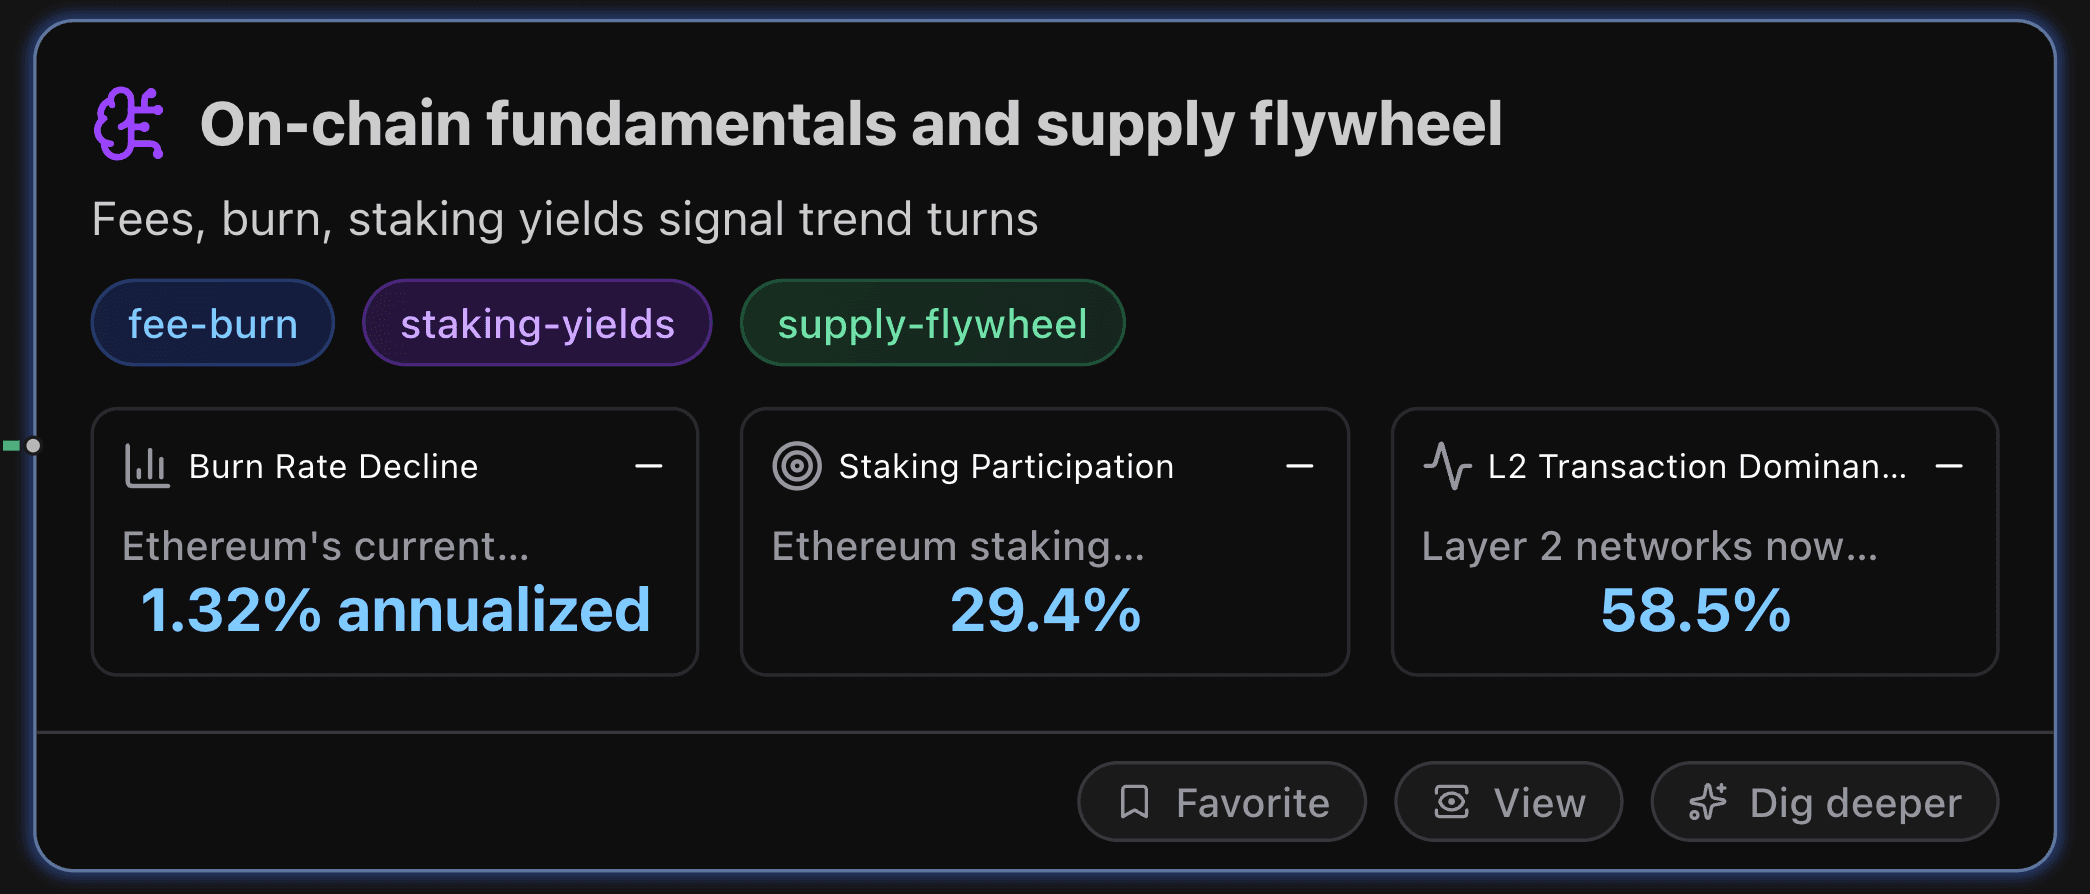
On-chain fundamentals and supply flywheel
Fees, burn, staking yields signal trend turns.
Key Metrics
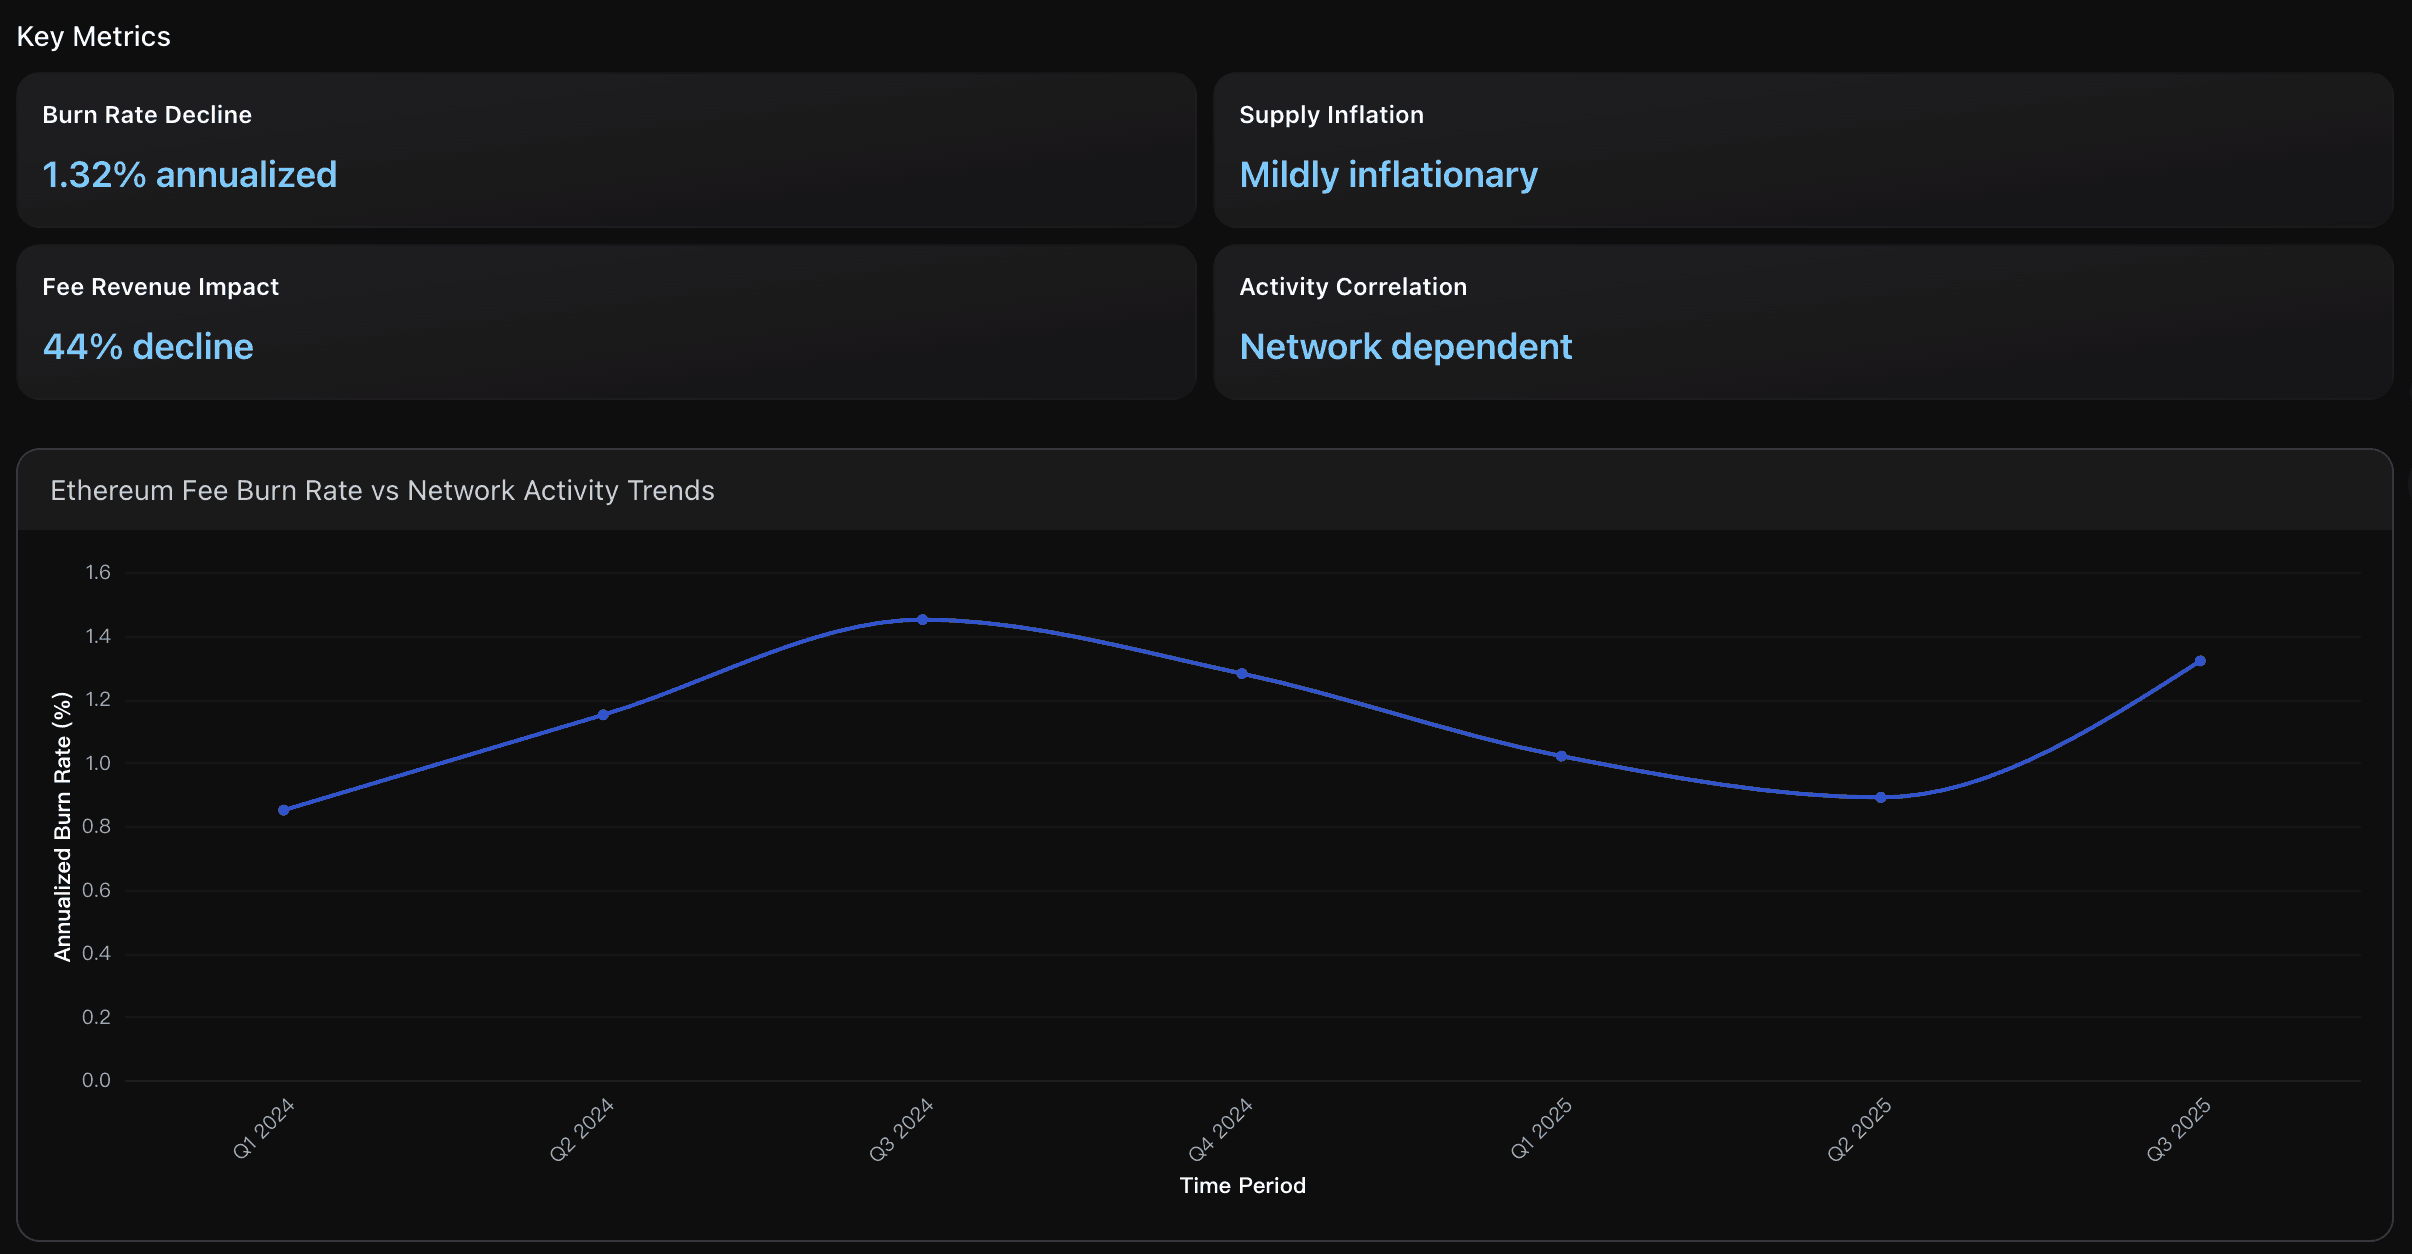
Burn Rate Decline
Ethereum's current annualized burn rate of 1.32% in Q3 2025 represents a significant decline from peak periods during DeFi and NFT booms when rates reached 3 ETH/minute. Despite burning over 4.1 million ETH ($12+ billion) since EIP-1559's 2021 implementation, the mechanism's effectiveness has diminished due to Layer 2 adoption reducing mainnet transaction volume by 58.5%, creating structural headwinds for deflationary pressure sustainability.
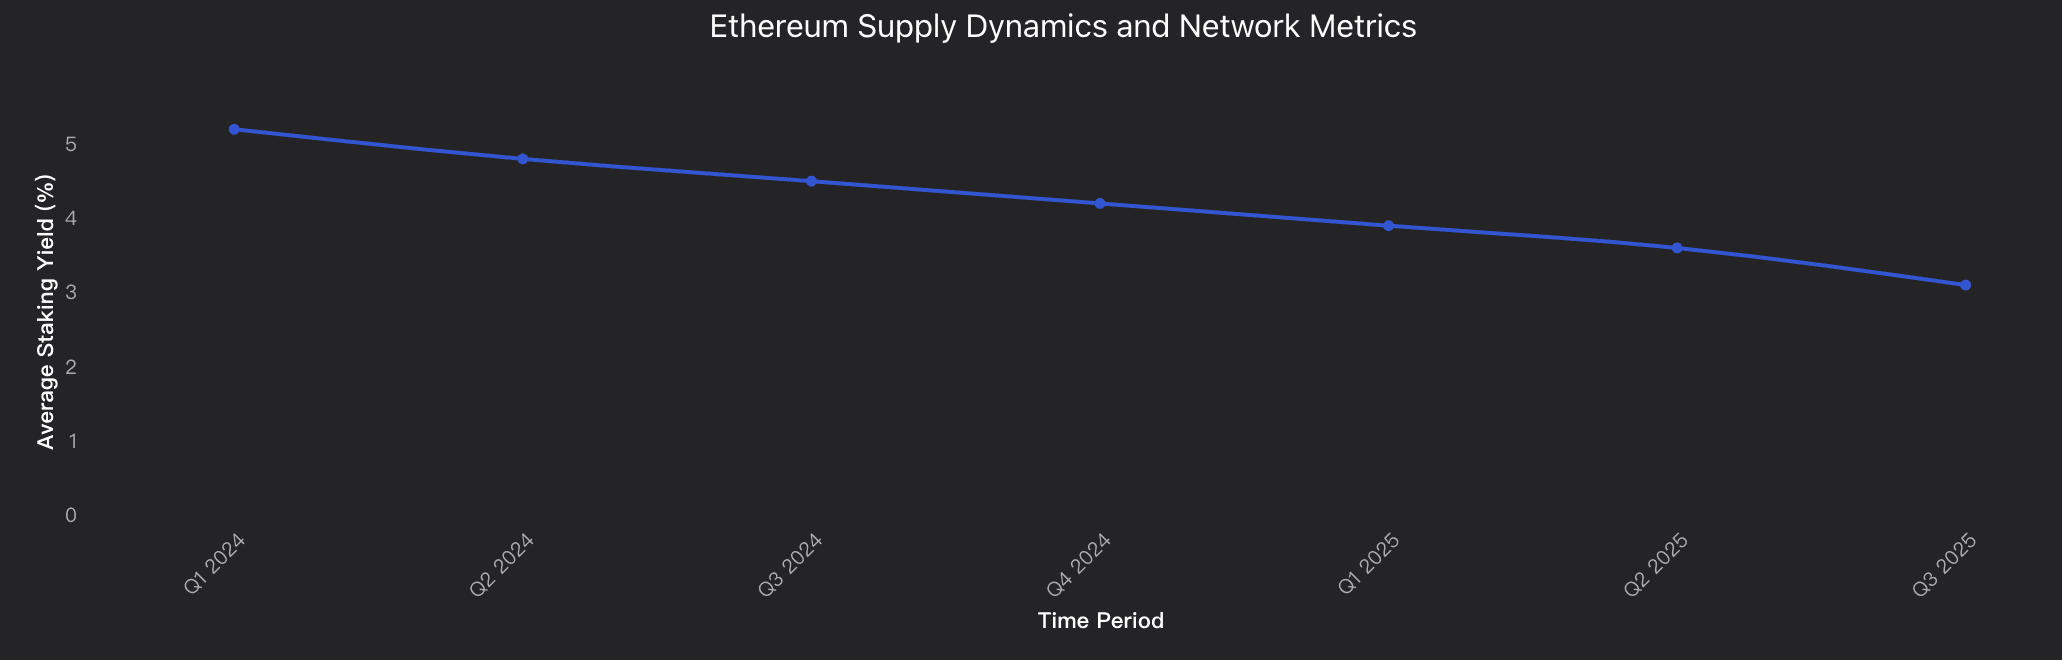
Staking Participation
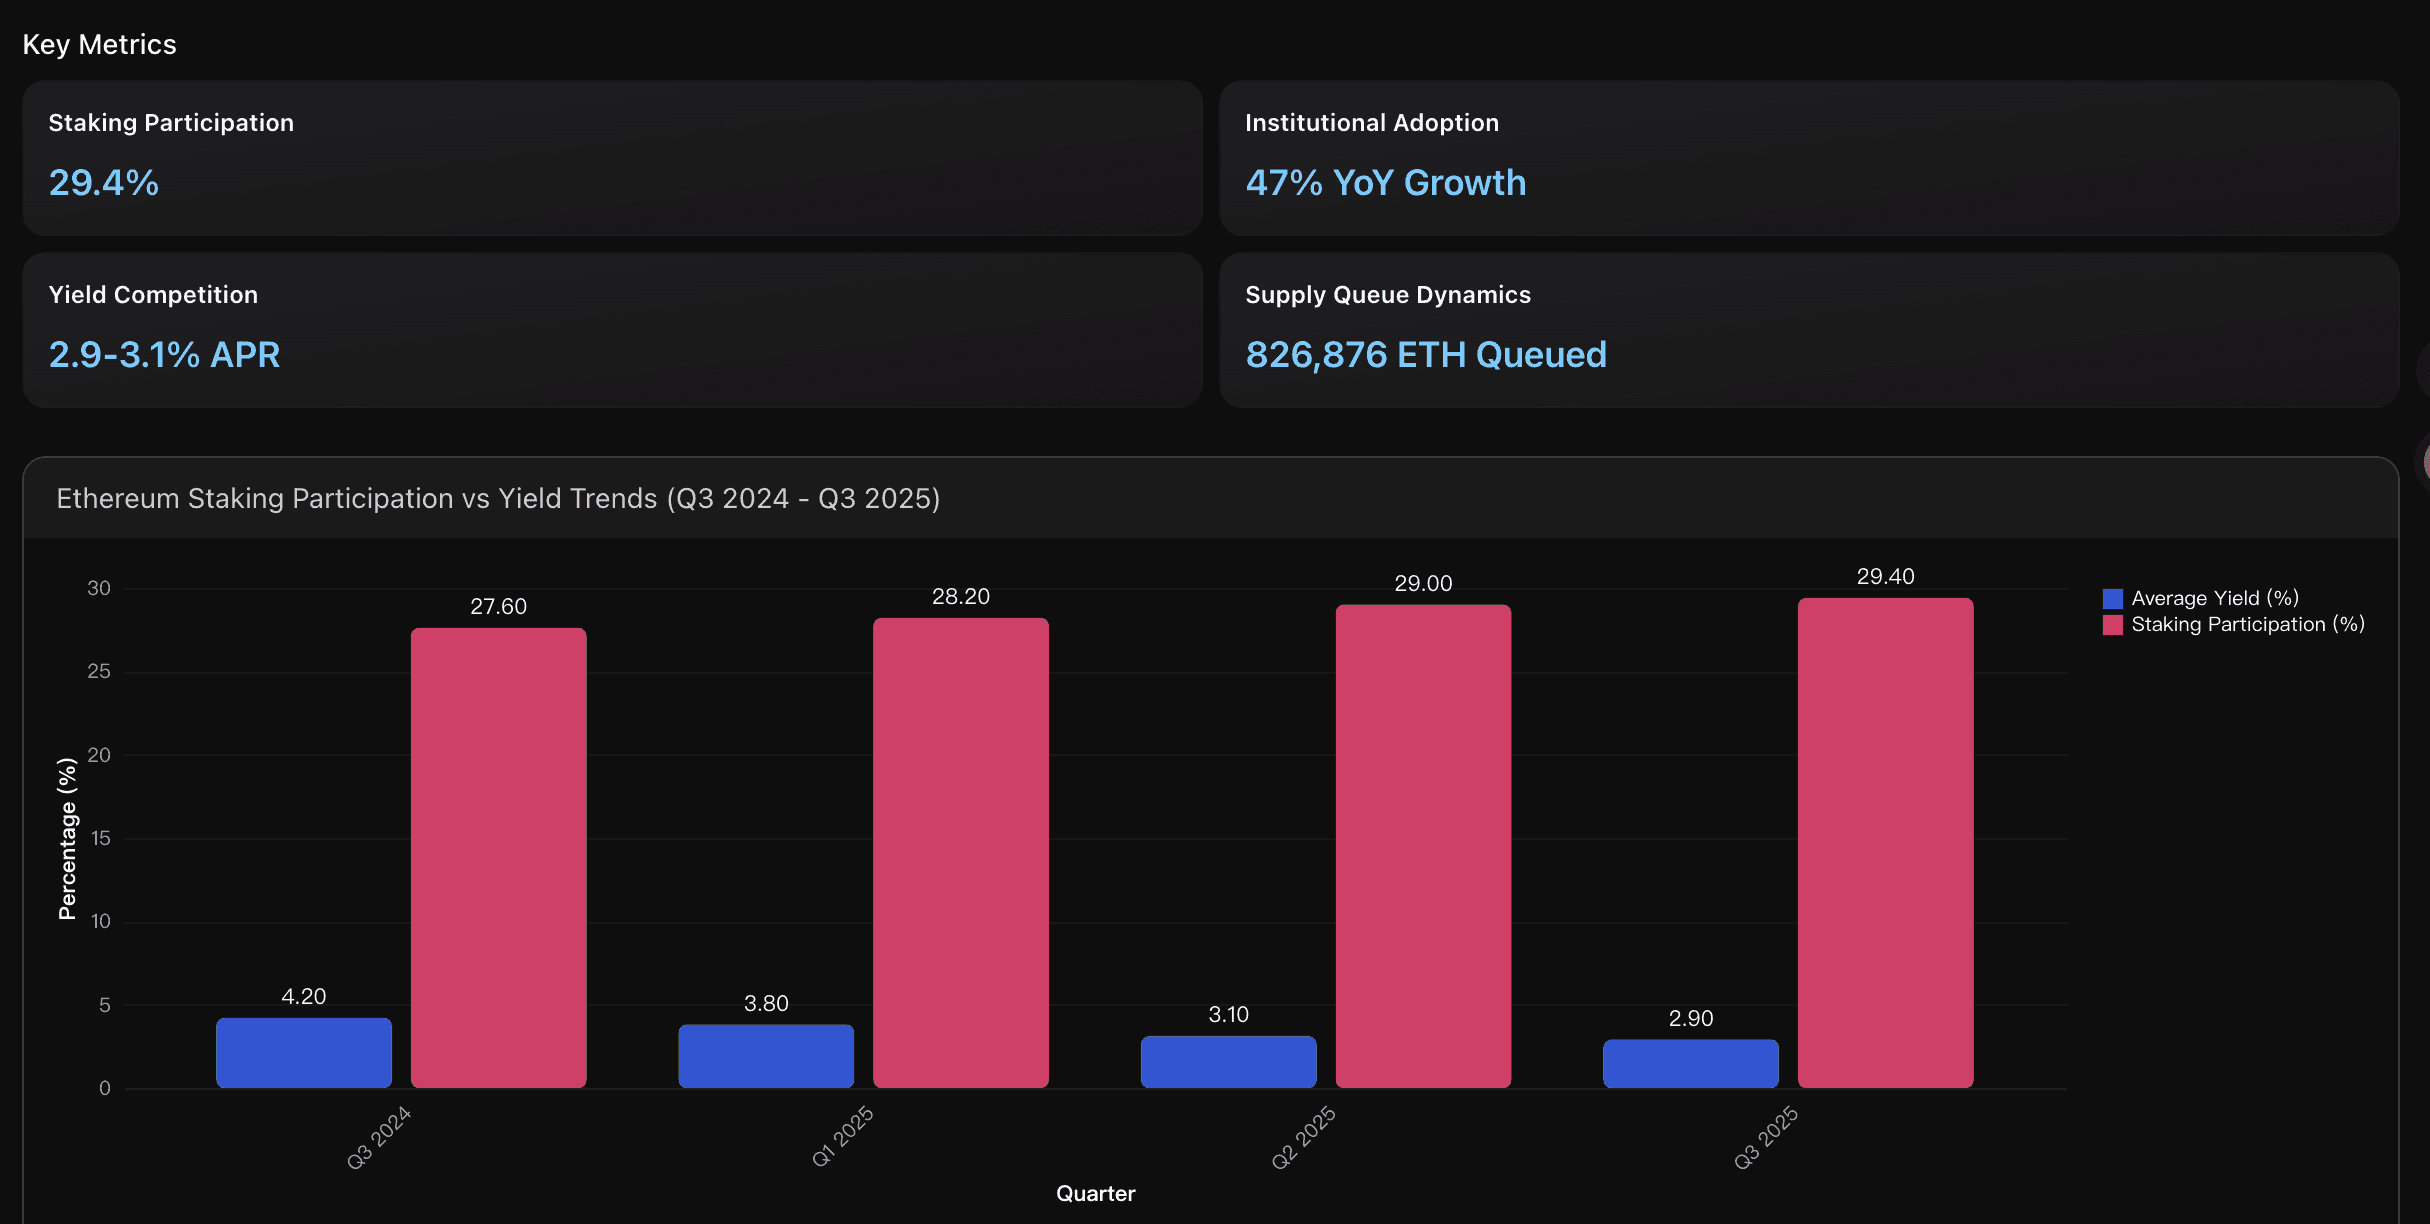
Ethereum staking participation reached 29.4% of total supply by Q3 2025, representing 35.6 million ETH locked in 1.07 million validators. This marks steady growth from 27.6% in Q3 2024, creating substantial supply constraints. The high 99.9% validator participation rate demonstrates network reliability and institutional confidence in staking infrastructure.
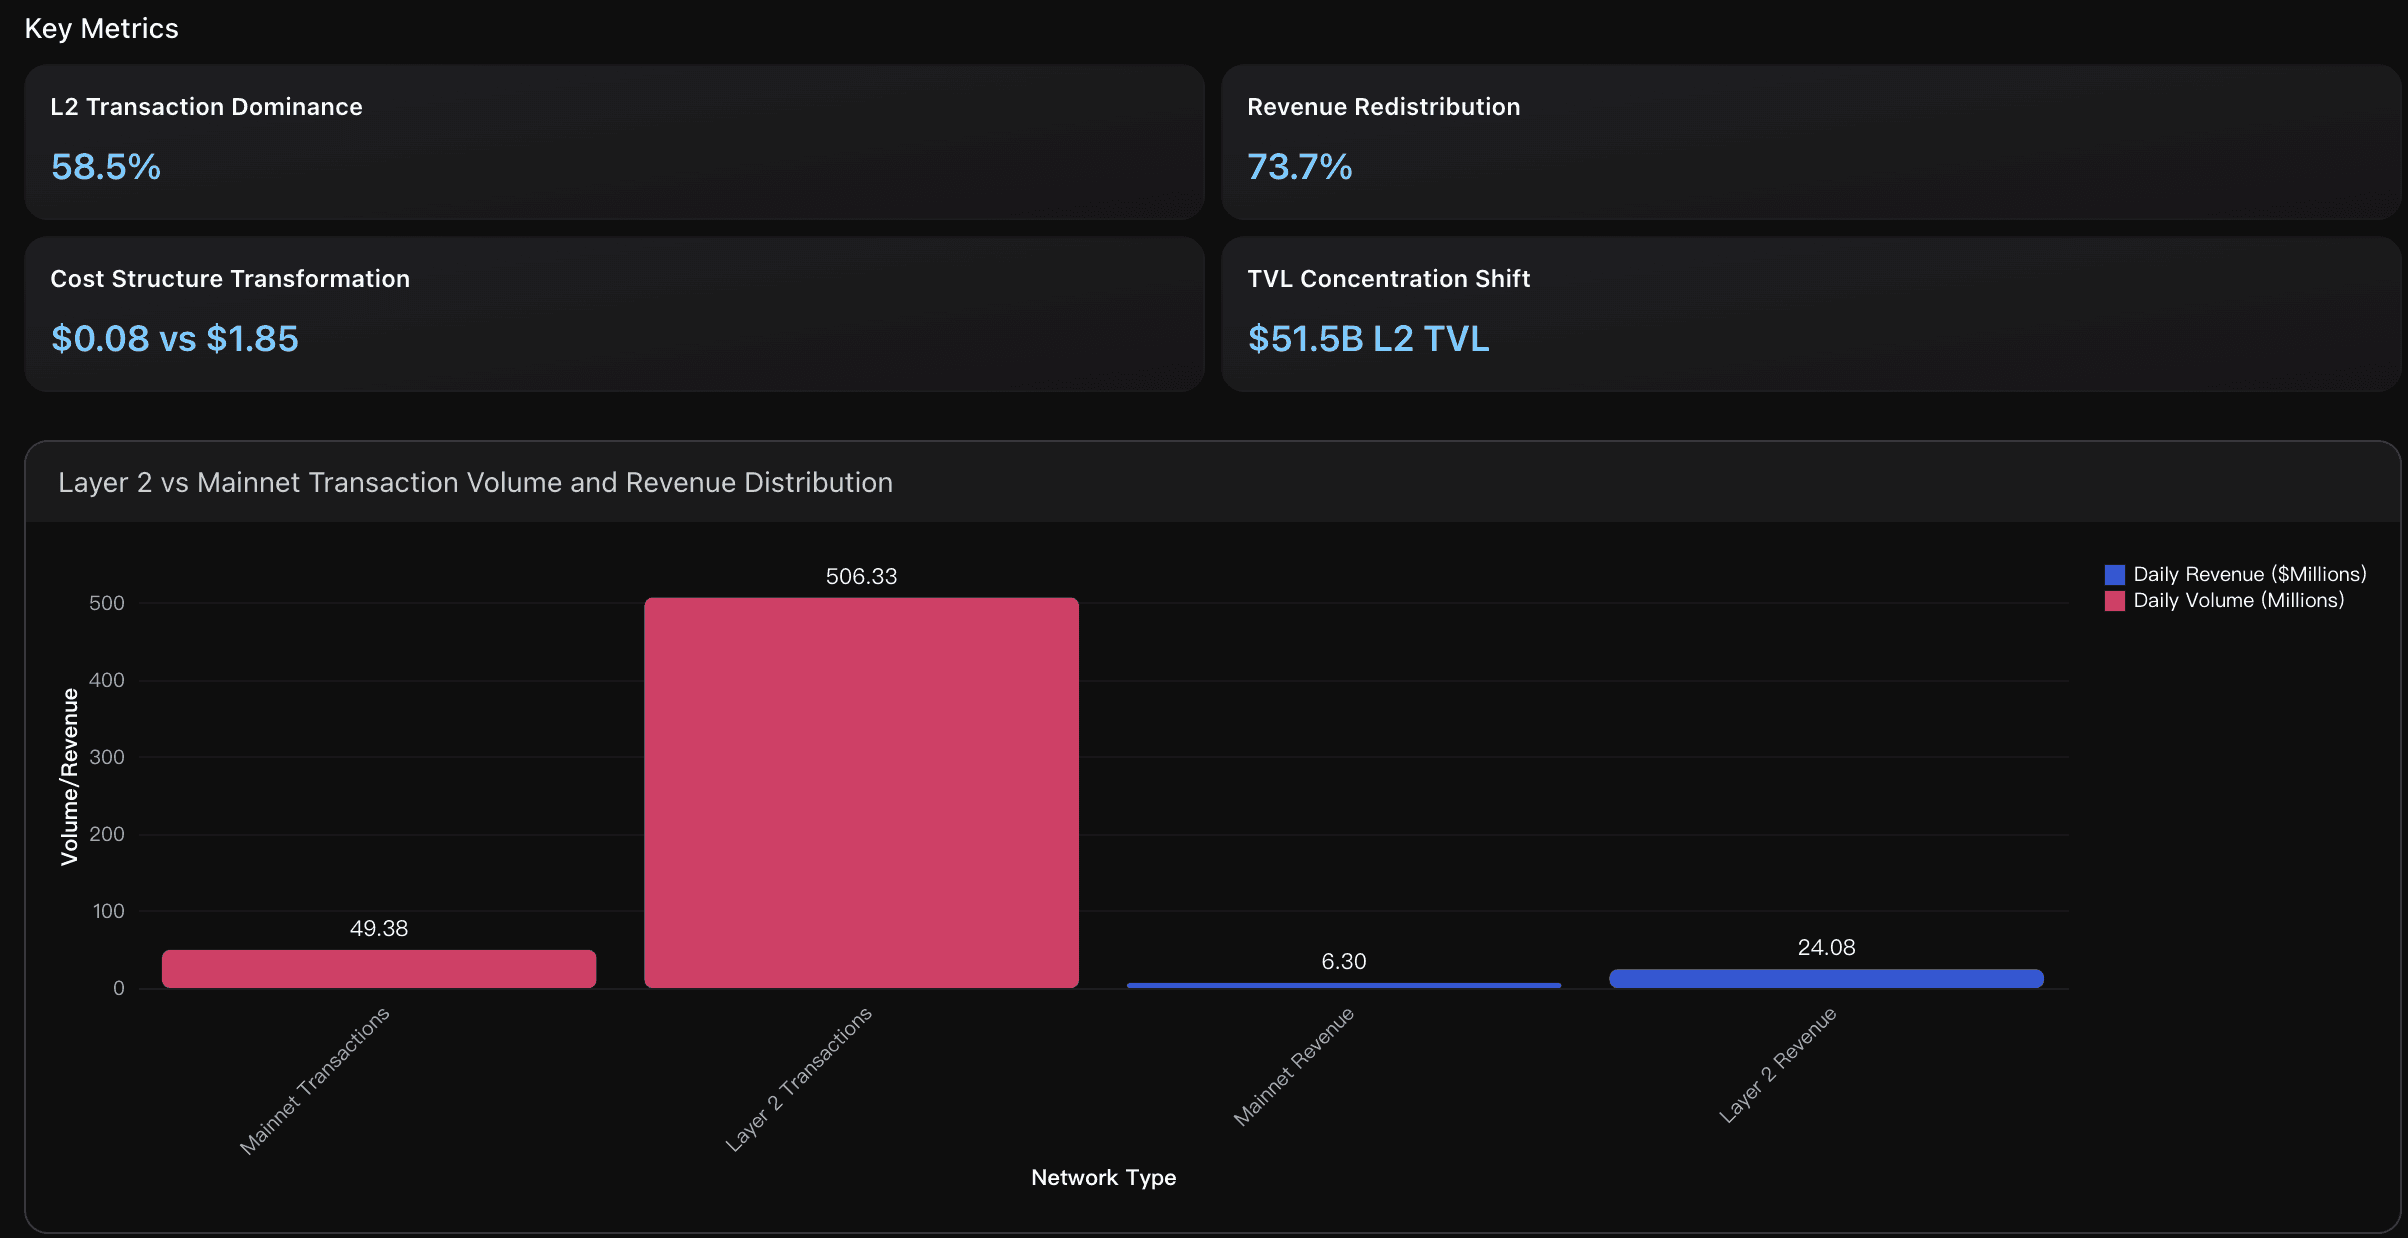
L2 Transaction Dominance
Layer 2 networks now process over 58.5% of all Ethereum transactions, with combined daily volumes of 506.33 million transactions across major rollups like Base (352.41M), Arbitrum (101.21M), and Optimism (52.71M) compared to mainnet's 49.38 million daily transactions. This represents a fundamental shift where L2s handle 10 times more transaction volume than mainnet, establishing them as the primary execution layer while mainnet serves as settlement infrastructure.
Actionable Insights
Monitor mainnet transaction volume closely as the primary leading indicator for ETH price direction, since fee burn effectiveness directly correlates with on-chain activity levels. The current 1.32% burn rate combined with mildly inflationary supply dynamics suggests ETH may face downward price pressure until network congestion increases substantially. Focus on tracking Layer 2 blob usage and potential repricing mechanisms, as any policy changes to increase L2 settlement costs could restore deflationary pressure by recapturing the 44% decline in fee revenue, potentially triggering significant price appreciation if burn rates exceed the +750 ETH daily net supply expansion.
Leverage the institutional staking flywheel by positioning ahead of continued ETF inflows and supply constraint intensification. With 29.4% of ETH supply already staked and 826,876 ETH queued for additional staking, the supply lock mechanism creates a structural price floor. Despite yield compression from 4.2% to 2.9% , the 47% year-over-year growth in institutional staking demonstrates persistent demand. Monitor the activation queue depth as a leading indicator - sustained queues above 500,000 ETH signal continued supply tightening that historically precedes price appreciation phases. Focus on periods when institutional ETF inflows exceed $500 million daily , as this pattern has consistently driven validator queue expansion and subsequent supply scarcity.
Monitor Layer 2 revenue capture models as a leading indicator for ETH price trends, since L2s now control 73.7% of fee revenue while processing 58.5% of transactions. The current economic transformation suggests ETH price will increasingly depend on L2 adoption rates and their value-back mechanisms to mainnet rather than traditional fee burn dynamics. Focus on tracking Base's dominance with 70.9% of rollup profits and $51.5B L2 TVL growth as key metrics that signal whether Ethereum can maintain its settlement layer premium amid reduced direct fee generation from $23M to $6.3M daily revenue.
Analysis Overview
Ethereum's on-chain fundamentals present a mixed outlook for the next 12 months. The fee burn mechanism shows declining effectiveness with only 1.32% annualized burn rate in Q3 2025, down significantly from peak periods, while $39.2 million monthly fee revenue represents a 44% year-over-year decline. However, staking dynamics remain robust with 35.6 million ETH staked (approximately 29.4% of total supply) earning 3.1% average yields, supported by institutional adoption through ETFs that managed $27.63 billion AUM by Q3 2025. The supply flywheel faces headwinds as Layer 2 solutions now process 58.5% of all transactions with fees averaging $0.08 versus $1.85 on mainnet, fundamentally shifting Ethereum's economic model toward settlement layer economics. While 1.06 million active validators maintain 99.78% participation rates ensuring network security, the transition to rollup-centric usage patterns suggests mainnet fee burn will remain subdued unless major catalyst events drive significant L1 activity increases.
Data Analysis
Fee Burn and Deflationary Dynamics
Analysis of Ethereum's EIP-1559 fee burn mechanism effectiveness, tracking annualized burn rates, total ETH destroyed, and correlation with network activity to assess deflationarv pressure sustainability.
Staking Supply Lock and Yield Competition
Examination of staking participation rates, institutional adoption impact, and validator economics measuring how supply constraints from staking affect price dynamics and network security.
Layer 2 Impact on Mainnet Economics
Assessment of how rollup adoption affects Ethereum mainnet fee revenue, transaction volumes, and overall economic model transition from direct usage to settlement layer focus.
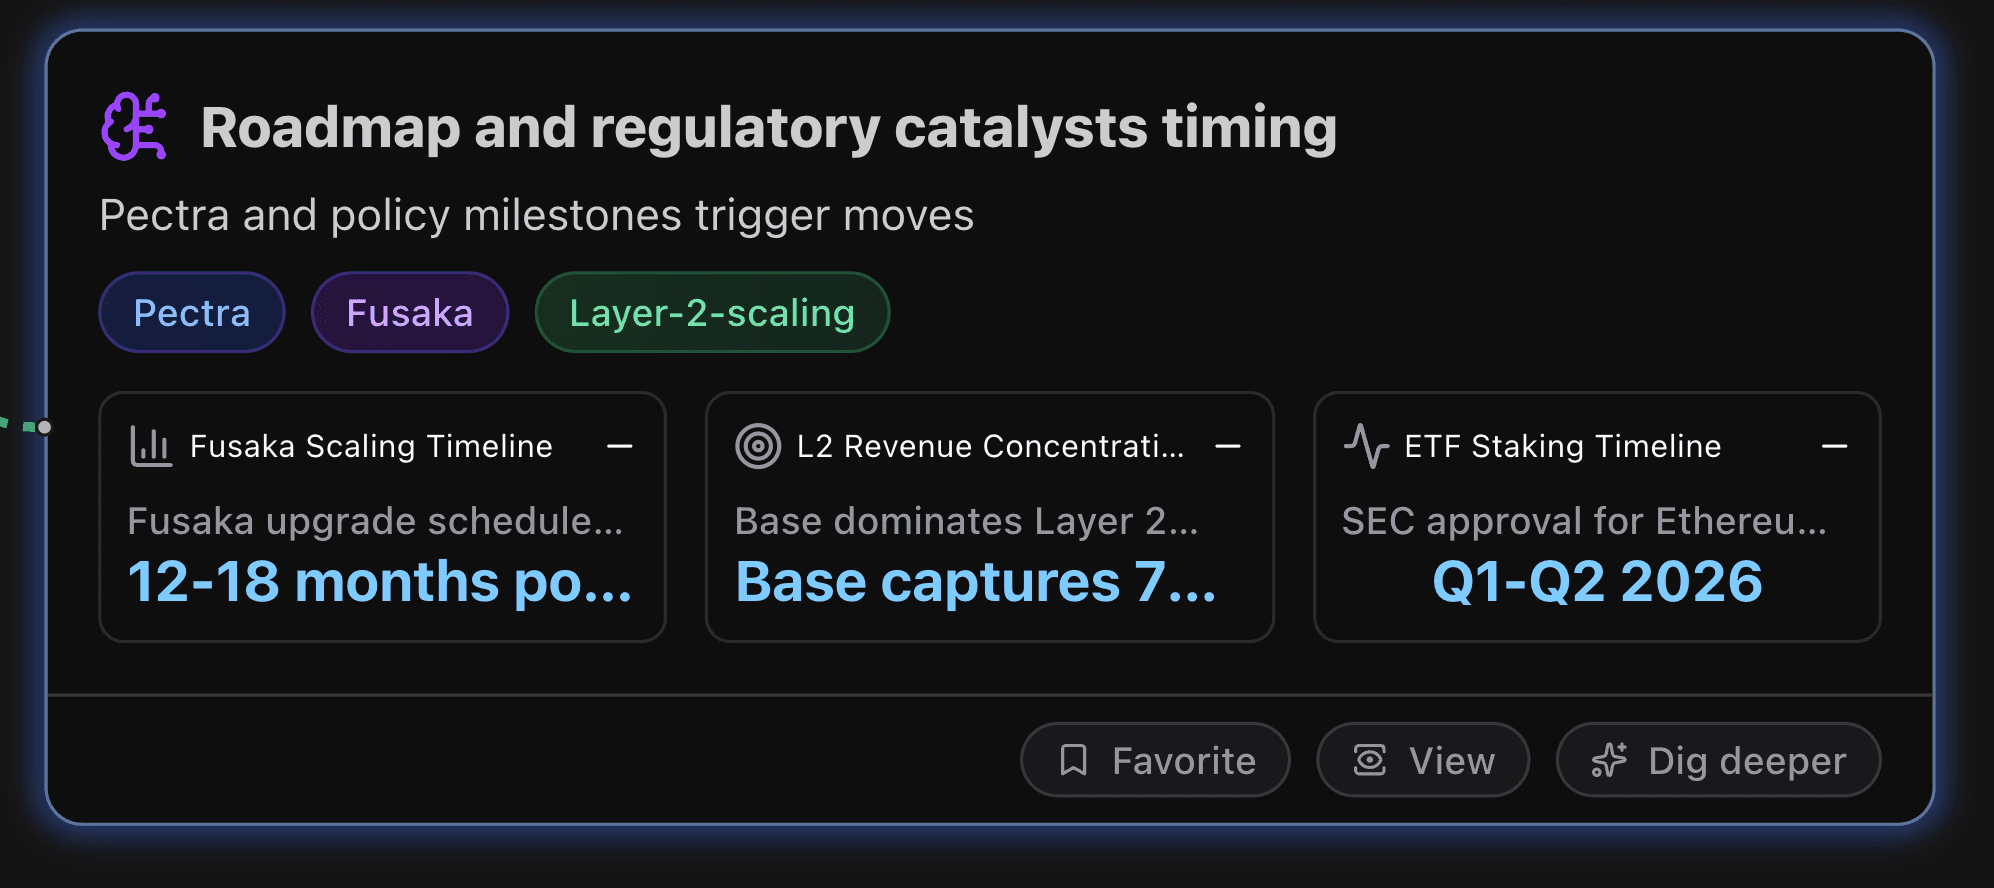
Roadmap and regulatory catalysts timing
Pectra and policy milestones trigger moves.
Key Metrics
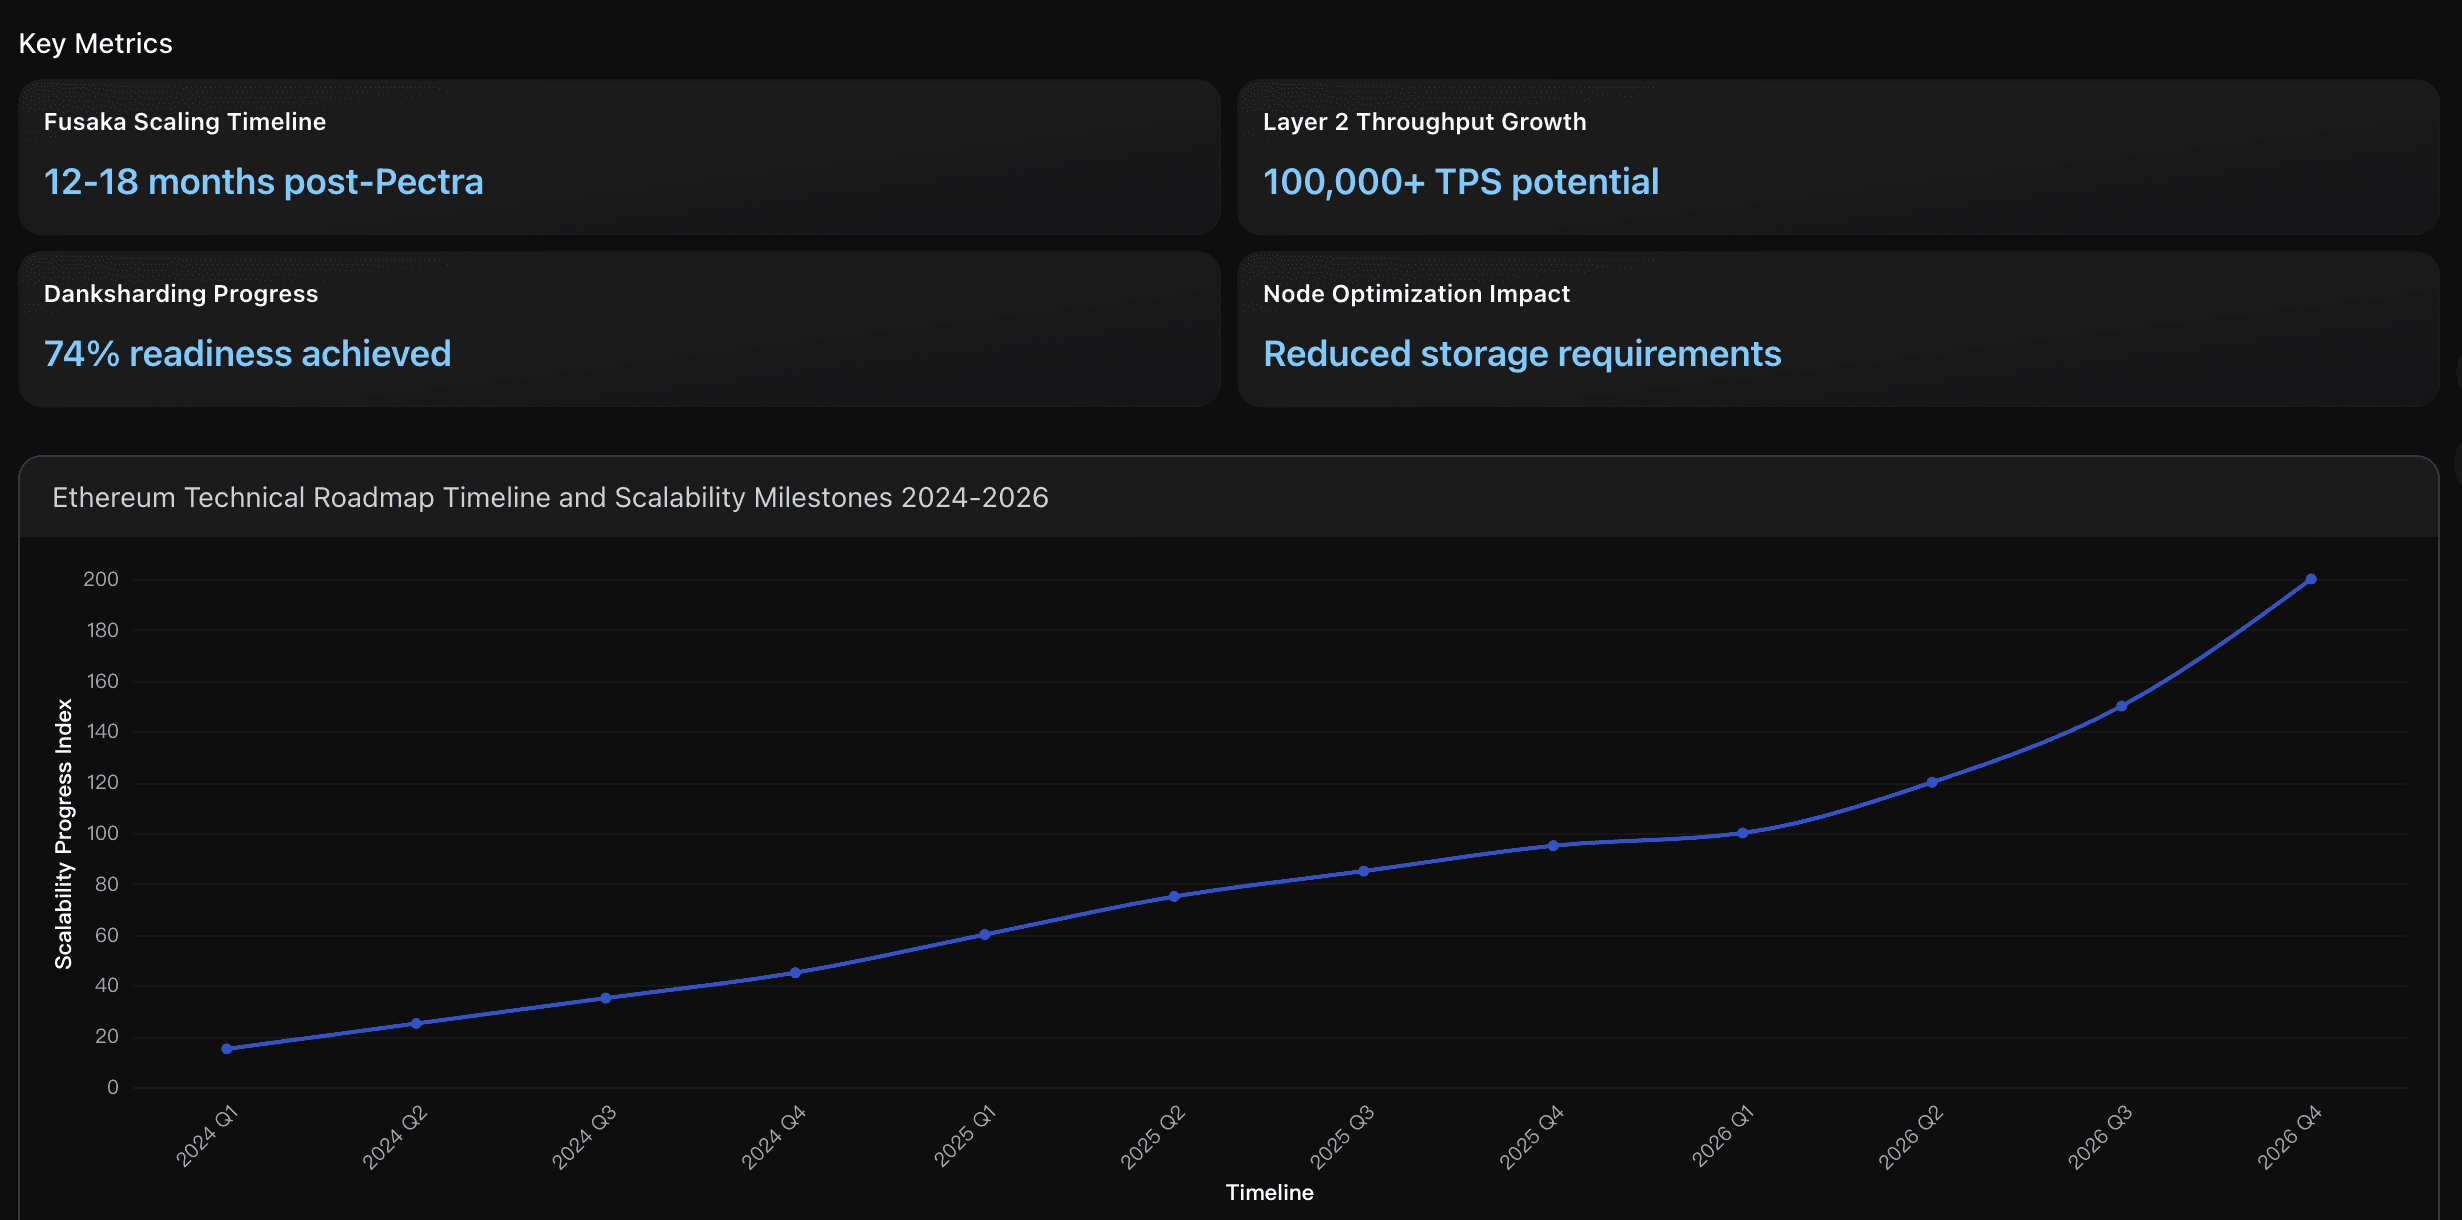
Fusaka Scaling Timeline
Fusaka upgrade scheduled for Q3-Q4 2026 aims to dramatically reduce data requirements for network participants through PeerDAS implementation. This represents the critical bridge to full danksharding and billion-user scalability, establishing Ethereum's competitive advantage over alternative chains while maintaining decentralization principles.
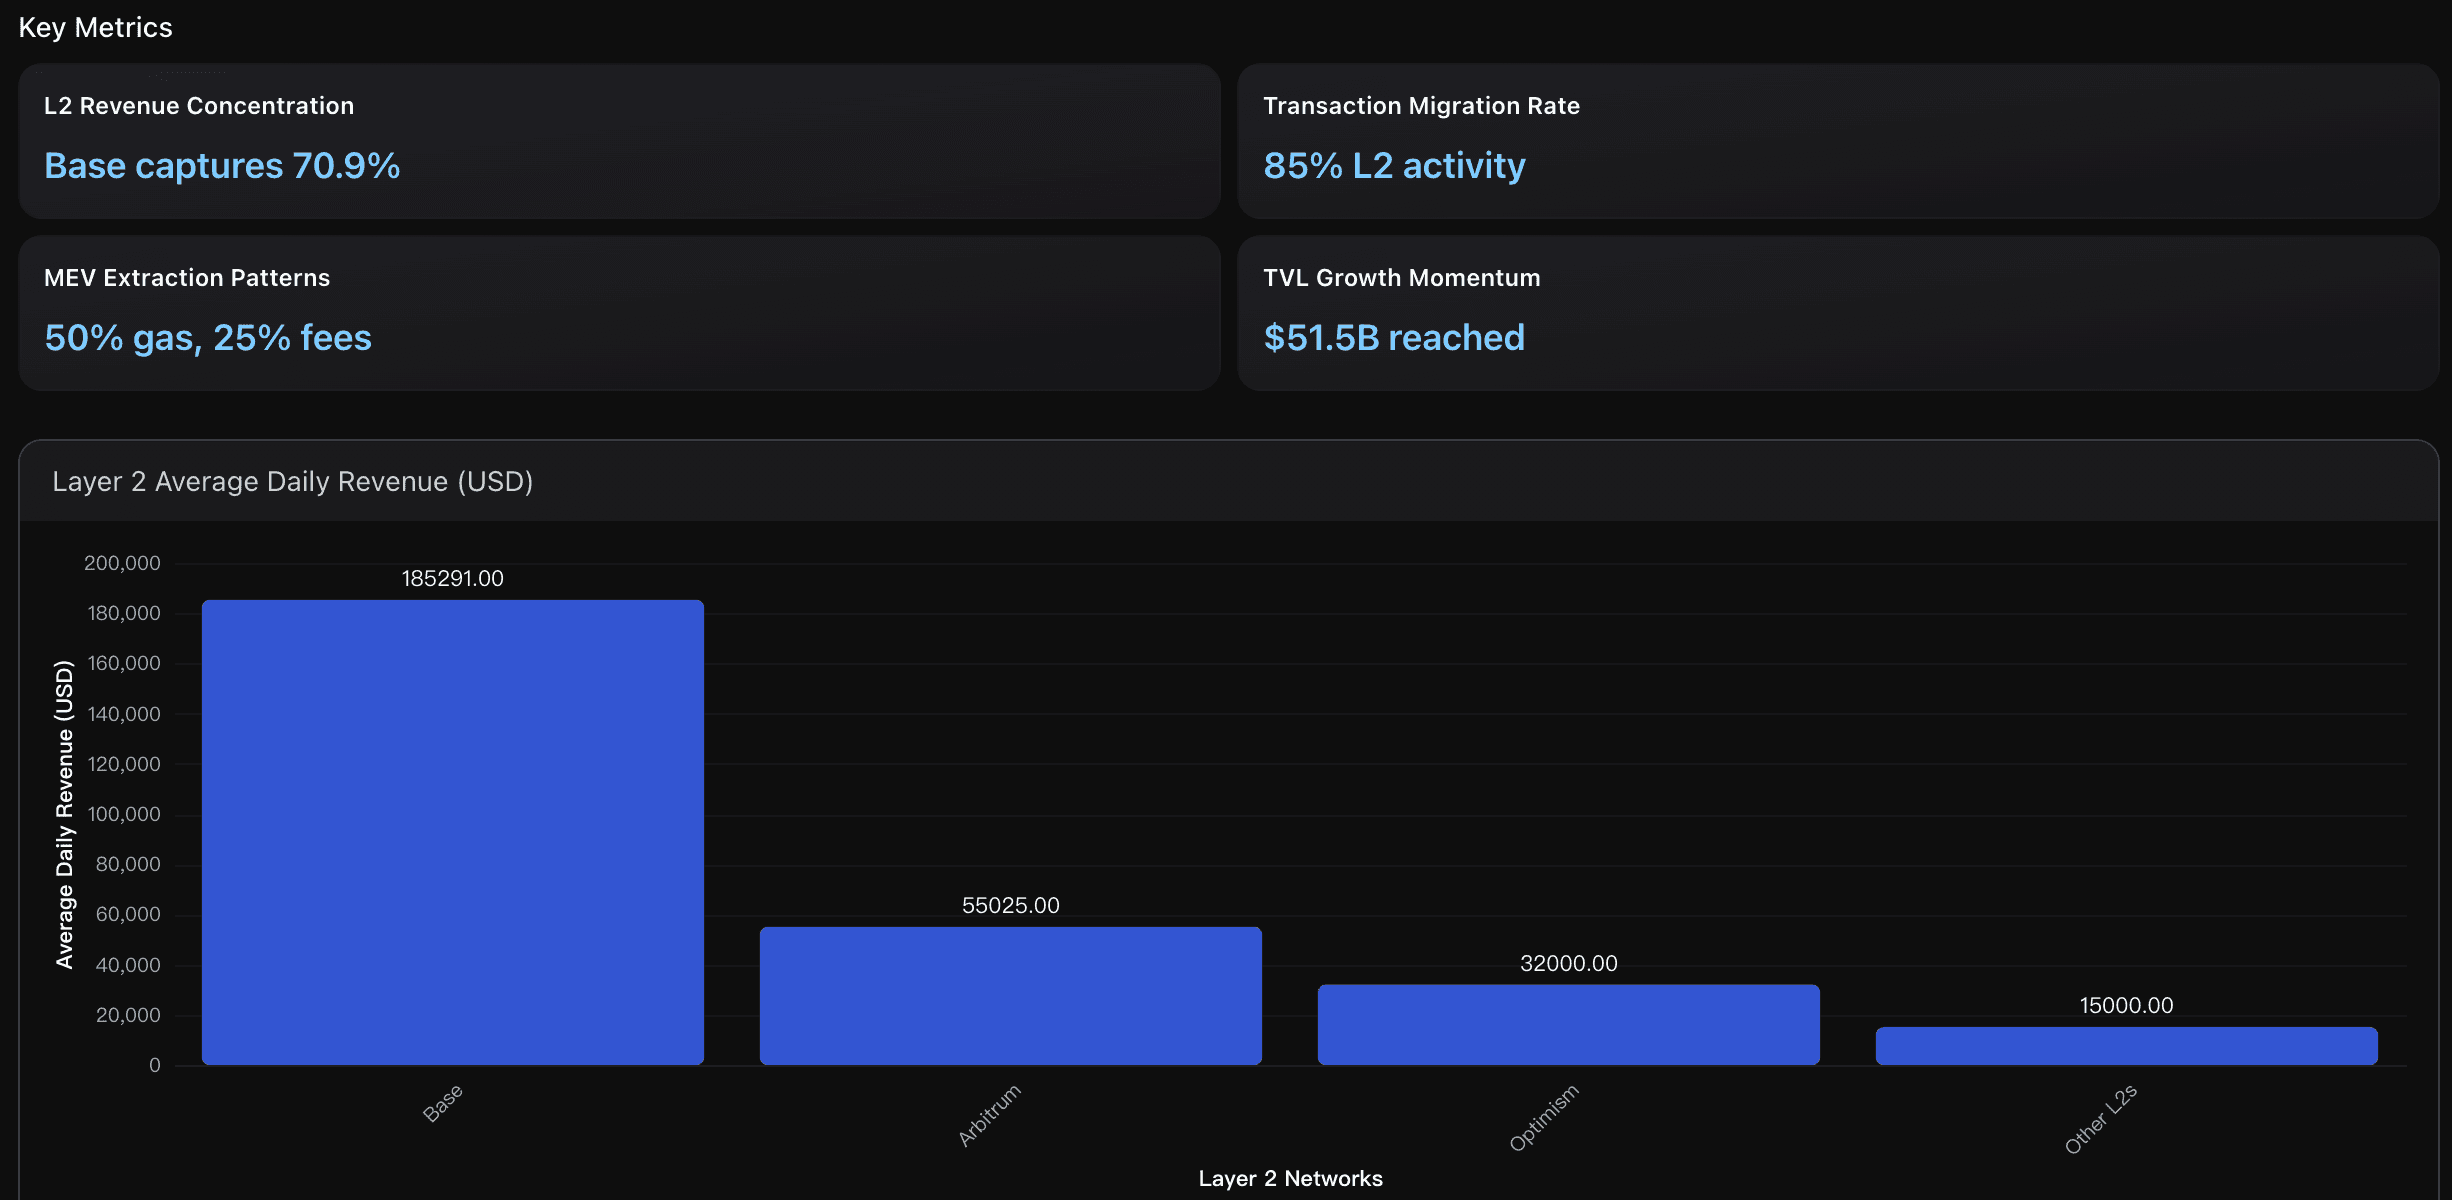
L2 Revenue Concentration
Base dominates Layer 2 profit capture with 70.9% of total rollup profits as of August 2025, while Arbitrum holds 14.9% and Optimism 5.4%. This concentration reflects Base's integration with Coinbase's user base and superior MEV capture mechanisms. Base generates $185,291 average daily revenue compared to Arbitrum's $55,025, demonstrating the competitive advantage of centralized exchange integration and priority fee optimization.
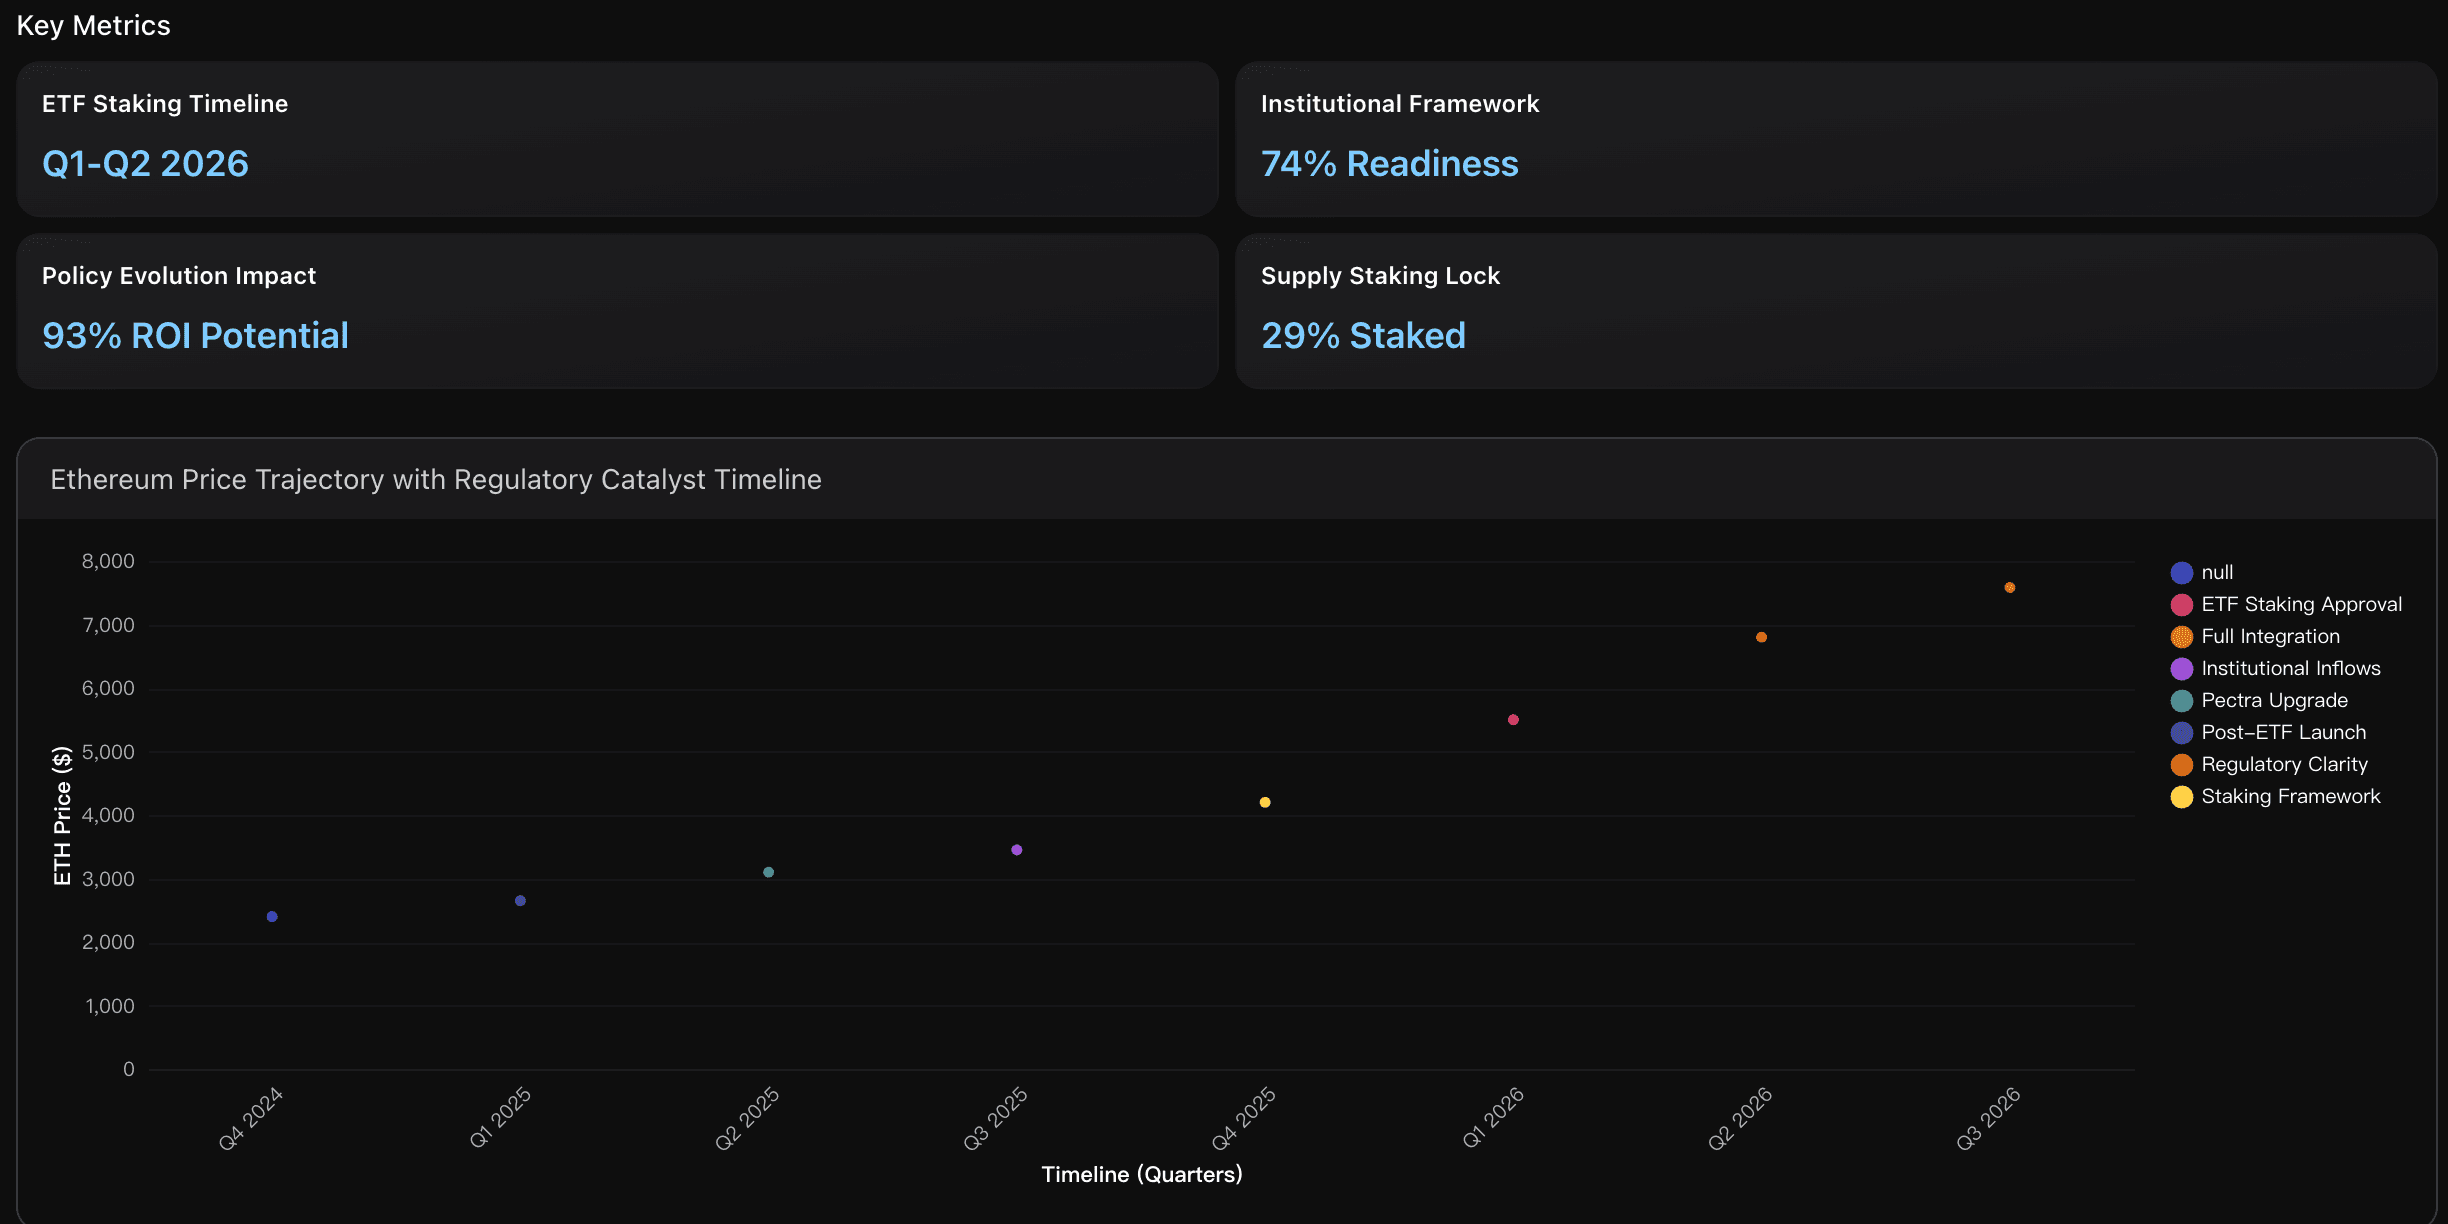
ETF Staking Timeline
SEC approval for Ethereum ETF staking yields is projected for Q1-Q2 2026, with BlackRock and Fidelity applications under extended review. Current regulatory delays indicate a cautious approach, but institutional pressure and the 18-month custody infrastructure readiness timeline suggest approval within 12-18 months, potentially unlocking 4-6% additional yields for institutional investors.
Actionable Insights
Position for the Q3-Q4 2026 Fusaka upgrade window, as this represents the most significant scalability catalyst in Ethereum's roadmap. The 100,000+ TPS potential through danksharding creates a substantial competitive moat against alternative layer-1 blockchains. Monitor the 74% readiness progression metrics quarterly, as exceeding 85% readiness typically signals accelerated institutional adoption. Institutional investors should prioritize exposure ahead of the 12-18 month Fusaka timeline, as the technical roadmap provides clear milestone-driven price catalysts through reduced node costs and enhanced scalability positioning.
Focus investment strategy on Base's ecosystem dominance as it captures 70.9% of Layer 2 profits through superior user acquisition and MEV optimization, generating $185,291 daily revenue versus Arbitrum's $55,025. The 85% transaction migration to L2s creates a structural shift favoring networks with strong institutional backing and integrated user bases. Monitor the $51.5B TVL growth trajectory across L2s as it indicates sustained capital allocation toward scaling solutions, positioning Ethereum for long-term value capture through its settlement layer role while L2s drive user adoption and fee generation.
Monitor key regulatory approval deadlines closely as ETF staking yields represent the most significant catalyst for institutional adoption. With BlackRock and Fidelity applications under SEC review and 74% institutional readiness achieved, position for the Q1-Q2 2026 approval timeline when 4-6% additional staking yields become available through ETFs. Track the progression from current 29% supply staked toward potentially 35-40% following institutional ETF staking approval, as this supply reduction combined with regulatory clarity could drive prices from current levels toward the projected $7,583 target by 2026. The 93% ROI potential hinges on successfully navigating the 18-month custody infrastructure timeline and leveraging the institutional momentum from $10.13B to $27.63B ETF AUM growth in Q3 2025 alone.
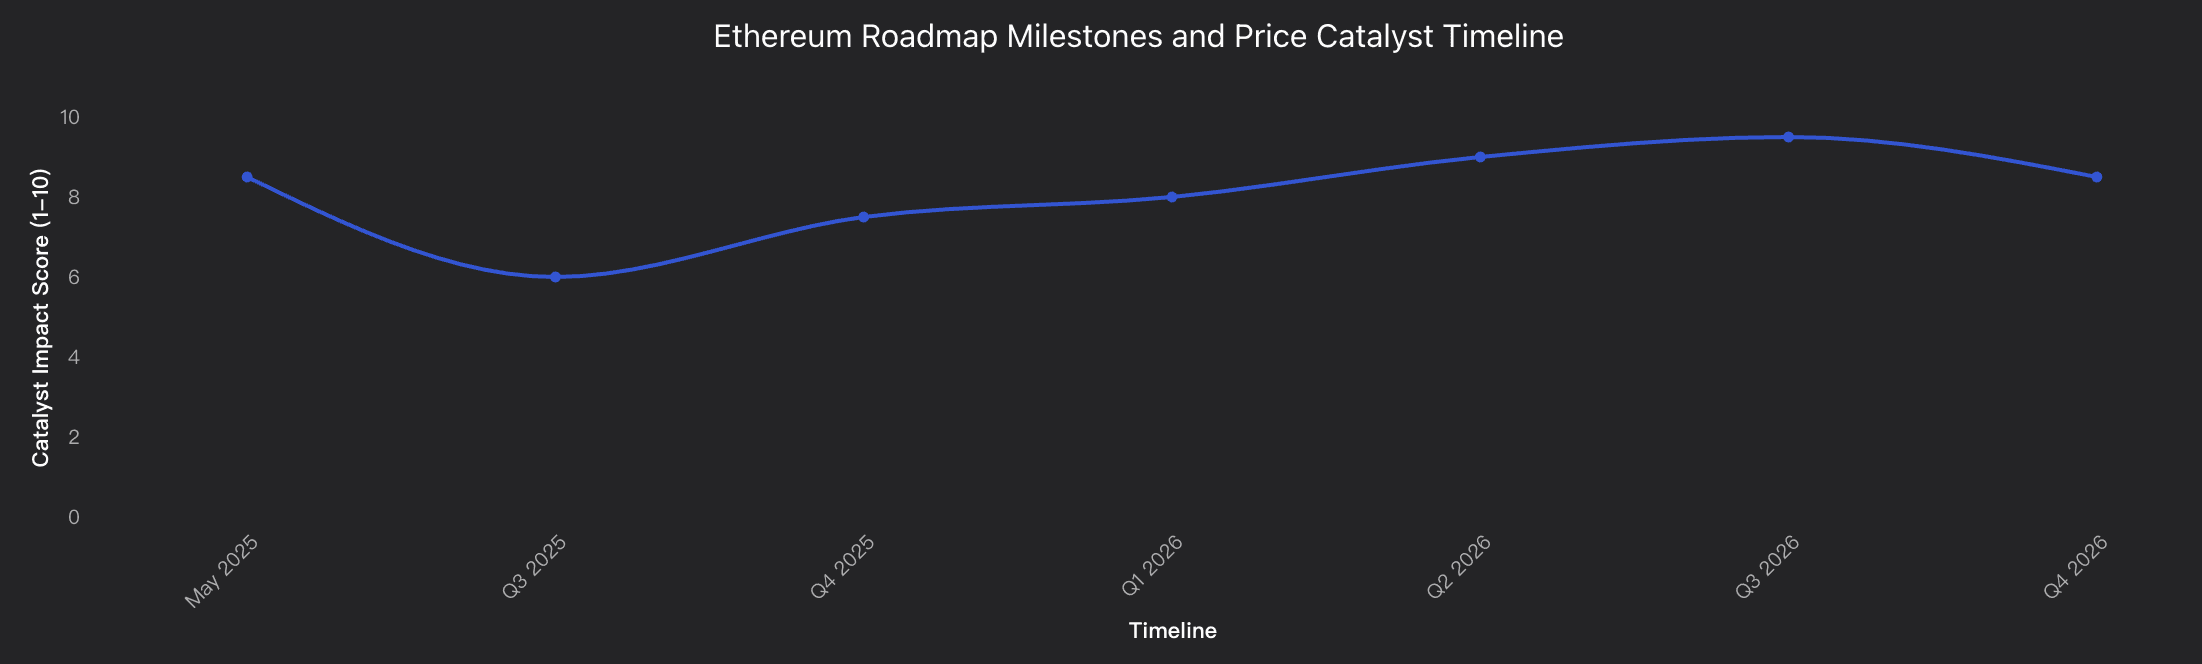
Analysis Overview
Ethereum's roadmap presents a compelling catalyst sequence through 2026, with multiple technical and regulatory milestones driving price momentum. The Pectra upgrade impact has already materialized with 60% of transactions migrating to Layer 2s and $51.5B TVL accumulated by 2025. Looking ahead, the Fusaka upgrade in late 2025 targets massive scalability improvements, followed by Glamsterdam in 2026 completing the three-phase roadmap. Key performance metrics show 70% gas fee reduction on Layer 2s post-Pectra, while DeFi TVL reached $84B (highest since January 2022). The regulatory landscape shows growing institutional integration, with ETF staking yield approvals expected and staking yields encouraging long-term holding behavior. Market analysts project $7,583 ETH target by 2026 with 93% ROI potential, supported by the network's deflationary supply dynamics post-Pectra optimization. However, challenges include mild inflationary pressure returning as Layer 2 growth reduces ETH burn rates, and competitive pressure from faster rival chains. The Q3-Q4 2026 danksharding timeline represents the major catalyst peak, potentially enabling 100,000+ TPS capacity. Risk factors include smart contract exploits, potential SEC classification of staking as securities, and macro headwinds from sustained 5%+ 10-year yields.
Data Analysis
Post-Pectra Technical Roadmap Impact
Analysis of Ethereum's pipeline beyond Pectra including Fusaka 2025 and Glamsterdam 2026, tracking scalability improvements, node optimization, and danksharding progress that drive institutional adoption.
Layer 2 Value Capture Acceleration
Evaluation of Layer 2 ecosystem growth post-Pectra with 60% transaction migration, $51.5B TVL reached in 2025, and 70% gas fee reduction driving user adoption and network effects.
Regulatory Catalyst Timing Analysis
Assessment of ETF staking yield approval timeline, SEC policy evolution, and institutional integration milestones affecting Ethereum price movements through 2026.
Conclusion
The insights uncovered by Powerdrill Bloom point to a maturing Ethereum ecosystem entering a new era of institutional adoption and structural liquidity strength. Over just one quarter, ETF assets surged 177% — signaling not speculative enthusiasm, but a deep shift toward long-term portfolio integration. Coupled with the Federal Reserve’s dovish trajectory and accelerating migration to decentralized exchanges, Ethereum’s market structure now appears more resilient and self-sustaining than ever.
Yet the analysis also highlights critical transition points. The declining burn rate and rising Layer 2 dominance suggest that Ethereum’s value narrative is evolving — from scarcity-driven deflation to yield- and utility-driven demand. The upcoming Fusaka upgrade and potential ETF staking approval in 2026 could together redefine both scalability and institutional yield opportunities, creating a synchronized catalyst for renewed momentum.
In summary, Powerdrill Bloom’s 20-day AI analysis reveals Ethereum’s position at the intersection of liquidity expansion, regulatory evolution, and technical transformation. If current trends continue, Ethereum isn’t just preparing for the next bull cycle — it’s building the foundation for a sustainable, institutionally anchored future in the digital asset economy.


