
Introduction
What if you could see the entire world’s economic, digital, and environmental balance — or imbalance — through data? Using Powerdrill Bloom, I explored a Kaggle dataset covering over 200 countries, uncovering surprising patterns hidden beneath global development numbers.
The results were eye-opening: some regions like Western Europe and North America show complete economic dominance, while others — especially Sub-Saharan Africa and South-Eastern Asia — still face deep internal gaps. The digital divide turned out to be just as dramatic, with internet access ranging from almost zero to near-total coverage. And when it comes to sustainability and education, only a handful of countries — Latvia, Estonia, and Slovenia — manage to balance prosperity with low emissions and high learning rates.
In this blog, I’ll share how Powerdrill Bloom's AI-driven analysis turned raw Kaggle data into clear, visual insights — revealing not only where the world stands today, but why the path toward global convergence remains uneven.
To view the original exploration report and sample PPTs, please visit: https://bloom.powerdrill.ai/share/NnLK90Ii.
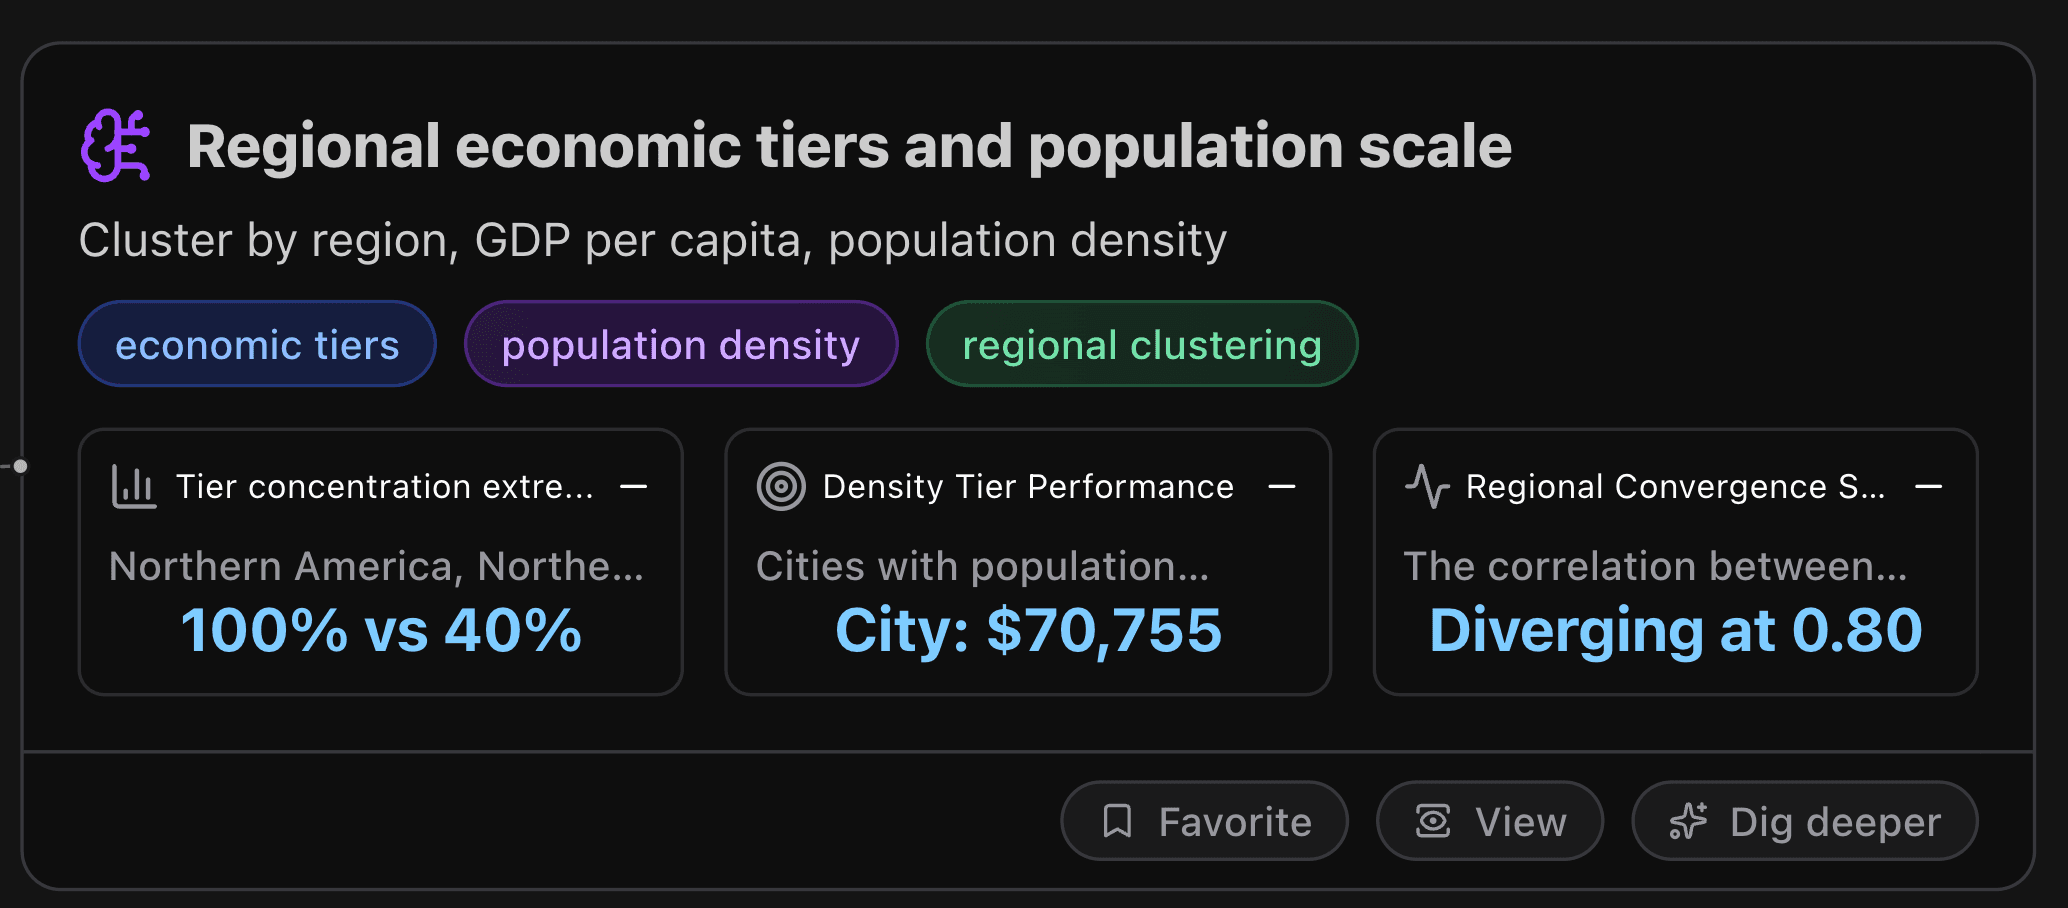
Regional economic tiers and population scale
Cluster by region, GDP per capita, population density.
Key Metrics
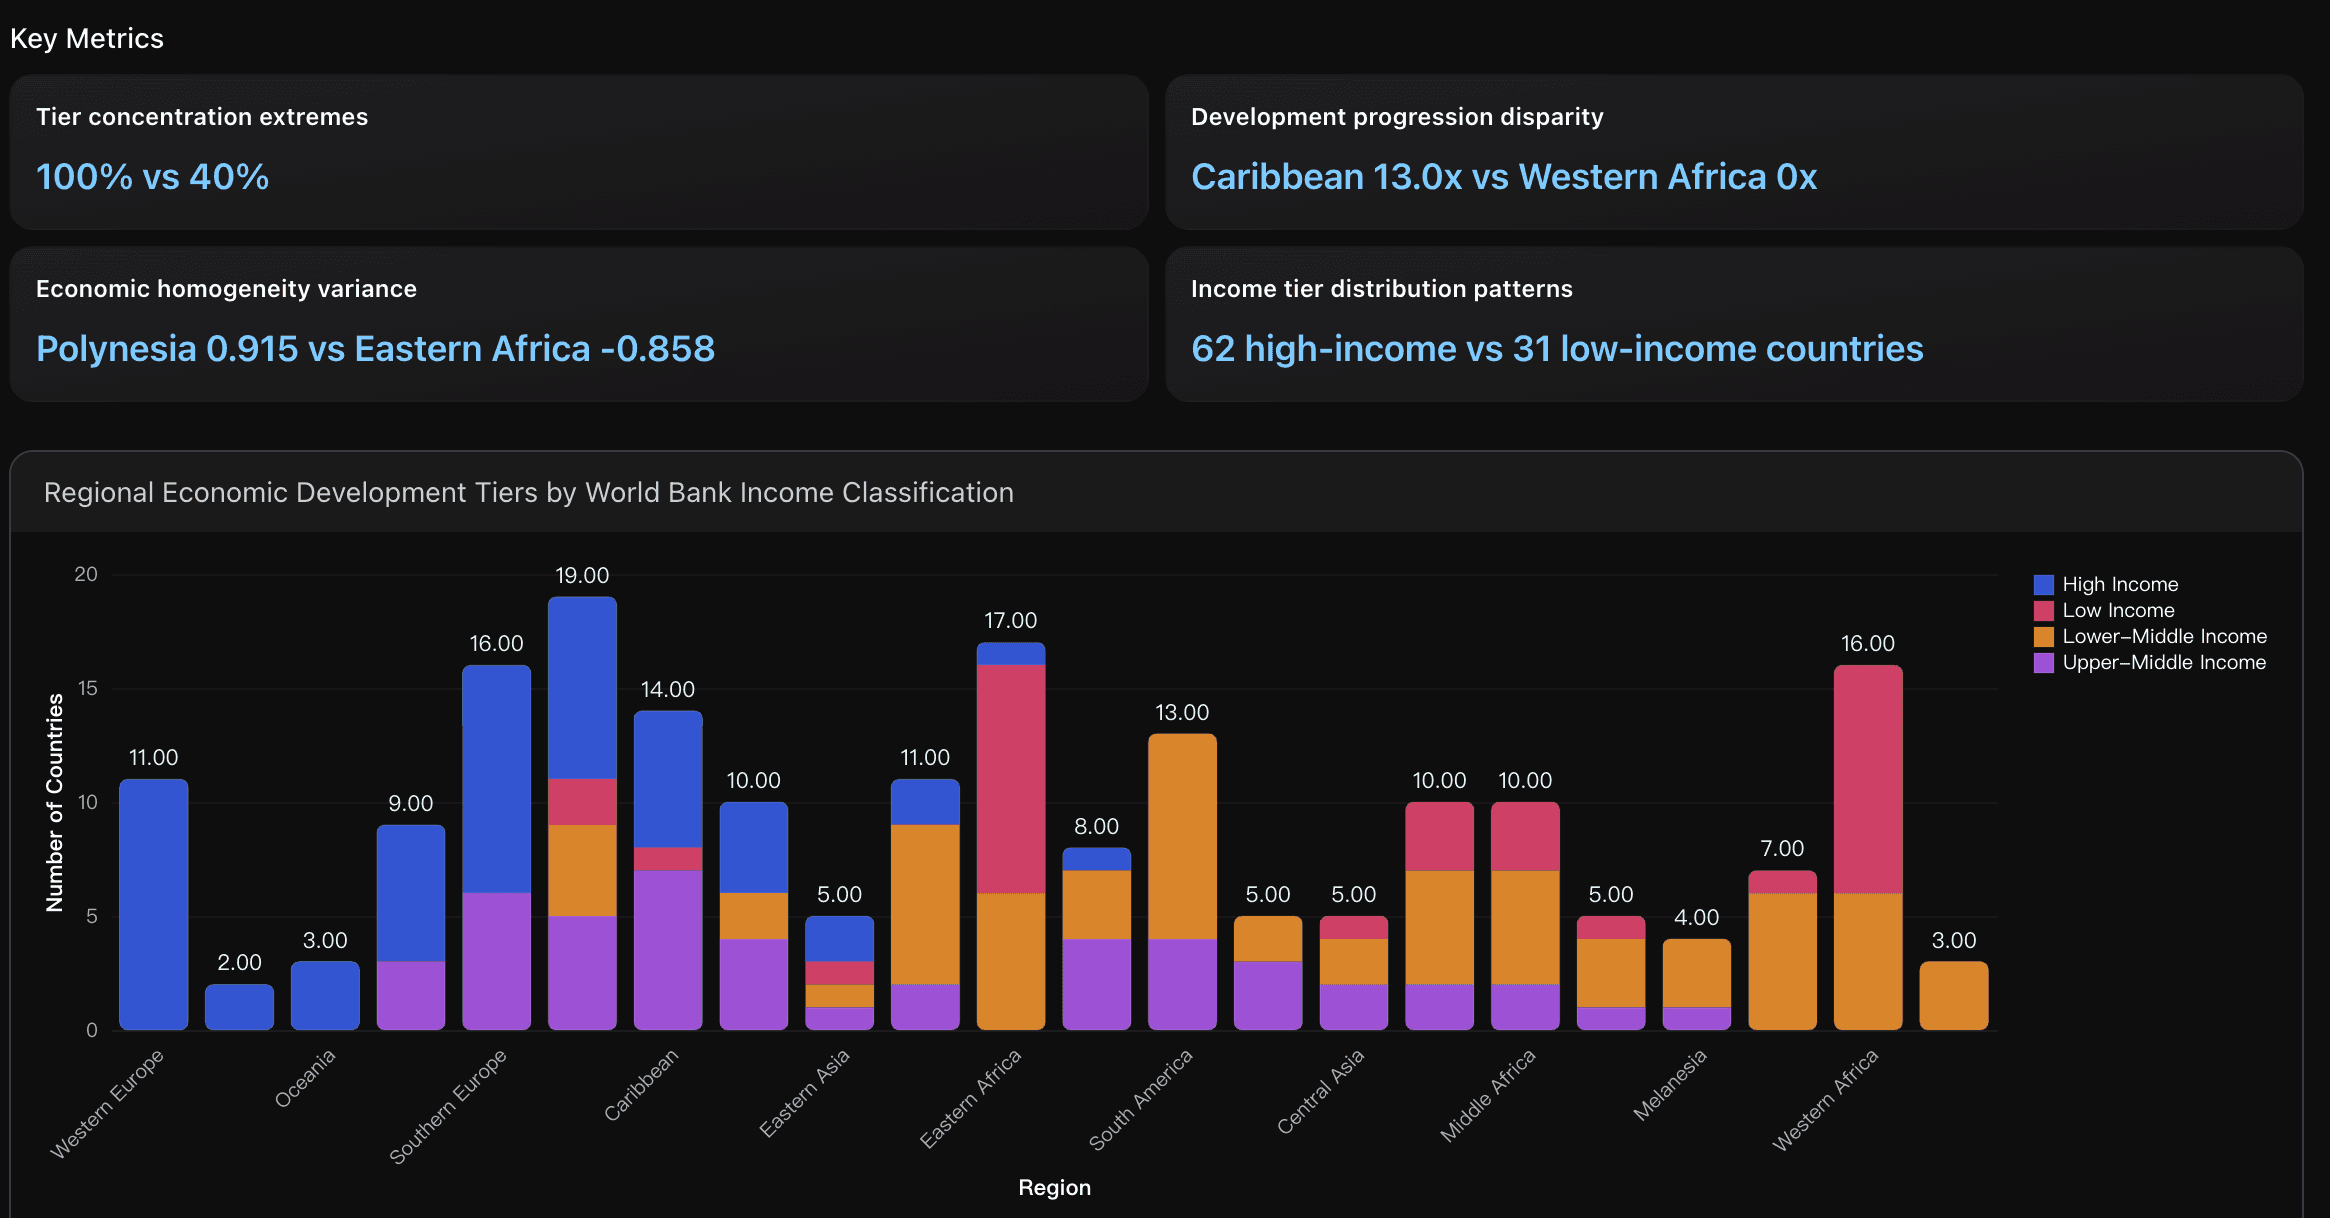
Tier concentration extremes
Northern America, Northern Europe, Oceania, and Western Europe achieve perfect tier concentration with 100% of countries in high-income category, while Central Asia shows the most diverse income distribution with only 40% concentration in upper-middle income tier. This 60 percentage point gap demonstrates stark differences in regional economic homogenization.
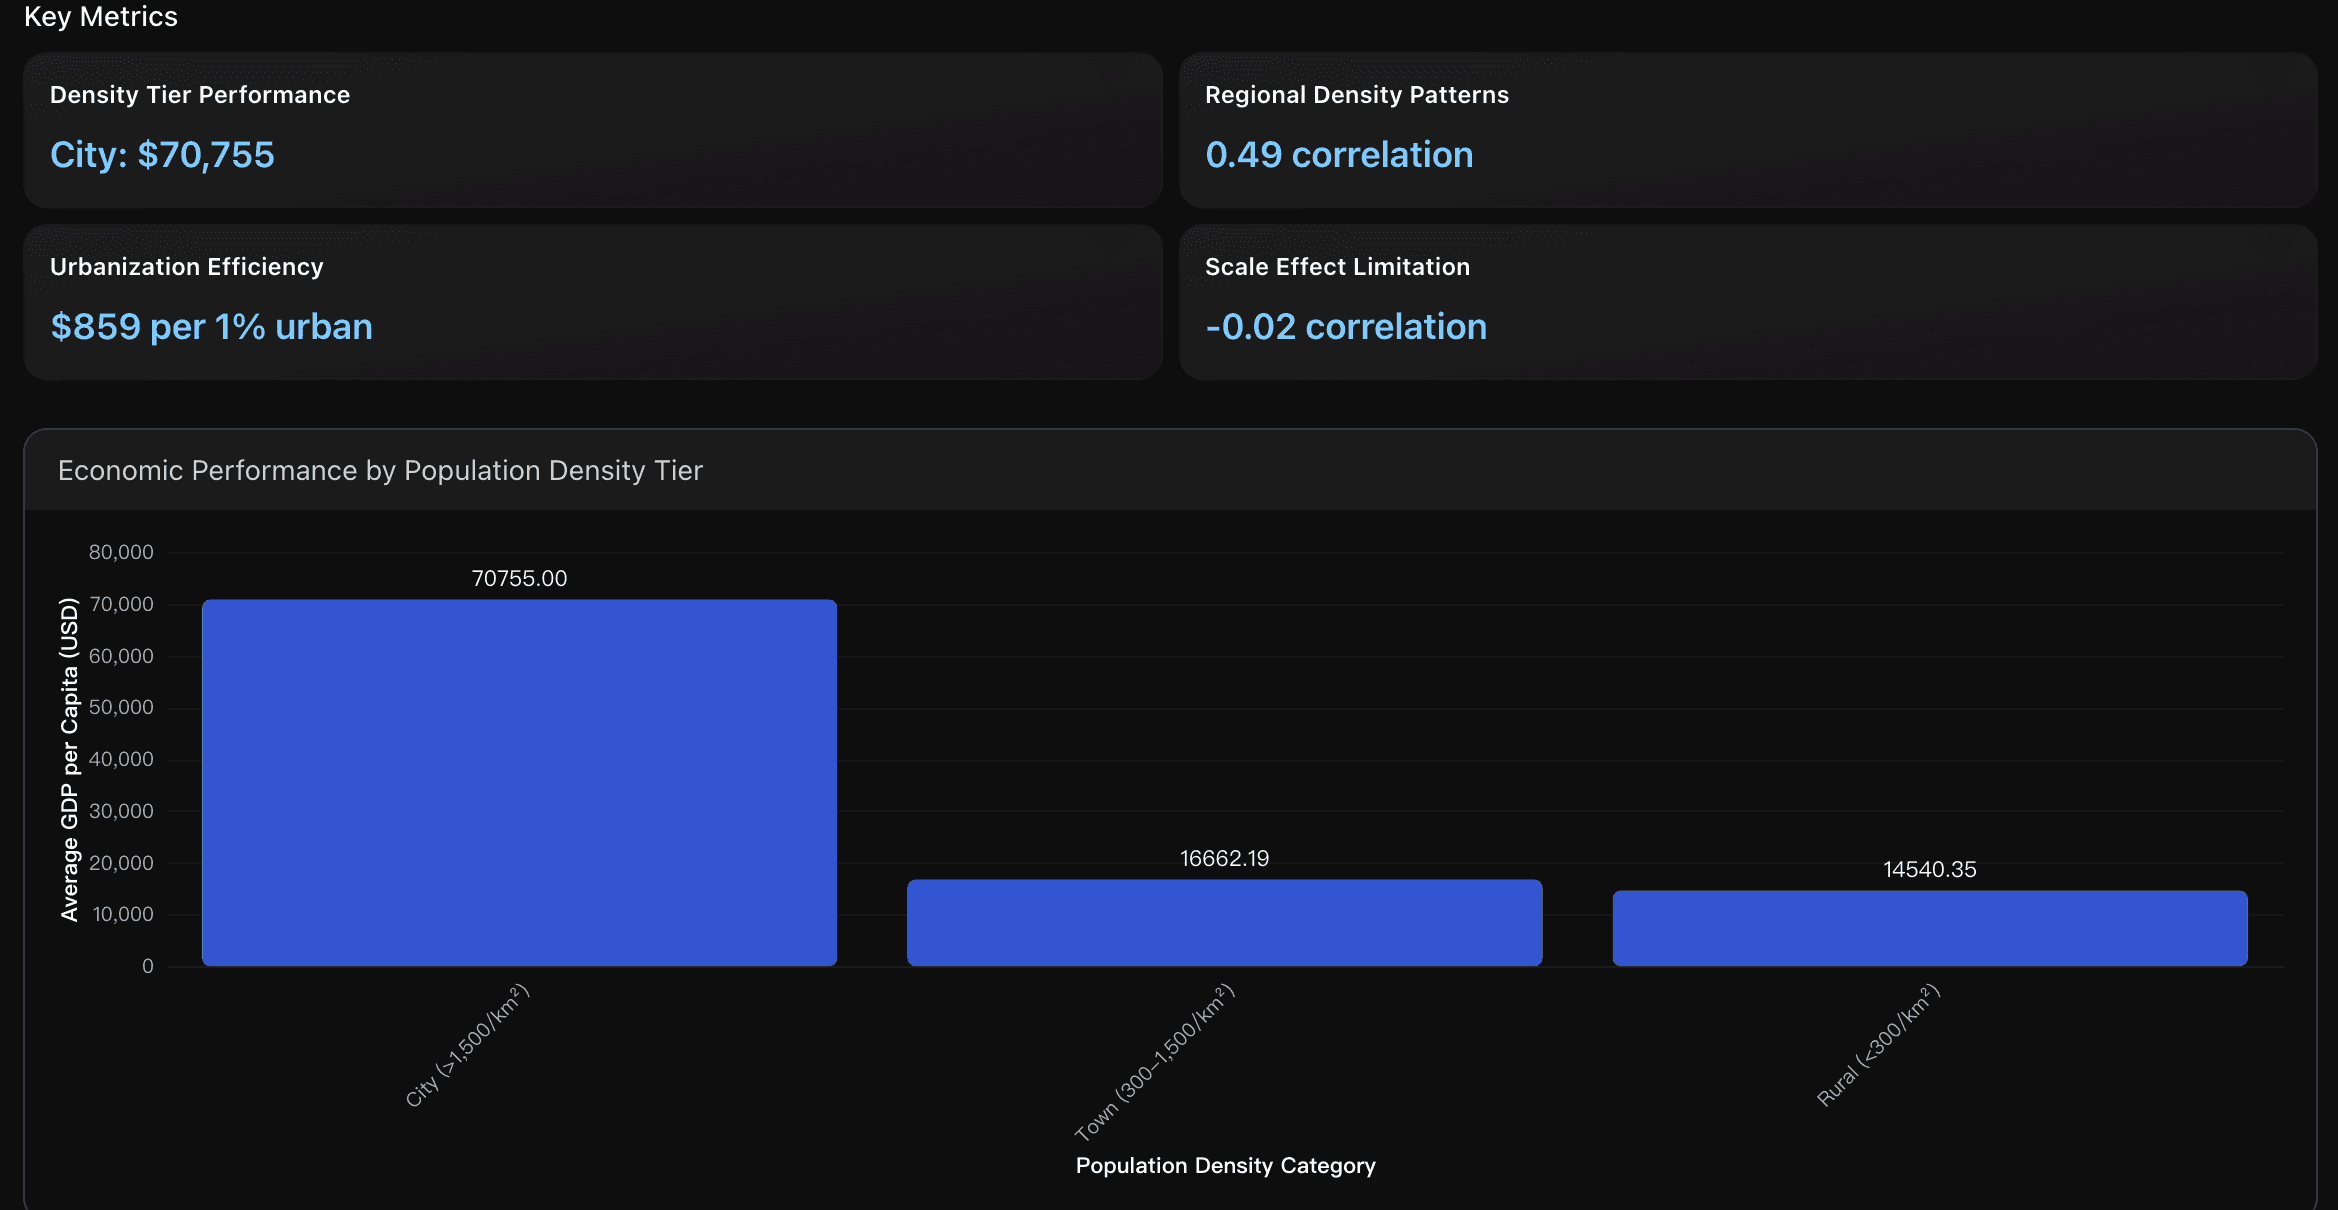
Density Tier Performance
Cities with population density exceeding 1,500 people per km² demonstrate exceptional economic productivity, averaging $70,755 GDP per capita compared to $16,662 for towns and $14,540 for rural areas. This 4.9x premium reflects agglomeration benefits including knowledge spillovers, shared infrastructure, and economies of scale that align with research showing 2-4% productivity gains from density doubling.
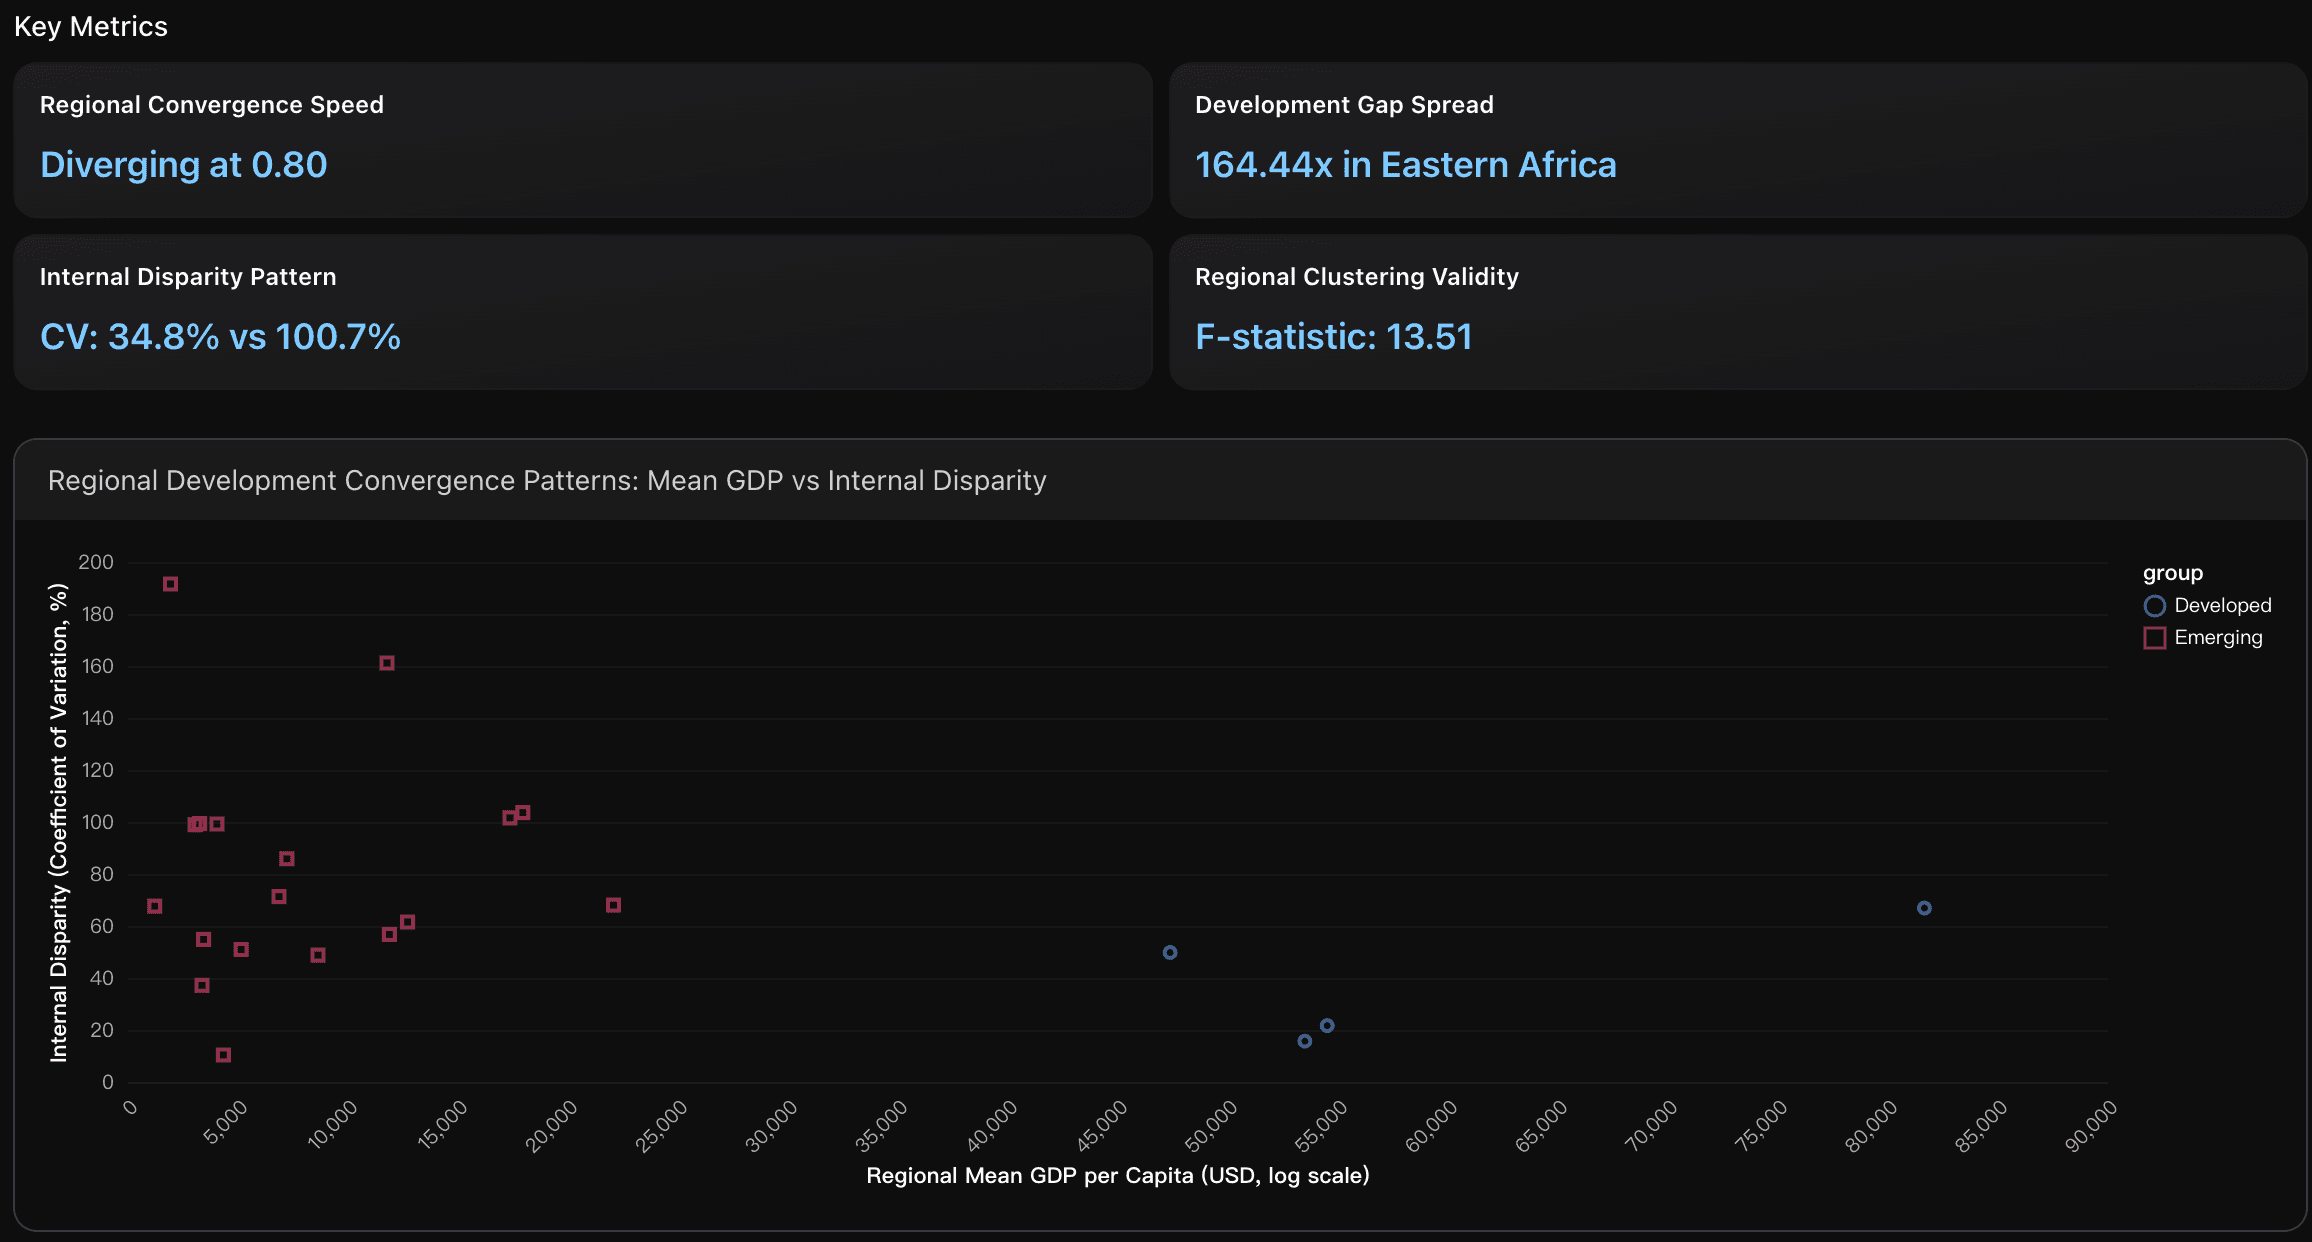
Regional Convergence Speed
The correlation between regional mean GDP and standard deviation is 0.80, indicating divergence rather than convergence. Regions with higher mean GDP per capita exhibit higher internal dispersion, suggesting the 'catch-up effect' theory is not materializing. This divergence pattern contradicts economic convergence theory and indicates widening gaps within wealthy regions.
Actionable Insights
Focus development assistance and investment strategies on regions with extreme tier concentration disparities to reduce global economic inequality. Prioritize Sub-Saharan African regions (Eastern Africa with 58.82% low-income concentration, Western Africa with 62.5%) for targeted economic development programs as these show the lowest development progression ratios. Establish cross-regional knowledge transfer mechanisms between highly developed regions (Western Europe, Northern Europe with 100% high-income concentration) and emerging economies to accelerate economic convergence. Implement middle-income trap prevention strategies in regions like South America and South-Eastern Asia where 76.92% and 63.64% respectively are concentrated in middle-income tiers, helping them transition to high-income status through innovation, education, and infrastructure investments.
Strategic Urban Development Focus: Prioritize developing high-density urban centers as they deliver exceptional economic returns, with cities generating $70,755 GDP per capita compared to $14,540 for rural areas. However, avoid one-size-fits-all approaches since regions like Northern America achieve $54,555 GDP per capita with low density through quality infrastructure and governance. Focus on enhancing urbanization efficiency by targeting the $859 GDP per capita per 1% urban population benchmark achieved by city-tier areas, emphasizing knowledge clustering, shared infrastructure development, and agglomeration benefits while ensuring adequate governance frameworks support sustainable density increases.
Focus on emerging regions with extreme internal disparities for targeted development interventions. Prioritize Eastern Africa and South-Eastern Asia where internal development gaps exceed 164x and 46x respectively - these regions show the highest potential for catch-up effects if internal barriers are addressed. Implement regional integration programs to reduce the 100.7% average coefficient of variation in emerging economies compared to 34.8% in developed regions. Given the 0.80 correlation indicating divergence rather than natural convergence, active policy intervention is essential to prevent further economic polarization within regions.
Analysis Overview
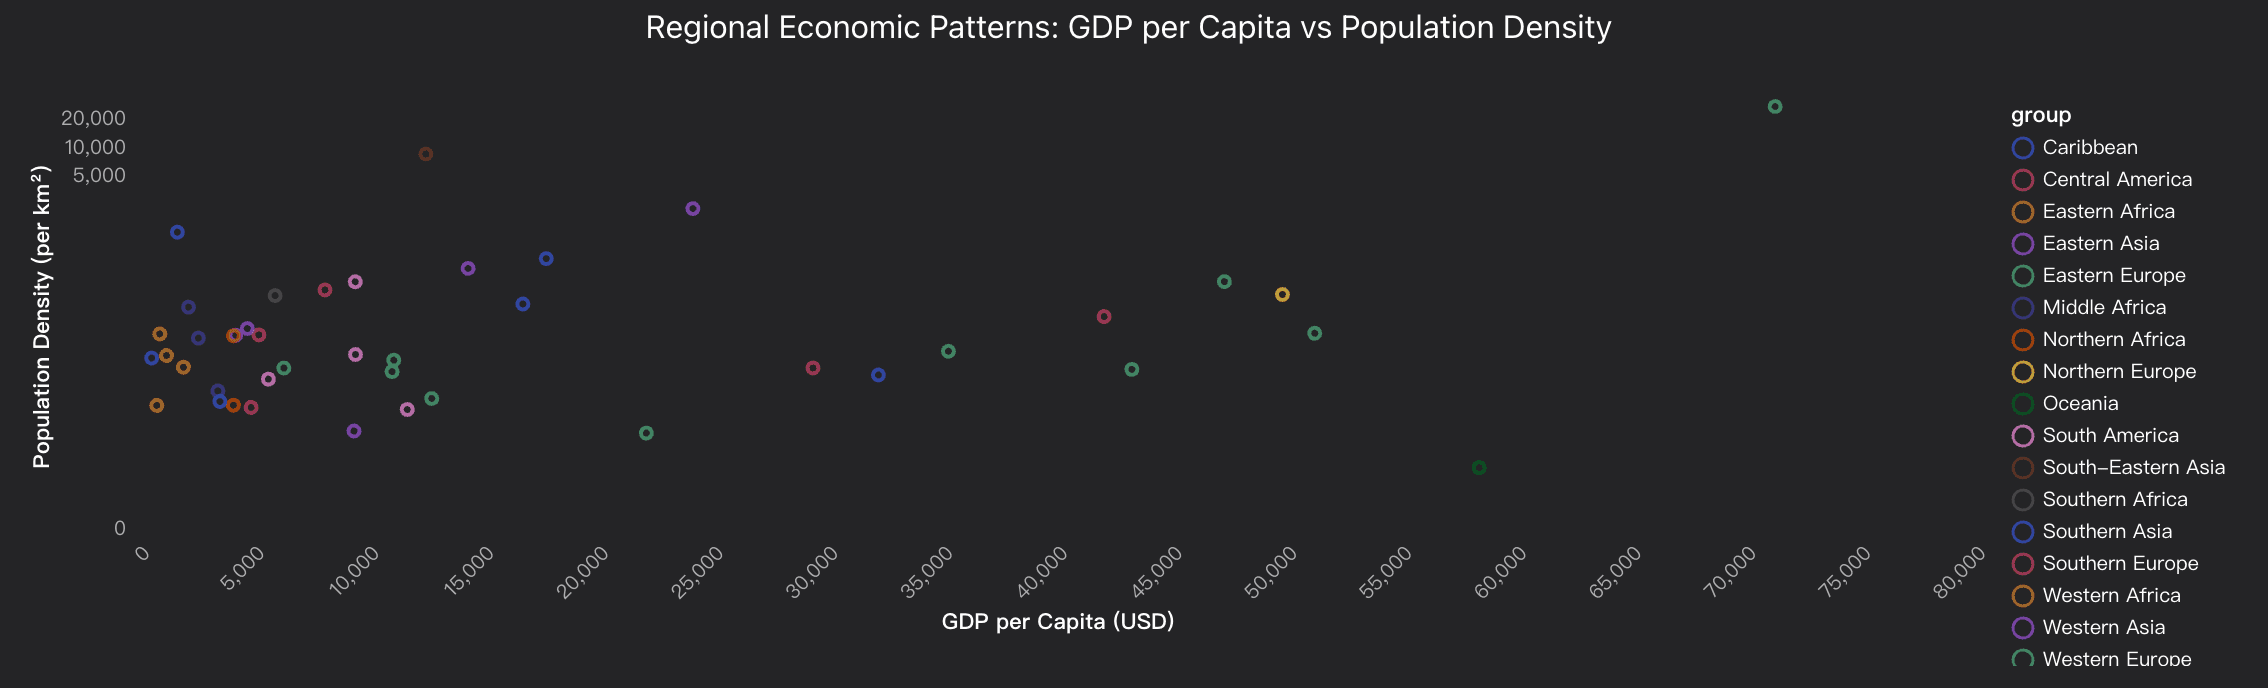
The global economic landscape reveals distinct regional development clusters with significant disparities. Western Europe dominates with the highest average GDP per capita of $81,703, featuring 11 out of 37 high-income countries globally, while Western Africa represents the lowest tier at $1,263 average GDP per capita. The data shows a moderate positive correlation (0.49) between GDP per capita and population density, suggesting population concentration benefits in certain contexts. Lower-Middle income countries represent the largest global segment at 38.7% (79 countries), while high-income countries constitute only 18.1% of the sample. Regional patterns show Western Europe and Northern Europe achieving 66.7-100% high-income classification, contrasting sharply with Sub-Saharan Africa where 81-88% of countries remain in low-income categories. Population density distribution reveals that 47.1% of countries fall in the medium density range (10-100 people/km²), with extreme density variations from 2.1 to 26,374 people per km². The analysis identifies three distinct development clusters: advanced economies (Western Europe, North America, Oceania) with high GDP and varied density, emerging markets (Eastern Europe, parts of Asia) showing middle-income status with moderate density, and developing regions (Sub-Saharan Africa, parts of Asia) characterized by low income despite varying population densities, highlighting that density alone does not guarantee economic success without supporting institutional and infrastructural frameworks.
Data Analysis
Regional Economic Development Tiers
Analysis of economic development levels across global regions using World Bank-aligned GDP per capita classifications (High > $30K, Upper-Middle $10-30K, Lower-Middle $2-10K, Low <$2K) combined with regional clustering patterns to identify distinct economic development zones.
Population Scale and Density Distribution
Examination of population density patterns (Very High >1000, High 100-1000, Medium 10-100, Low <10 people/km?) across regions and their correlation with economic performance, revealing scale effects and urbanization impact on development trajectories.
Regional Development Convergence Patterns
Cross-dimensional analysis of regional economic clustering showing convergence and divergence trends between developed regions (Western Europe, North America, Oceania) and emerging economies, with emphasis on within -region disparities and development gaps.
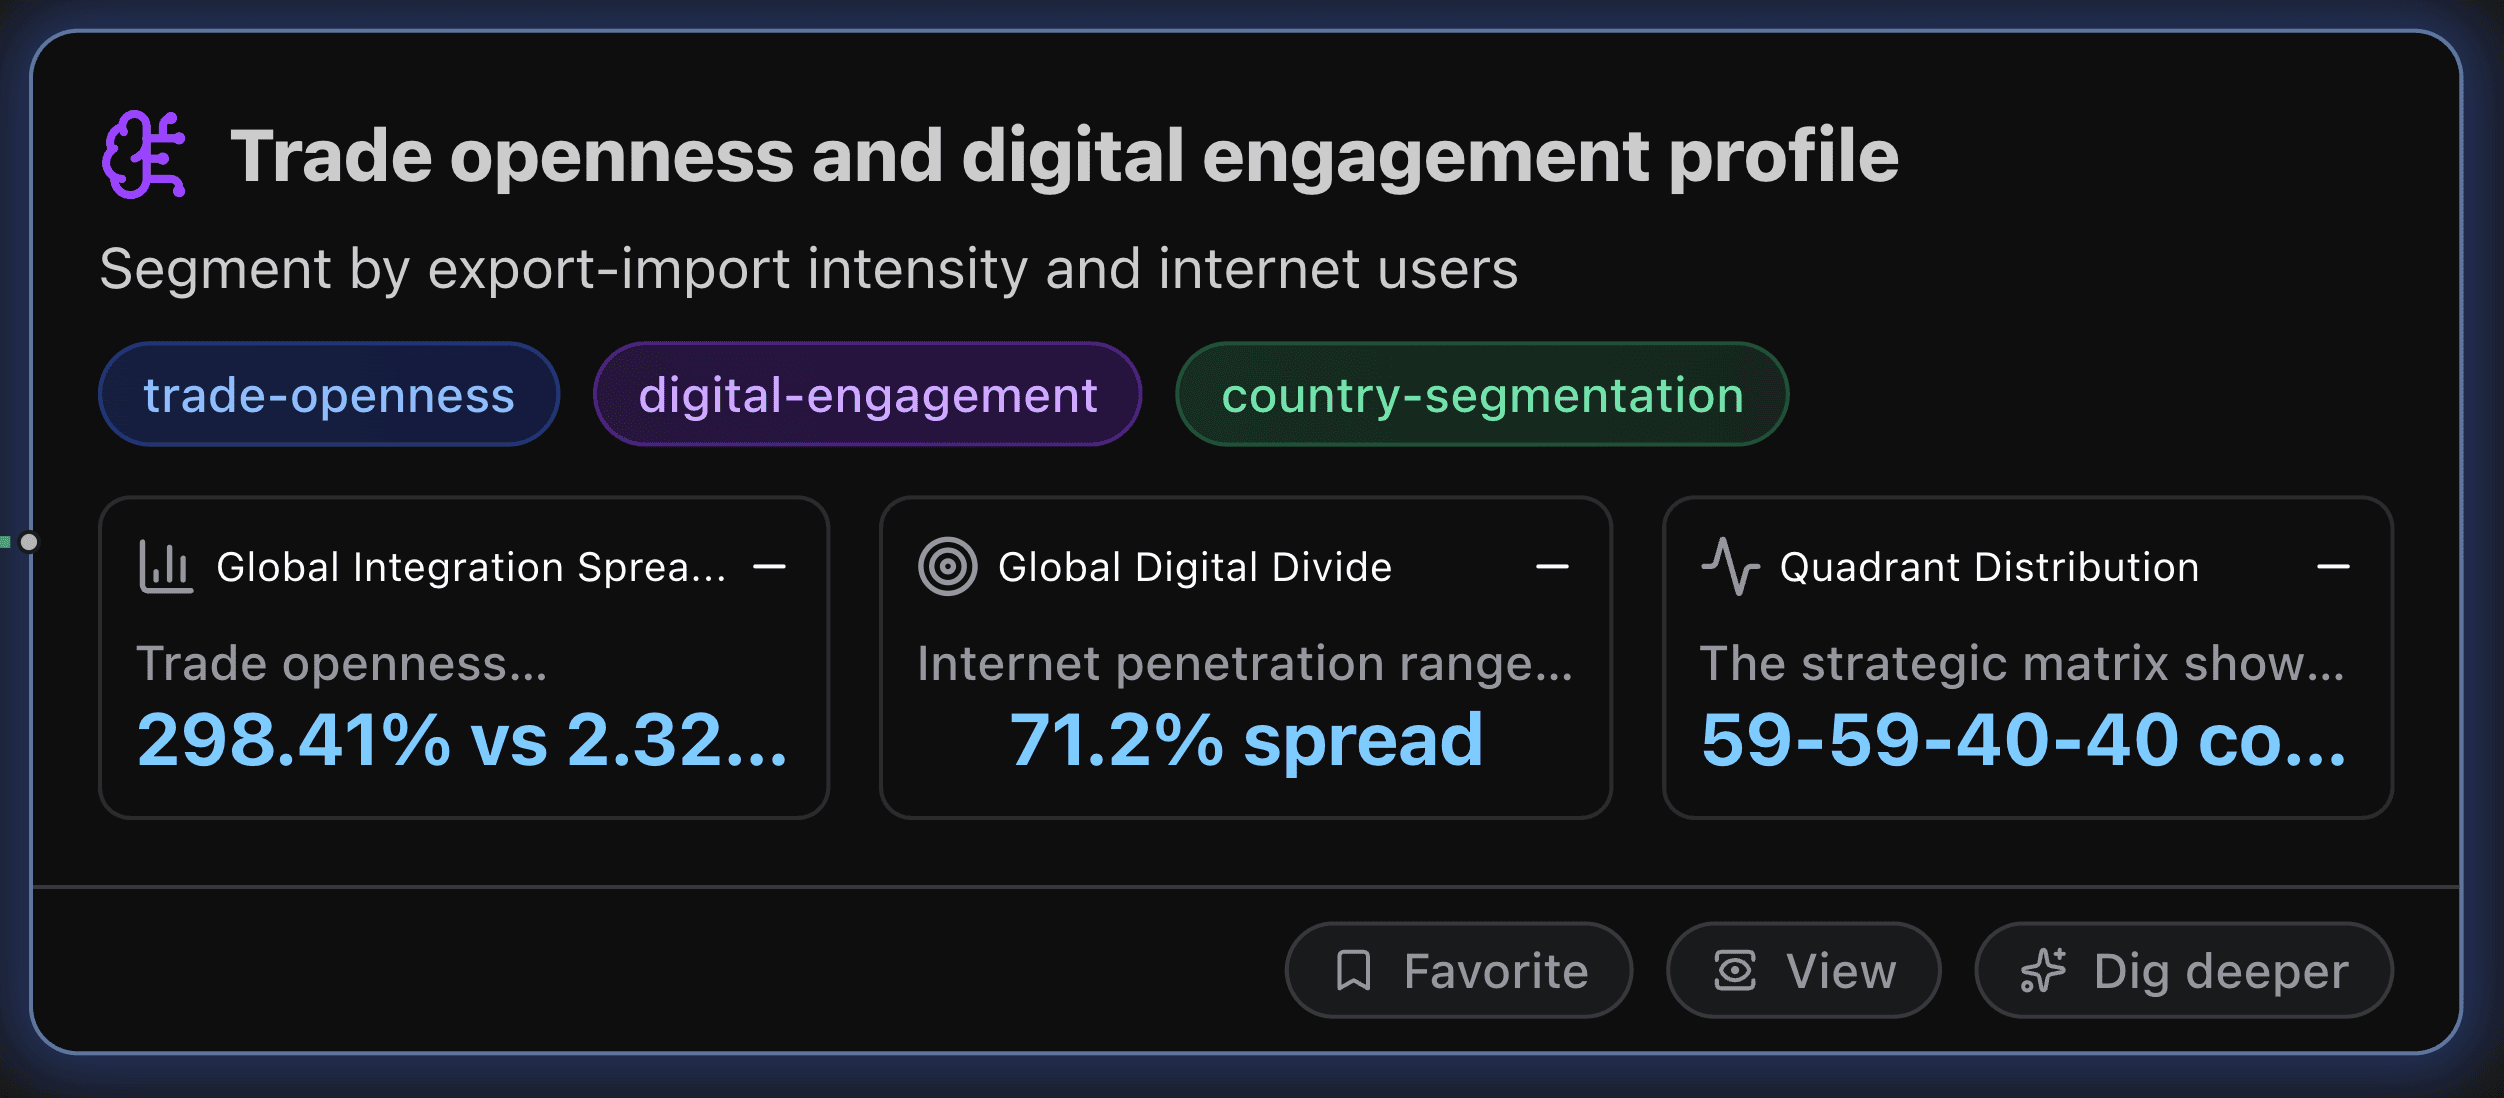
Trade openness and digital engagement profile
Segment by export-import intensity and internet users
Key Metrics
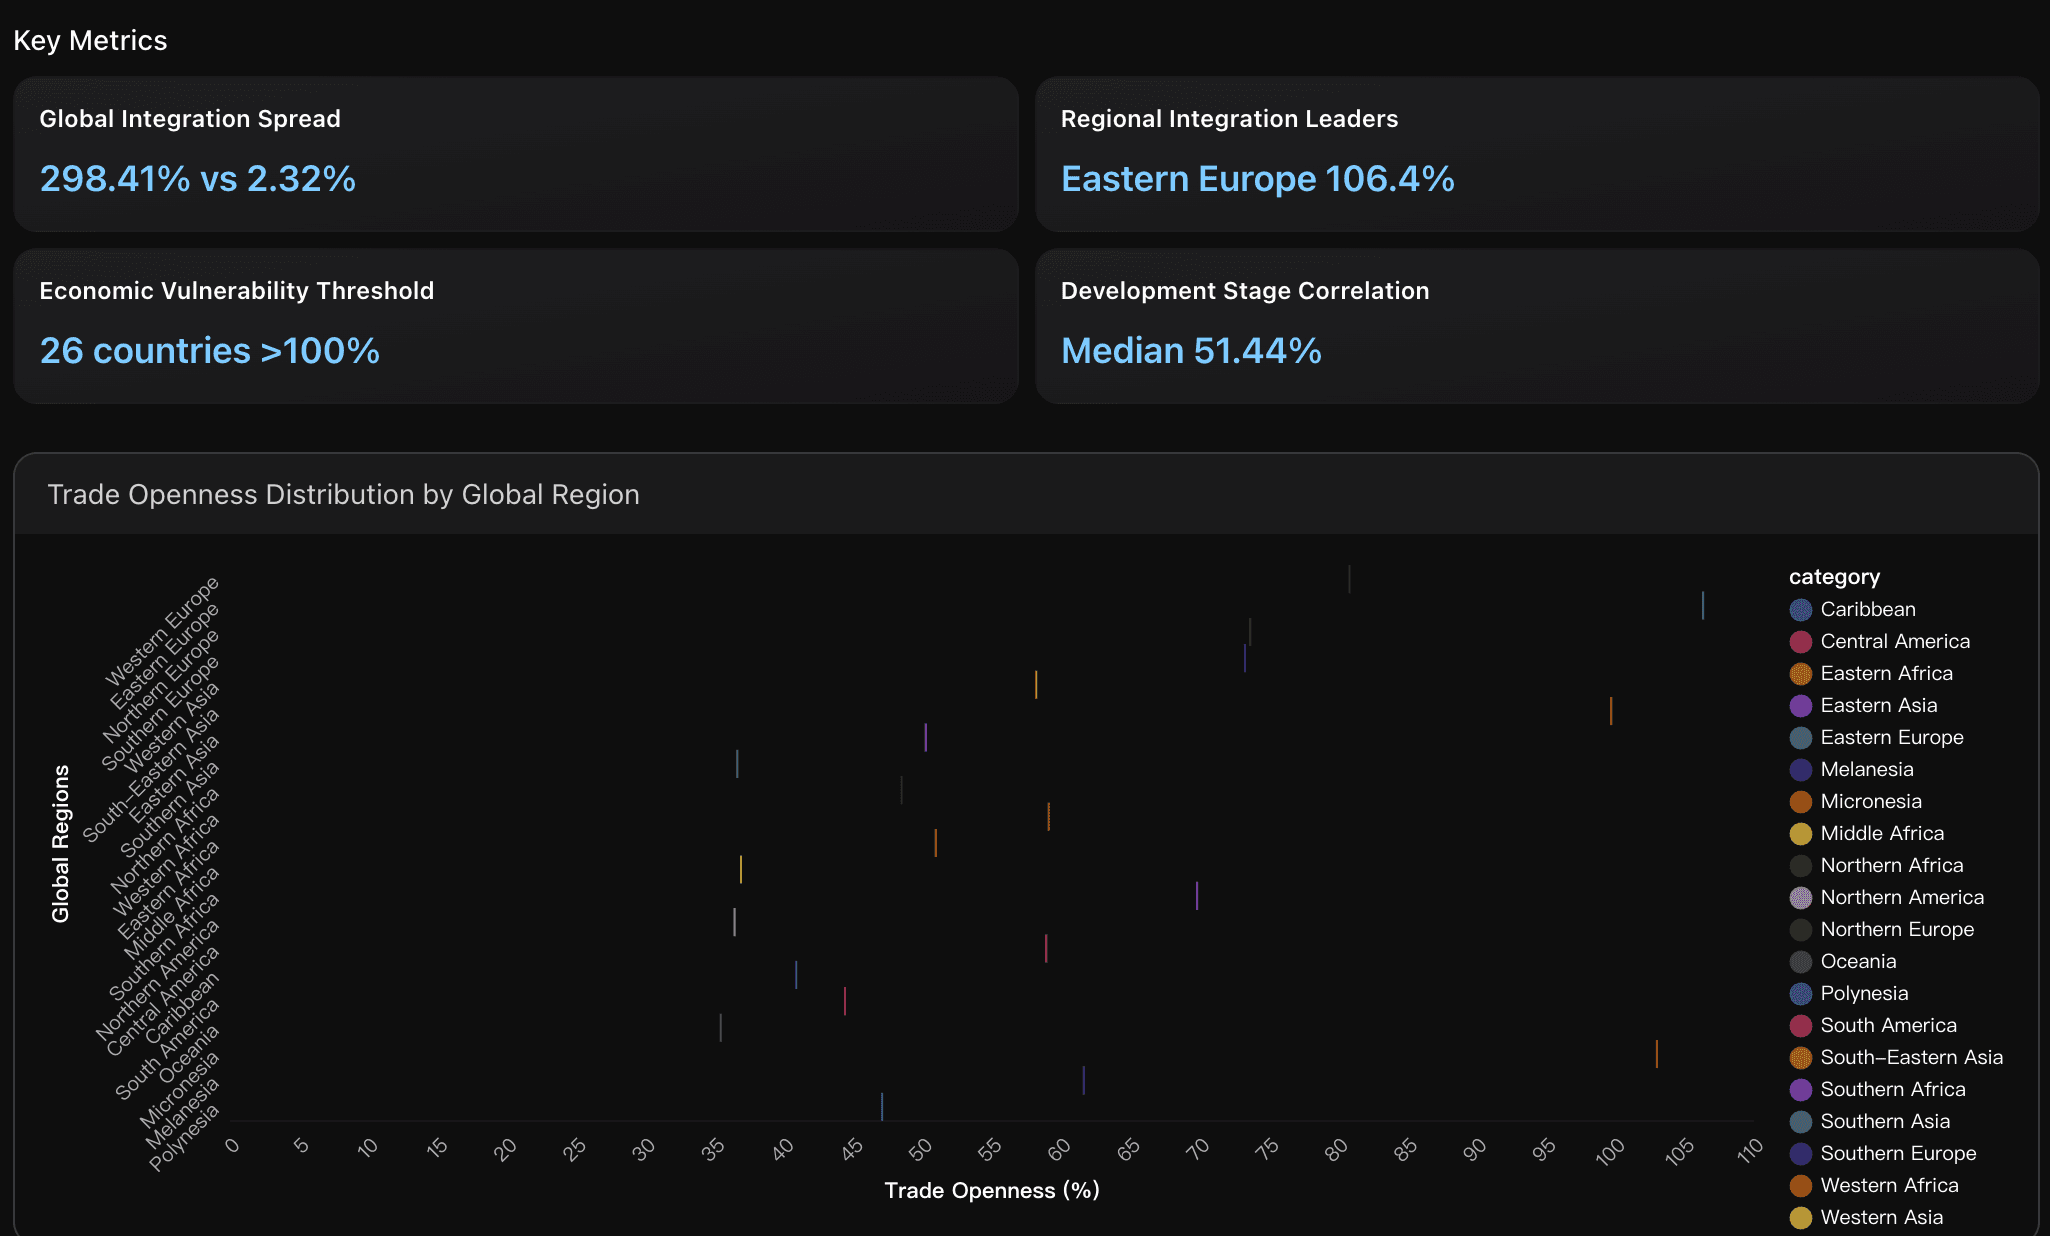
Global Integration Spread
Trade openness demonstrates extreme variation globally, with the highest country (Kiribati at 298.41%) showing nearly 130 times the integration level of the lowest (Sudan at 2.32%). This massive spread reflects fundamental differences in economic structure, with small island states and trade hubs achieving ultra-high openness while large continental economies maintain lower ratios due to substantial domestic markets.
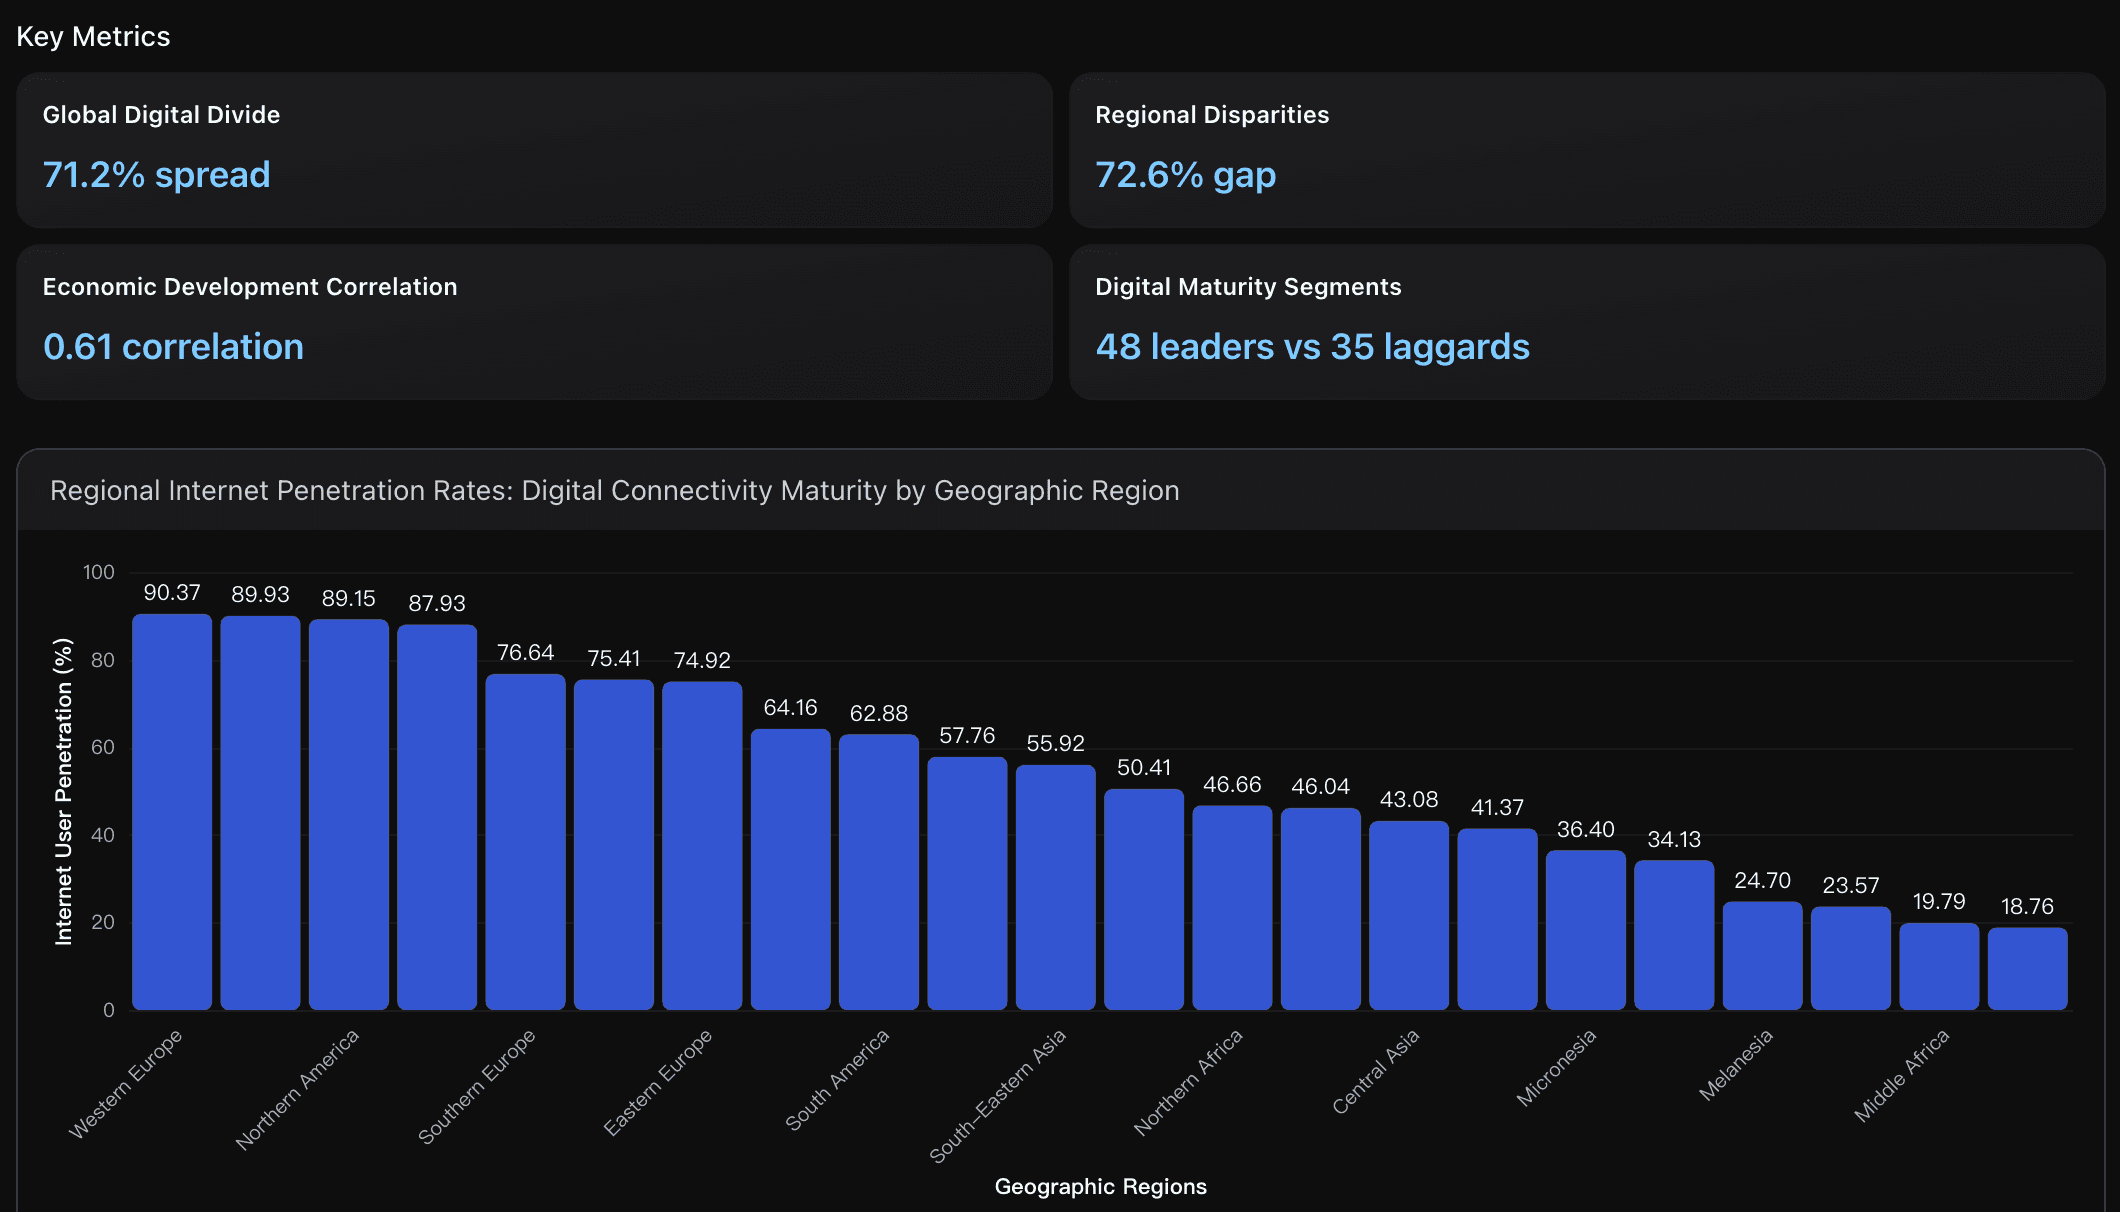
Global Digital Divide
Internet penetration ranges from 0% (North Korea) to 99.7% (Qatar), representing a massive 99.7 percentage point gap in digital access. The global median sits at 58.95%, with 25% of countries below 28.17% and 75% below 79.58%, indicating substantial inequality in digital connectivity across nations and highlighting the persistent digital divide between developed and emerging economies.
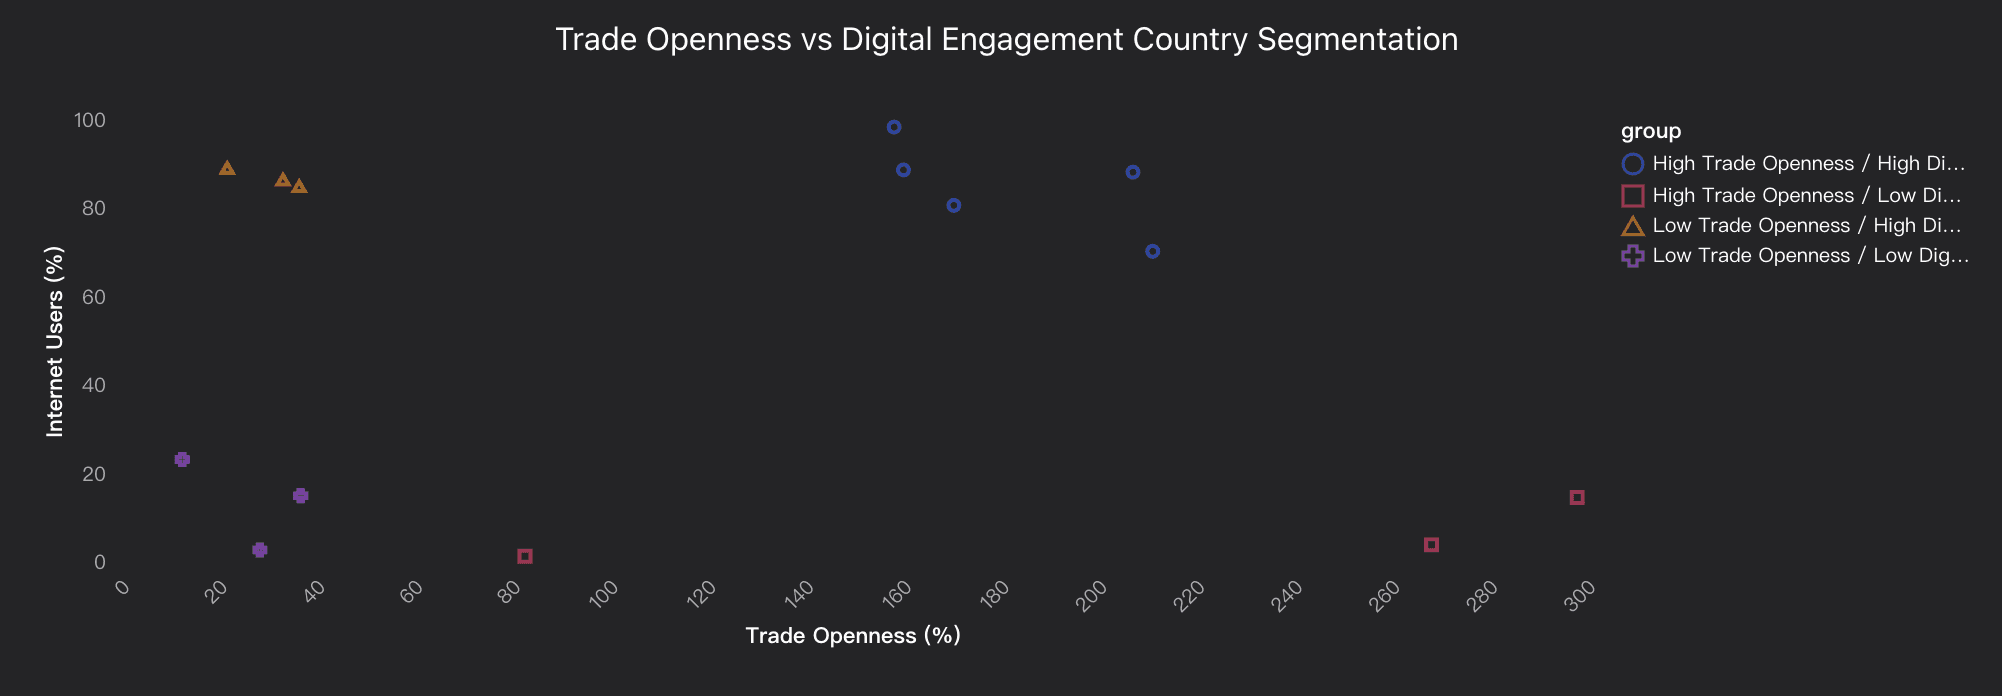
Quadrant Distribution
The strategic matrix shows balanced distribution with High Trade-High Digital and Low Trade-Low Digital segments each containing 59 countries (29.8%), while High Trade-Low Digital and Low Trade-High Digital segments each have 40 countries (20.2%). This symmetric distribution indicates clear polarization between highly integrated economies and developing markets, with moderate-sized intermediate segments representing transitional economies.
Actionable Insights
Focus on Eastern European markets ( 106.4% average openness ) and South-Eastern Asian economies ( 99.77% average openness ) for trade partnerships, as these regions demonstrate the highest economic integration levels globally. For companies seeking market expansion, prioritize countries with moderate trade openness between 40-80% that balance integration with domestic market stability, avoiding ultra-high openness economies ( >150% ) which face greater external vulnerability. Additionally, leverage the fact that 26 countries exceed 100% trade dependency to identify specialized export markets and potential supply chain partners, while recognizing their heightened sensitivity to global trade disruptions.
Prioritize Infrastructure Investment in Lagging Regions : Focus development aid and private investment on the 35 Digital Laggard countries with internet penetration below 20% , particularly in Eastern Africa ( 18.76% ), Middle Africa ( 19.79% ), and Western Africa ( 23.57% ), where the potential for economic impact is highest. The strong 0.61 correlation between internet penetration and GDP per capita indicates that closing the digital divide in these regions could unlock significant economic growth potential and help bridge the 71.2% spread in global connectivity levels
Prioritize digital infrastructure development over broad trade liberalization for countries seeking economic advancement, as the analysis shows digital engagement quadrants achieve $22,344 higher average GDP per capita regardless of trade openness levels. Focus on targeted digital readiness initiatives, particularly for African economies where 22.5% of Western African countries remain in high trade but low digital segments despite trade integration. Countries should aspire to join the 4.5% top performer group by balancing digital capabilities with strategic trade positioning, following successful models like Vietnam which achieved top performance with 70.3% internet penetration and 211.54% trade openness, demonstrating that emerging economies can excel through focused digital transformation rather than attempting broad economic liberalization simultaneously.
Analysis Overview
The global landscape reveals four distinct country archetypes in trade openness and digital engagement. High Trade & High Digital leaders include 54 countries averaging 122.5% trade openness and 81.2% internet penetration, dominated by Western/Northern Europe (22 countries) and South-Eastern Asia (9 countries). Singapore leads with 207.5% trade openness and 88.2% connectivity. High Trade & Low Digital economies show 31 countries with 92.1% trade openness but only 19.8% internet penetration, primarily in Sub-Saharan Africa. Kiribati demonstrates extreme trade dependency at 298.4% despite 14.6% connectivity. Low Trade & High Digital markets represent 8 developed economies including Australia and USA with 34.7% trade openness yet 87.3% digital penetration. Low Trade & Low Digital comprises 56 emerging markets averaging 33.2% trade openness and 26.1% connectivity. Regional disparities are stark: Western Europe achieves 80.9% trade openness and 90.4% connectivity versus Eastern Africa's 51.0% trade and 18.8% digital engagement. The weak 0.17 correlation between trade and digital metrics suggests independent development pathways, enabling targeted policy interventions for dual-track modernization strategies.
Data Analysis
Trade Integration Assessment
Analysis of country trade openness measured as total trade (exports + imports) relative to GDP, revealing economic integration intensity across 199 countries with values ranging from 2.32% to 298.41%, with global median at 51.44%.
Digital Connectivity Maturity
Evaluation of internet user penetration rates across 202 countries, showing digital engagement levels from 0% to 99.7%, with global median at 58.95% and significant regional disparities between developed and emerging economies.
Strategic Positioning Matrix
Four-quadrant segmentation combining trade openness and digital engagement metrics to identify 54 high-performing countries, 31 trade-focused economies, 8 digital leaders, and 56 emerging development markets.

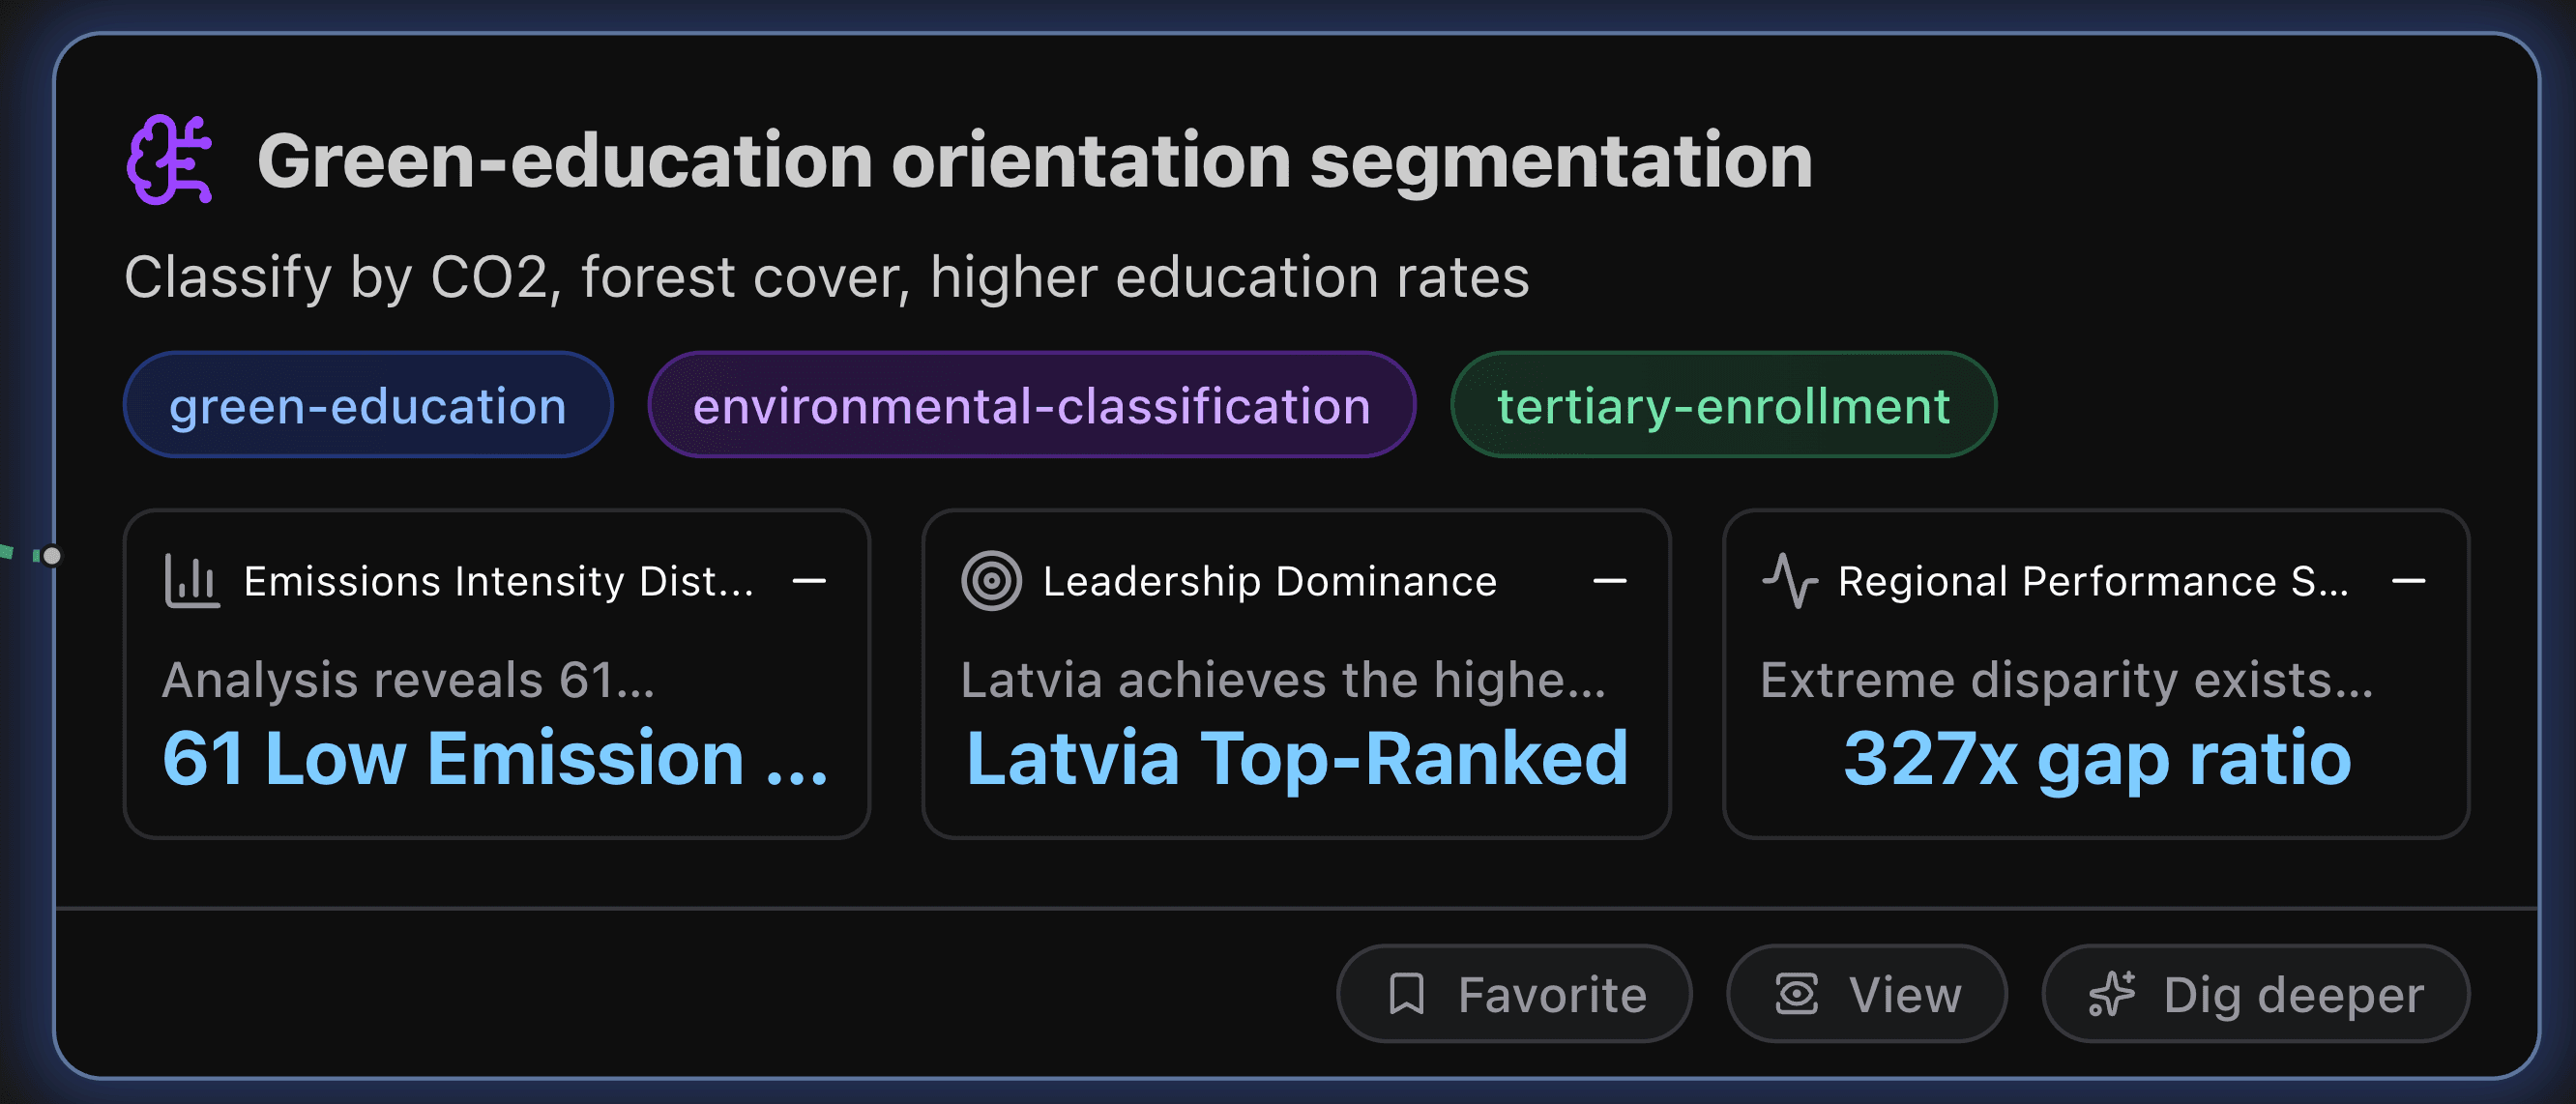
Green-education orientation segmentation
Classify by CO2, forest cover, higher education rates.
Key Metrics
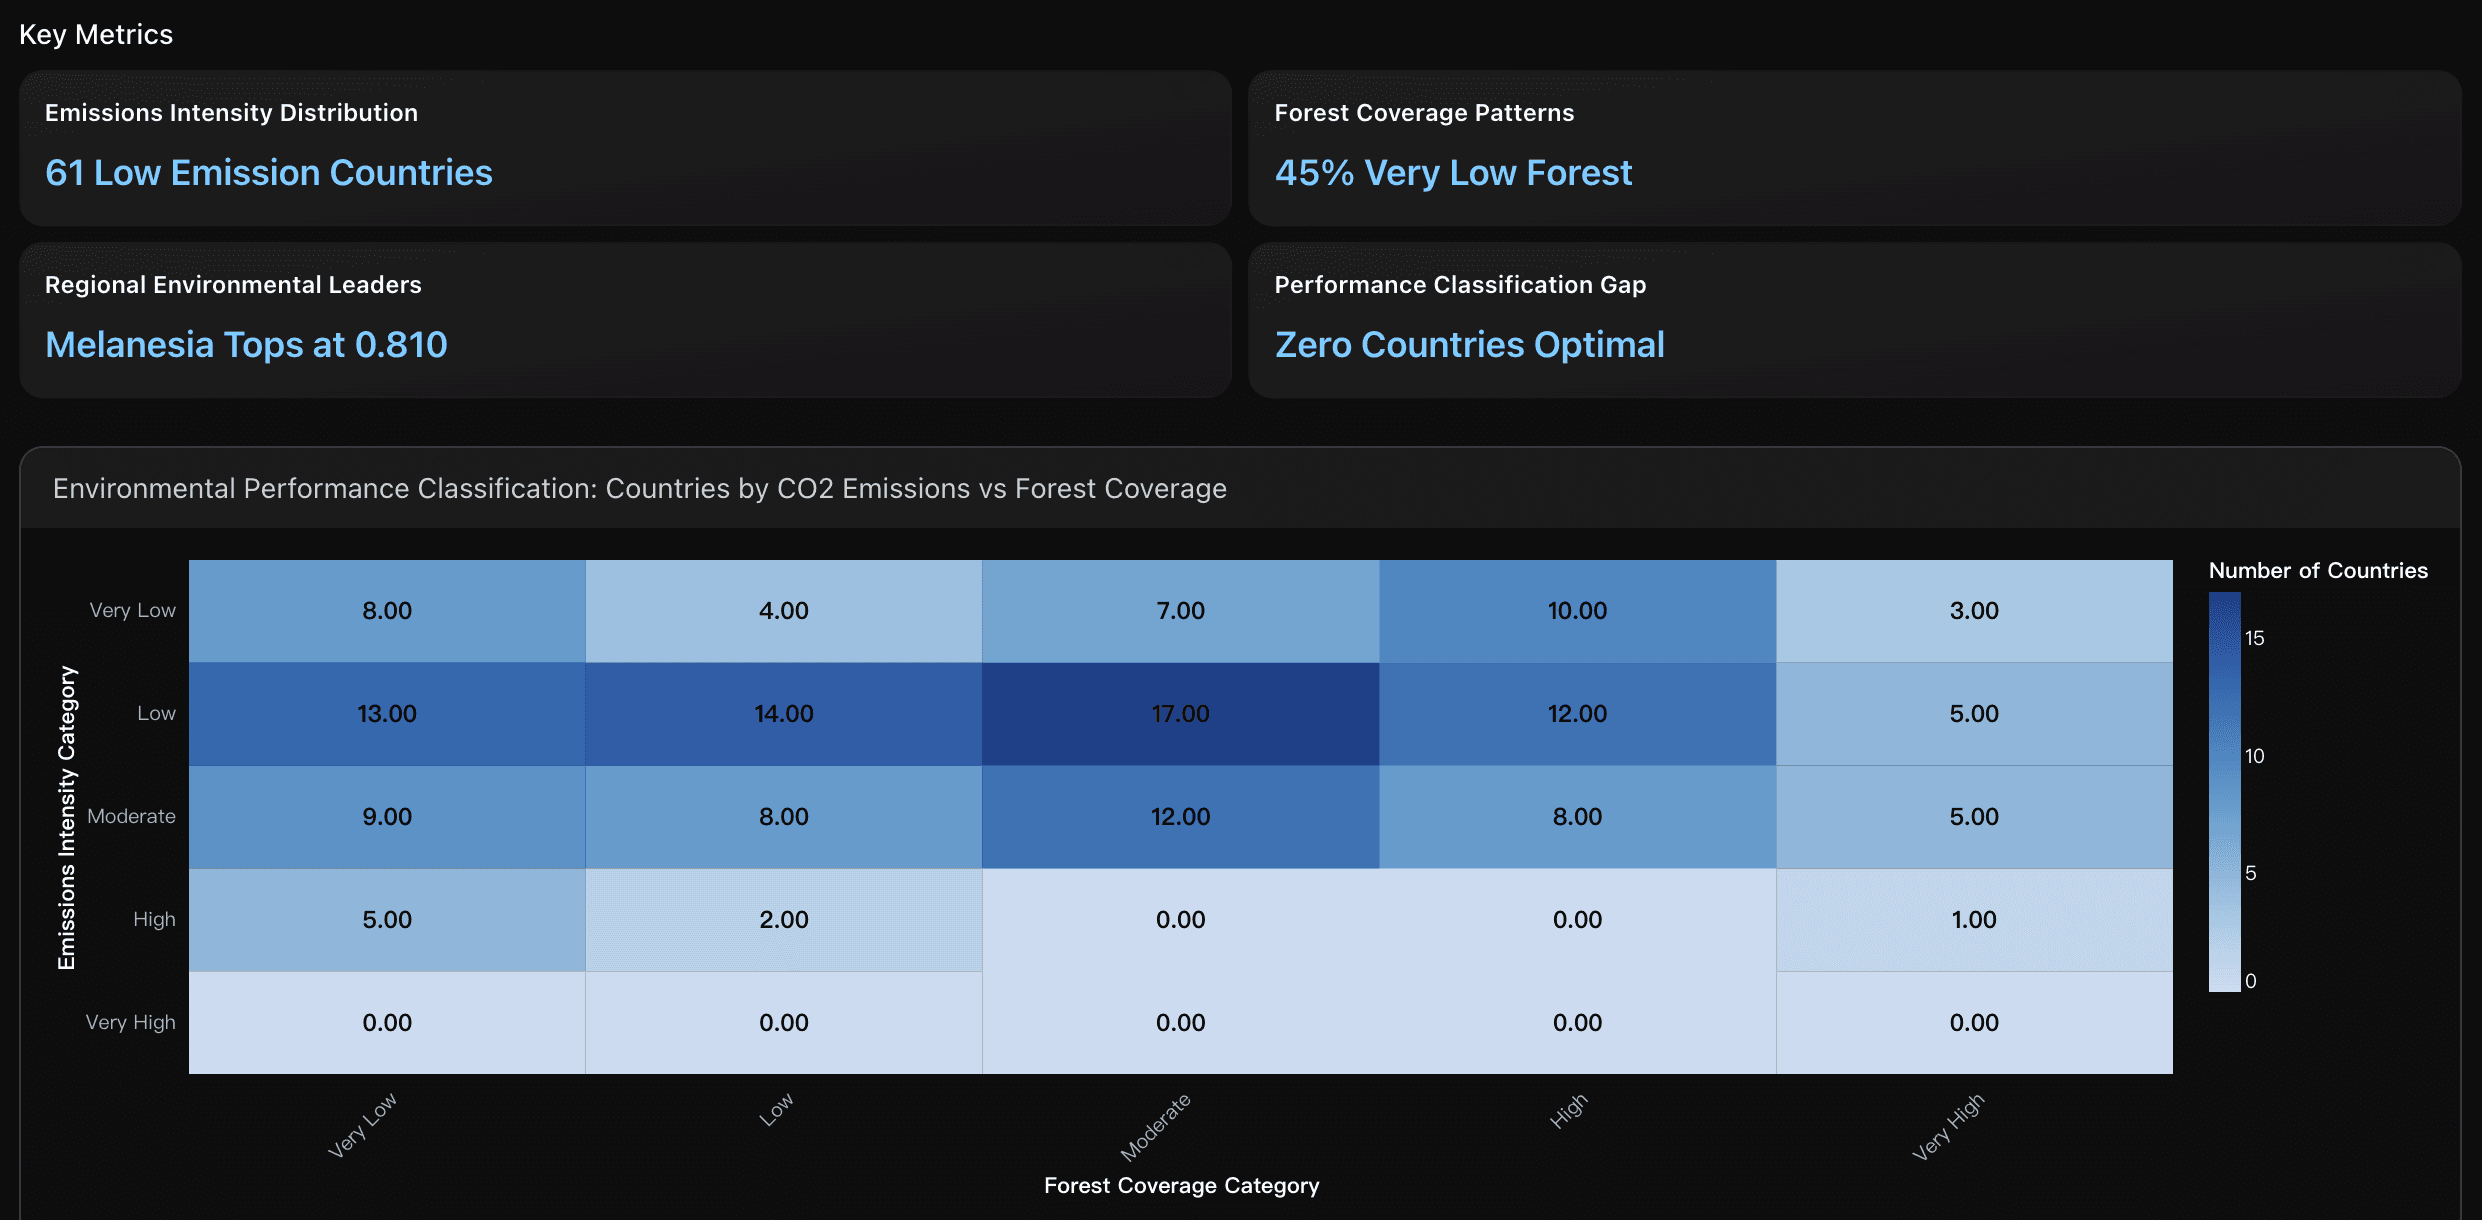
Emissions Intensity Distribution
Analysis reveals 61 countries (42% of total) fall into the Low emissions category (1-5 t CO2/capita), with only 8 countries classified as High emissions (>15 t CO2/capita). This compares favorably to the international 1.5°C climate target requiring emissions below 2.3 t CO2/capita by 2030, indicating most analyzed countries need significant emission reductions to meet climate goals.
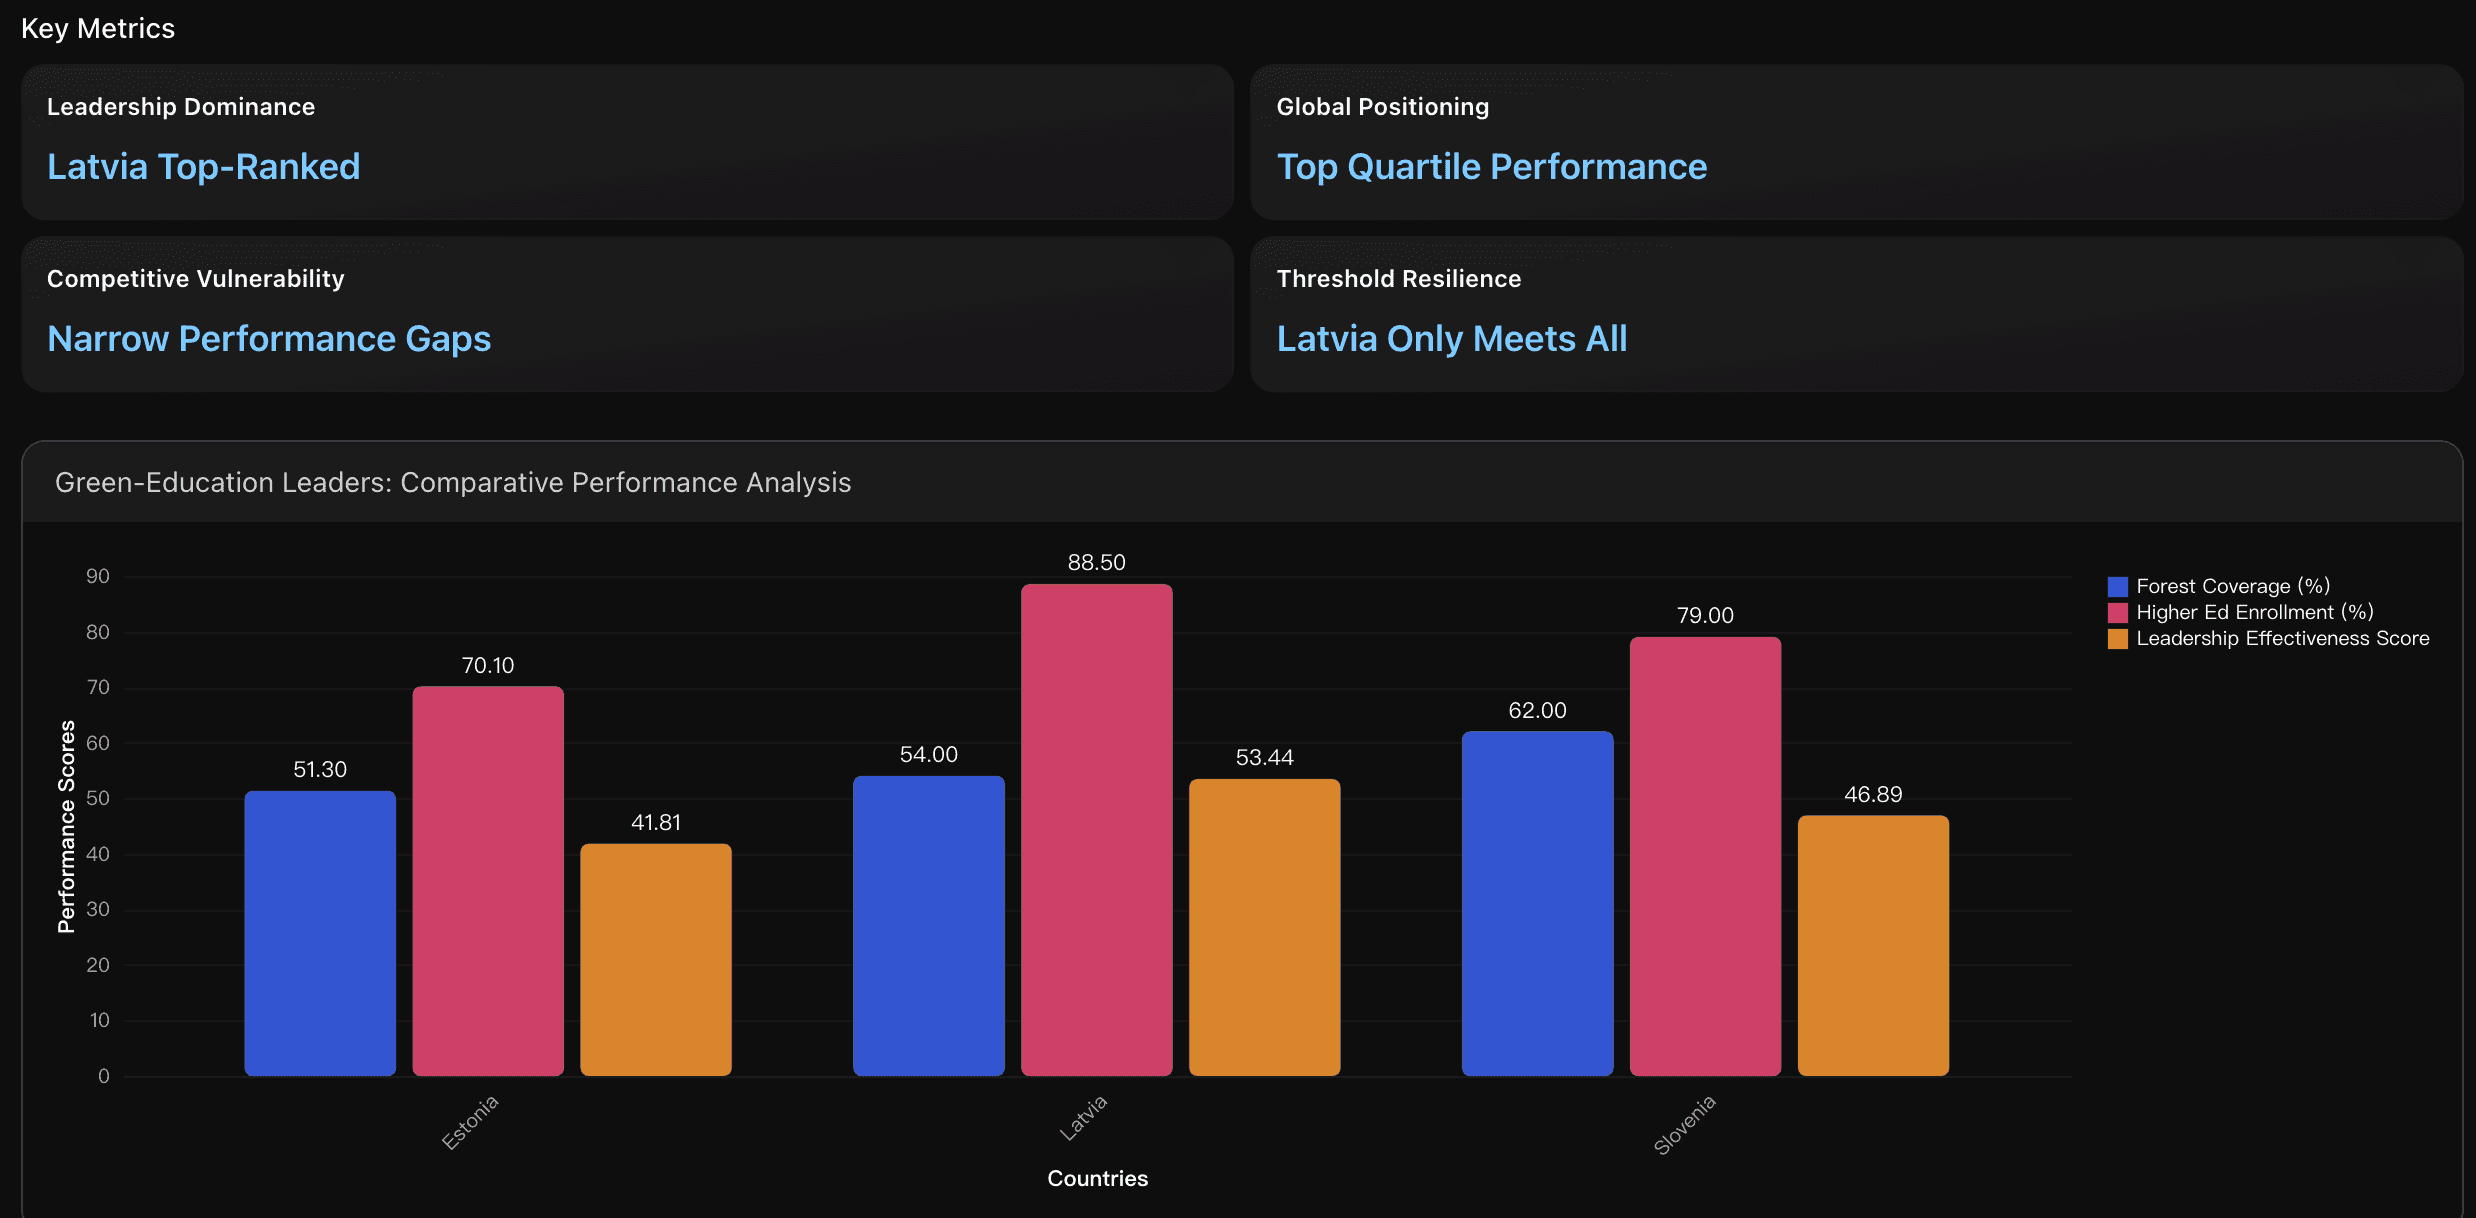
Leadership Dominance
Latvia achieves the highest Leadership Effectiveness Score at 53.44 points, outperforming Slovenia (46.89) and Estonia (41.81) through superior balance across environmental and educational dimensions. Latvia ranks in the 95th percentile globally for female higher education enrollment and 17th percentile for CO2 emissions, meeting all three strict green-education criteria unlike competitors.
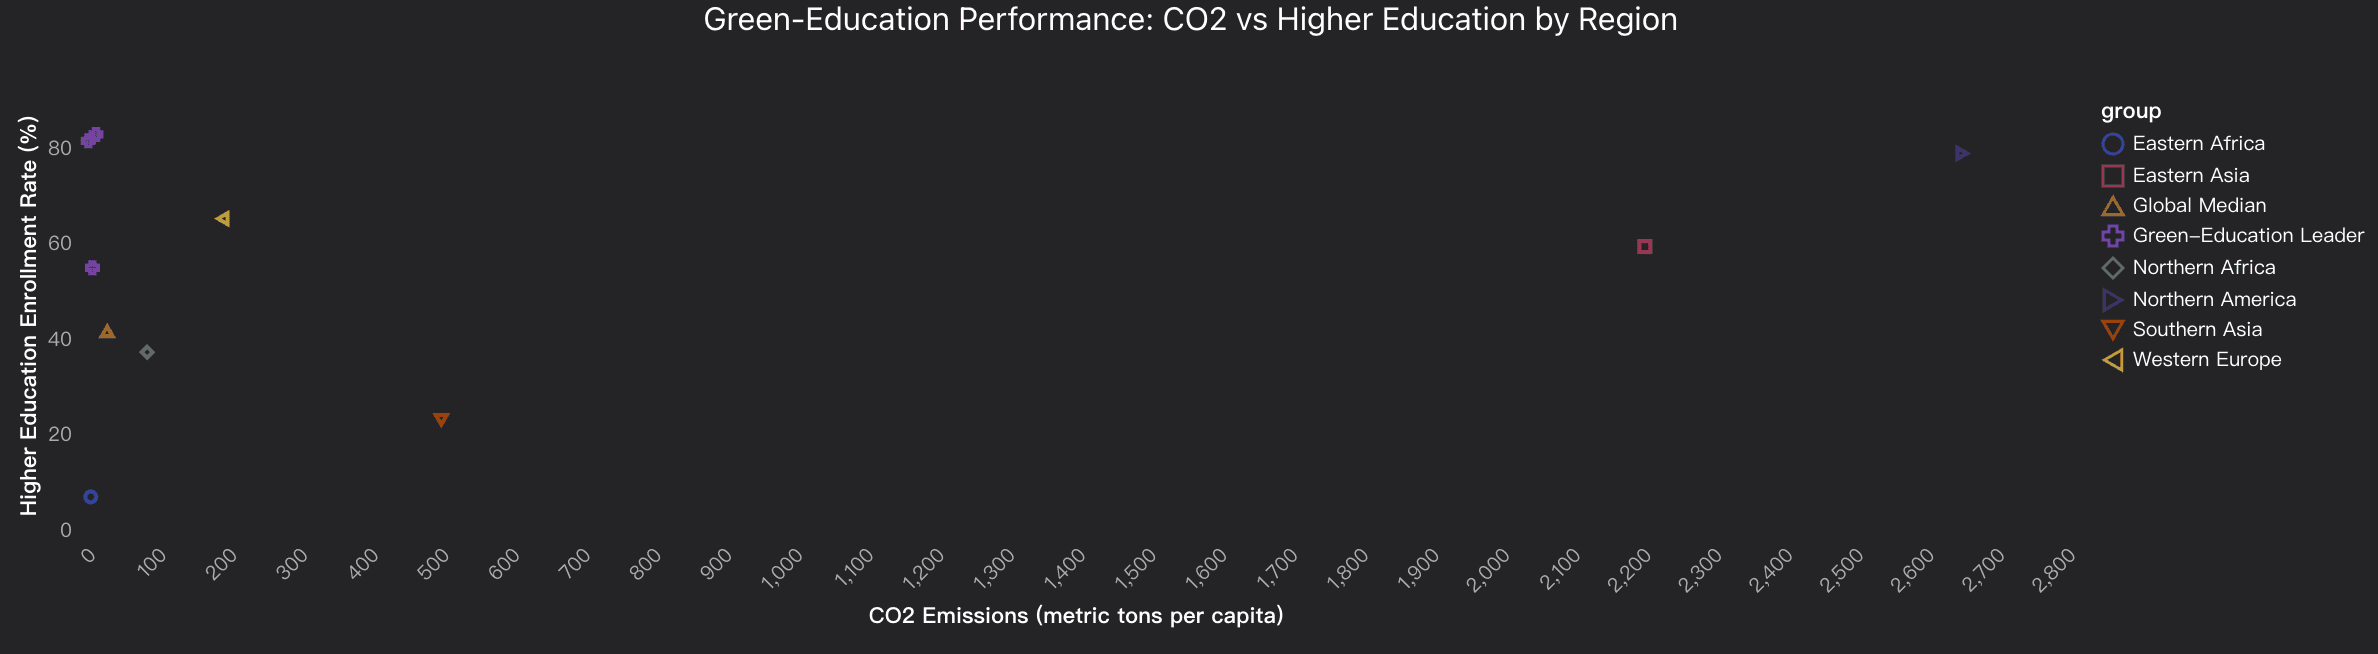
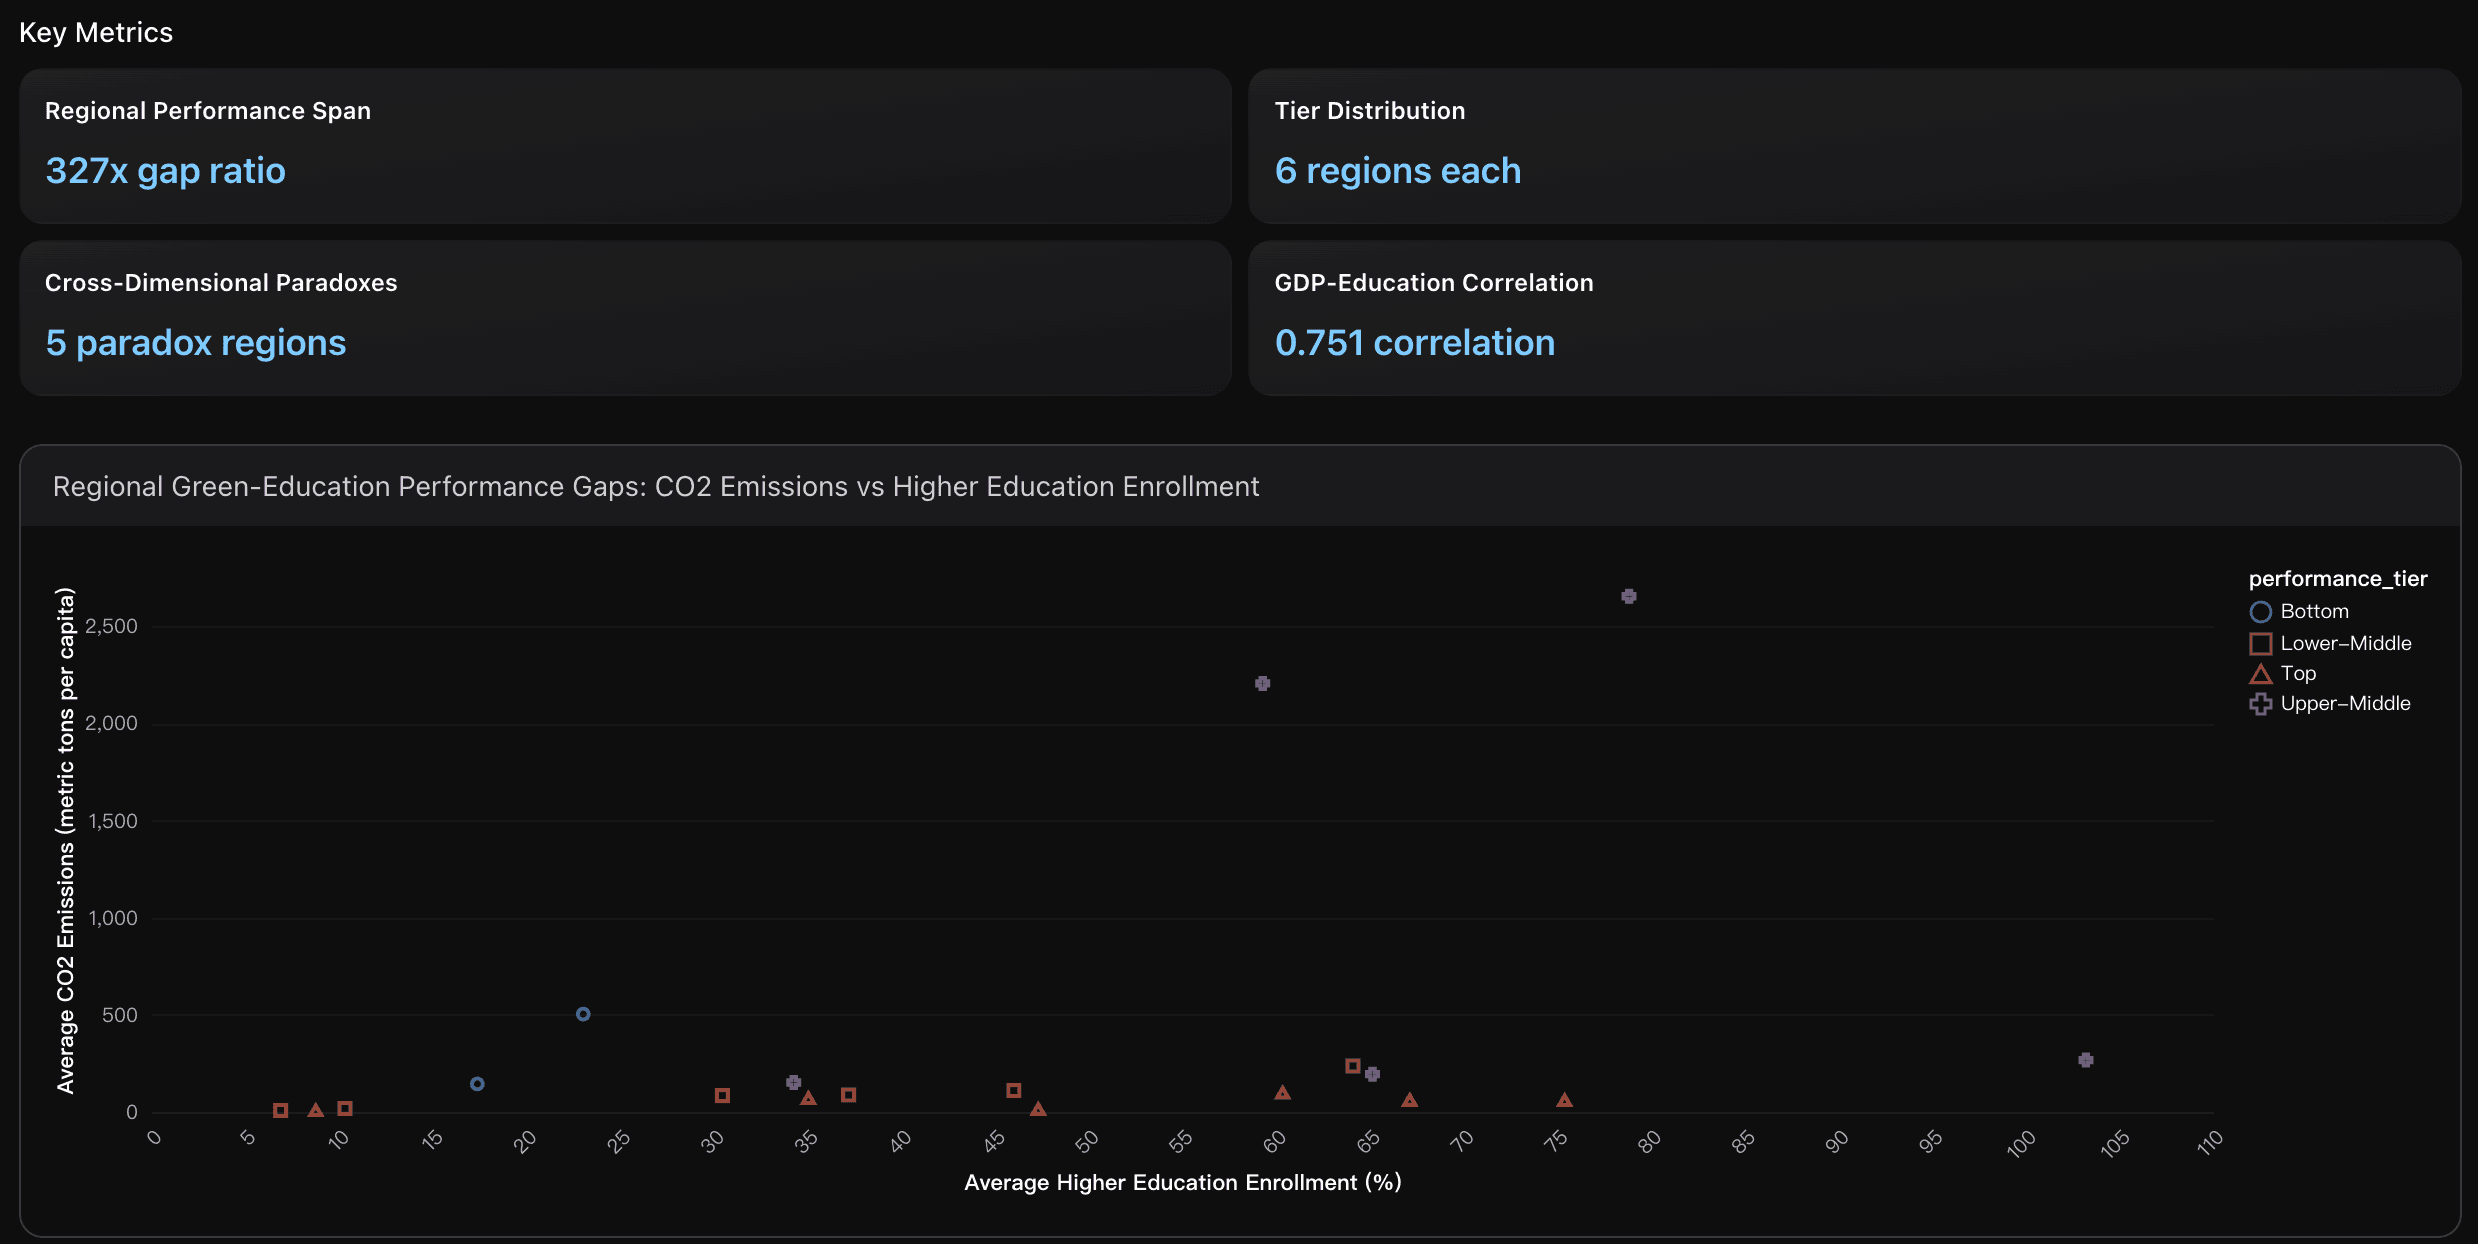
Regional Performance Span
Extreme disparity exists between highest and lowest performing regions in CO2 emissions, with Northern America emitting 327 times more per capita than Eastern Africa. The gap in higher education access shows a 15x difference between Oceania (103.22% enrollment) and Eastern Africa (6.92%). This massive variation reflects fundamental differences in economic development, infrastructure investment, and policy priorities across global regions.
Actionable Insights
Implement targeted environmental improvement strategies based on country classification patterns. Countries with Very Low forest coverage but Low emissions (like those in Northern Africa at 3.52% forest coverage) should prioritize afforestation programs and sustainable land management. High-emission countries such as Qatar ( 27.80 t CO2/capita) require immediate carbon reduction policies including renewable energy transition and industrial efficiency measures. The 17 countries in the Low emissions-Moderate forest category represent the optimal improvement pathway, demonstrating that balanced environmental performance is achievable through integrated climate and conservation policies that address both carbon intensity and ecosystem preservation simultaneously.
Strengthen cross-sectoral integration between environmental and educational policies to maintain competitive leadership positioning. Focus on Latvia's model as the only country meeting all criteria, which integrates sustainability learning from preschool through tertiary education since 2002 while maintaining 54% forest coverage and 88.5% higher education enrollment. Establish monitoring systems to prevent performance erosion, particularly for Estonia and Slovenia whose male higher education enrollment rates of 55.4% and 64.9% fall below the 70% threshold. Implement regional knowledge-sharing mechanisms among the three leaders to defend against competitive threats, as performance gaps with nearest rivals are critically narrow at 0.1-1.7 percentage points for forest coverage and create vulnerability windows for displacement in global rankings.
Implement a tiered regional convergence strategy targeting the massive performance gaps identified. For developed regions showing high education but extreme emissions (Northern America at 2654.55 metric tons , Eastern Asia at 2205.84 metric tons ), prioritize aggressive carbon transition policies with binding emission reduction targets of at least 30-40% by 2030. For developing regions with low education access (Eastern Africa at 6.92% enrollment, Western Africa at 10.35% ), establish regional education hubs modeled after successful programs like the World Bank's African Higher Education Centers of Excellence, aiming to triple enrollment rates to 20-30% within a decade. Most critically, leverage the strong 0.751 correlation between regional GDP and education to break the poverty-education trap through targeted international financing mechanisms, educational technology transfers, and South-South knowledge sharing between balanced performers like Estonia, Latvia, and Slovenia and underperforming regions.
Analysis Overview
The green-education orientation analysis reveals a challenging global landscape where only 3 countries (Estonia, Latvia, Slovenia) achieve excellence across all three critical dimensions of environmental sustainability and educational access. These leaders demonstrate remarkable performance with forest coverage exceeding 50% , tertiary education enrollment rates between 70.1-88.5% (significantly above the 48% OECD average ), and relatively low CO2 emissions of 6.7-16.0 metric tons per capita . Regional disparities are stark, with Northern America and Eastern Asia exhibiting extremely high emissions ( 2654.55 and 2205.84 metric tons respectively) despite strong educational systems, while Eastern Africa struggles with minimal tertiary enrollment at just 6.92% . High-income countries like Qatar show concerning imbalances, combining $68,794 GDP per capita with 0% forest coverage and below-median education access. The analysis identifies clear improvement pathways: resource-rich nations should prioritize environmental restoration and education expansion, while countries strong in two dimensions need targeted interventions in their weak areas. The correlation analysis shows tertiary education strongly linked to GDP per capita ( 0.461 correlation ), while environmental indicators show weaker economic associations, suggesting environmental policy requires dedicated focus beyond economic development.
Data Analysis
Environmental Performance Classification
Analysis of CO2 emissions intensity and forest coverage patterns across 204 countries, revealing strong regional variations with Eastern Asia and Northern America showing highest emissions ( 2205.84 metric tons and 2654.55 metric tons respectively) while maintaining moderate-to-high forest coverage and education levels.
Green-Education Leadership Analysis
Identification and benchmarking of countries achieving optimal balance across environmental and educational indicators, with only 3 countries (Estonia, Latvia, Slovenia) meeting strict criteria for low CO2 emissions, high forest coverage (>50%), and high tertiary education enrollment (>70%).
Regional Performance Gap Assessment
Comparative analysis of 22 global regions showing significant disparities, with Northern Europe and Western Europe leading in balanced performance while Eastern Africa lags with 6.92% tertiarv enrollment and Southern Asia faces emissions challenges at 503.93 metric tons per capita.
Conclusion
The data doesn’t lie — the world remains deeply divided across economics, technology, and sustainability. From the widening gap between high-income regions and emerging economies, to the staggering digital inequality that still limits opportunity for billions, this analysis made one thing clear: understanding global development requires more than static charts — it needs intelligent, context-aware analysis.
That’s exactly what Powerdrill Bloom delivers. By transforming complex Kaggle data into interactive, AI-driven insights, Bloom makes it effortless to uncover the patterns behind global progress and disparity.
If you’re ready to explore your own data, try Powerdrill Bloom and see how AI can turn numbers into knowledge — and insights into action.


