Data Facts of E-commerce Winter Jacket Sales
Ma Li
Oct 28, 2024

This report is powered by Powerdrill—an AI-driven data analysis tool designed to boost your productivity.
Try its one-click report generation today at https://powerdrill.ai.
About the dataset
This dataset contains information on 2000 winter jackets scraped from eBay in 2024.
The distribution of jacket types in the dataset, and the most common type

Analysis of Jacket Types
Jacket: The most common type with a count of 1244.
Coat: The second most common type with a count of 422.
Vest: Occurs 93 times in the dataset.
Blazer: Has a count of 47.
Waistcoat: The least common among the top five, with a count of 12.
Visualization of Distribution
Bar Chart: The chart clearly shows that "Jacket" is the most frequent type, significantly higher than other types.
Other Types: "Coat" and "Vest" also have notable frequencies, but much lower than "Jacket".
Conclusion and Insights
Most Common Type: "Jacket" is the most prevalent type in the dataset.
Diversity: There is a wide variety of jacket types, but the distribution is heavily skewed towards a few types, particularly "Jacket".
Trends and noticeable patterns in jacket availability over time

Data Analysis
Mean Availability: The average number of jackets available per year is 407.75, with a significant standard deviation of 807.51, indicating variability in availability.
Yearly Availability: The availability ranges from a minimum of 1 jacket in 2021 to a maximum of 1619 jackets in 2024.
Visual Analysis
Trend Over Time: The line chart shows a dramatic increase in jacket availability from 2023 to 2024, with relatively low availability in previous years.
Pattern: There is a sharp upward trend starting in 2023, suggesting a significant change in inventory or supply chain dynamics.
Conclusion and Insights
Increasing Trend: Jacket availability has increased sharply, especially from 2023 to 2024.
Potential Factors: This trend may be due to changes in production, demand, or inventory management strategies. Further investigation into these factors could provide more insights.
Price range differences among jacket types

Price Range Analysis
Minimum Price: The average minimum price across jacket types is approximately $93.49, with a wide range from $0.95 to $956.00.
Maximum Price: The average maximum price is about $133.02, ranging from $4.99 to $956.00.
Sample Data: For example, the "3 Piece Rain Suit" has both a minimum and maximum price of $14.99, while the "Blazer" ranges from $0.95 to $548.00.
Visual Representation
Price Variation: The bar chart shows significant variation in price ranges across different jacket types. Some types, like "Biker Jacket, Flight Jacket, Coat, Outwear," have a wide price range, while others, like "3 Piece Rain Suit," have a narrow range.
High Price Types: Certain types, such as "tweed Vest / Waistcoat," exhibit higher maximum prices, indicating a potential for premium pricing.
Conclusion and Insights
Diverse Pricing: Jacket types exhibit diverse pricing structures, with some types having a consistent price range and others showing significant variability.
Market Segmentation: The variation in price ranges suggests different market segments, with some jackets catering to budget-conscious consumers and others targeting premium buyers.
Analysis of jacket price distribution to identify trends and outliers by brand, material, and type
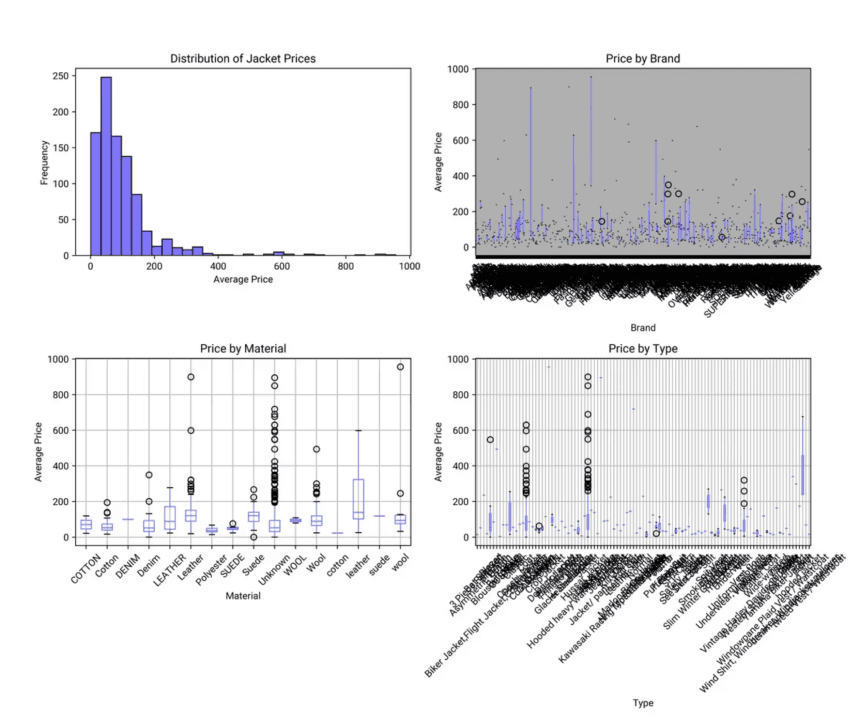
Distribution of Jacket Prices
Skewed Distribution: The histogram shows a right-skewed distribution, with most jacket prices concentrated below $200. This indicates that lower-priced jackets are more common.
Presence of Outliers: There are several outliers with prices extending beyond $600, suggesting that certain factors may contribute to these higher prices.
Factors Influencing Jacket Prices
Brand Influence
Wide Variation: The scatter plot of prices by brand shows significant variation, with some brands having higher average prices. This suggests that brand reputation or exclusivity might influence pricing.
Material Influence
Material Impact: Box plots indicate that jackets made from materials like leather and wool tend to have higher average prices, with more outliers. This suggests that material quality or type significantly affects pricing.
Type of Jacket
Type Variation: Different types of jackets, such as blazers or coats, show varied pricing. Some types have more outliers, indicating that specific styles or functionalities might drive higher prices.
Conclusion and Insights
Outlier Explanation: The presence of outliers in jacket prices can be attributed to factors such as brand prestige, material quality, and jacket type. These elements contribute to the higher pricing of certain jackets.
Market Segmentation: Understanding these factors can help in market segmentation and targeting specific consumer groups based on their preferences for brand, material, or jacket type.
Correlation analysis between jacket price and sales volume per listing

Dataset Overview
Price Statistics: The average price of jackets is approximately $90.83, with a wide range from $0.95 to $956.00.
Sold Count Statistics: The average number of jackets sold per listing is 13.36, with a range from 0 to 917.
Correlation Analysis
Correlation Coefficient: The correlation between price and sold count is -0.08, indicating a very weak negative relationship.
Visualization Insights
Scatter Plot Observations: The scatter plot shows a concentration of data points at lower price ranges with varying sold counts. There is no clear trend of higher prices leading to fewer sales.
Conclusion and Insights
Weak Negative Correlation: The correlation coefficient suggests that there is a very weak negative relationship between price and sales, meaning higher prices slightly correlate with fewer sales, but the effect is minimal.
No Strong Trend: The scatter plot supports the correlation analysis, showing no strong trend or pattern between price and sales. Most sales occur at lower price points, but variability is high.
Frequency of jacket listing updates by item location

Update Frequency Analysis
Uniform Update Count: Each location has an update count of 1, indicating that listings are updated once per location.
Average Update Frequency: The average time between updates varies significantly, with a mean of 1.76 days and a maximum of 13 days.
Visualization Insights
Variation Across Locations: The bar chart shows considerable variation in the average update frequency across different locations. Some locations have much higher frequencies, indicating more frequent updates.
Conclusion and Insights
Consistent Update Count: Listings are updated once per location, but the time between updates varies.
Location-Specific Trends: Certain locations experience more frequent updates, suggesting regional differences in listing activity.
Temporal availability and seasonal patterns in jacket listings

Aggregate Data Analysis
Yearly Range: The data spans from 2022 to 2024, with an average year of 2023.42.
Monthly Distribution: The months range from January (1) to December (12), with a mean month of 6.63.
Availability Stats: The average availability of jackets is 3.15, with a standard deviation of 2.07, indicating variability in availability.
Visual Trends
Fluctuations: The availability of jackets shows fluctuations throughout the year, with noticeable peaks and troughs.
Peak Availability: There is a significant increase in availability around July and November.
Low Availability: Availability drops notably around April and September.
Conclusion and Insights
Seasonal Patterns: There are clear seasonal patterns, with higher availability in mid-year and towards the end of the year.
Strategic Planning: Understanding these patterns can help in inventory management and marketing strategies to align with periods of higher demand.