
Explore detailed statistics from the ICC Men's T20 World Cup 2024, held in the West Indies and USA. This comprehensive dataset includes information on the teams with the best win percentages, the top wicket-takers, and the leading run-scorers, providing valuable insights into the tournament's standout performances.
source: kaggle
Given the dataset, Powerdrill detects and analyzes the metadata, then gives these relevant inquiries:
Dataset 1: Team - Best Win Percentage
Descriptive Statistics
Summary statistics for win percentages.
Trend Analysis
Historical trends in win percentages over time.
Comparative Analysis
Comparison of win percentages between different teams.
Dataset 2: Player Bowling Stats - Most Wickets
Descriptive Statistics
Summary statistics for wickets taken.
Performance Analysis
Identification of the top wicket-takers.
Trend Analysis
Trends in the number of wickets taken over time.
Dataset 3: Player Batting Stats - Most Runs
Descriptive Statistics
Summary statistics for runs scored.
Performance Analysis
Identification of the top run-scorers.
Trend Analysis
Trends in runs scored over time.
Combined Analyses
Correlation Analysis
Relationship between team win percentage and key player performance (runs scored and wickets taken).
Comparative Analysis
Comparison of team win percentages with the performance of key players (top run-scorers and wicket-takers).
Performance Impact Analysis
Identification of key players whose performance significantly impacts team win percentage.
Dataset 1: Team - Best Win Percentage
Descriptive Statistics for Win Percentages
Mean Win %: 52.47
Median Win %: 50.00
Mode Win %: 50.00
Range of Win %: 75 (from 25 to 100)
Standard Deviation: 22.57
Variance: Not explicitly provided, but can be calculated as
Trend Analysis of Win Percentages
Count of Data Points: 15
Mean Win %: 52.47
Standard Deviation: 22.57
Minimum Win %: 25
25th Percentile: 33.33
Median (50th Percentile): 50
75th Percentile: 66.97
Maximum Win %: 100
Observation: The distribution of win percentages shows a wide range from 25% to 100%, with a significant standard deviation indicating variability in team performances over time.
Comparative Analysis of Win Percentages by Team
Teams Analyzed: Afghanistan, Australia, Bangladesh, Canada, England, etc.
Range of Average Win %: From 25% (minimum) to 100% (maximum)
Highlighted Teams:
Afghanistan: 62.5%
Australia: 71.43%
Bangladesh: 42.86%
Canada: 33.33%
England: 50%
Observation: Australia shows a high average win percentage, indicating strong performance, whereas Canada has a lower average, suggesting less success in matches.
Summary
The analysis provides a comprehensive overview of win percentages, showing variability across teams and over time. Australia emerges as a strong performer, while teams like Canada might need strategies to improve their win rates. The trend analysis indicates that while some teams consistently perform well, others show significant fluctuations, highlighting the dynamic nature of competitive performance.
Dataset 2: Player Bowling Stats - Most Wickets
Descriptive Statistics for Player Bowling Stats
Count: All players have played 15 matches.
Mean Wickets: The average number of wickets taken by players is approximately 13.27, with a standard deviation of 2.09, indicating a moderate variation in wickets taken across players.
Median Wickets: The median number of wickets taken is consistently around 14.93 across different statistical measures.
Range of Wickets: Players have taken between 11 and 17 wickets.
Overs Bowled: On average, players have bowled about 26.26 overs, with the maximum being 35 overs and the minimum at 16.50 overs.
Top Wicket-Takers
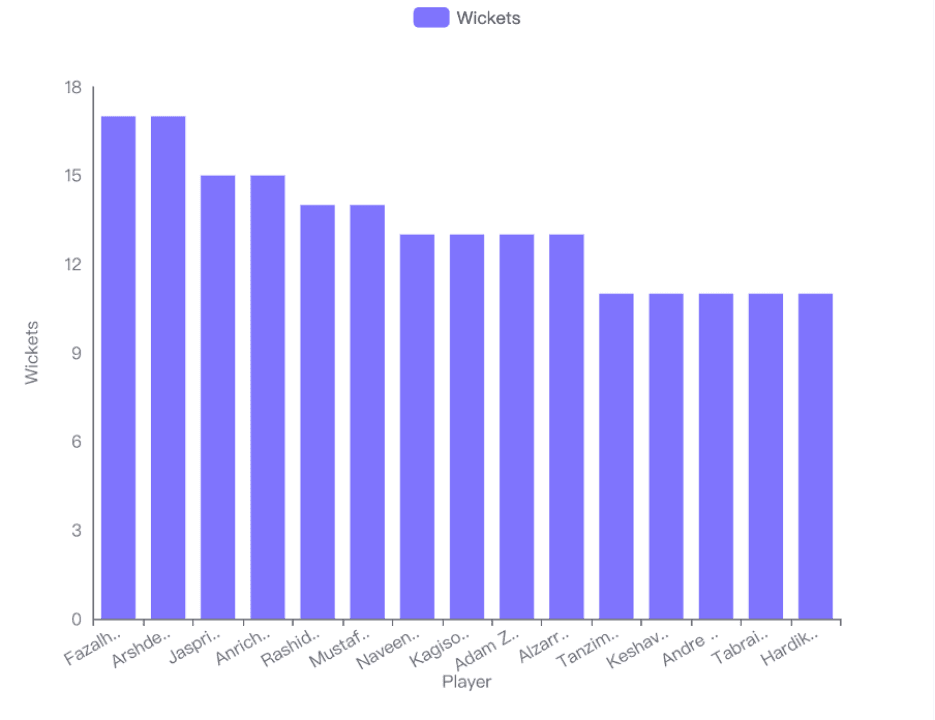
Leading Players: Fazalhaq FAROOQI and Arshdeep SINGH are the top wicket-takers, each securing 17 wickets.
Performance by Country: Players from AFGHANISTAN and INDIA appear prominently at the top of the list, indicating strong bowling performances from these countries.
Trends in Wickets Over Time
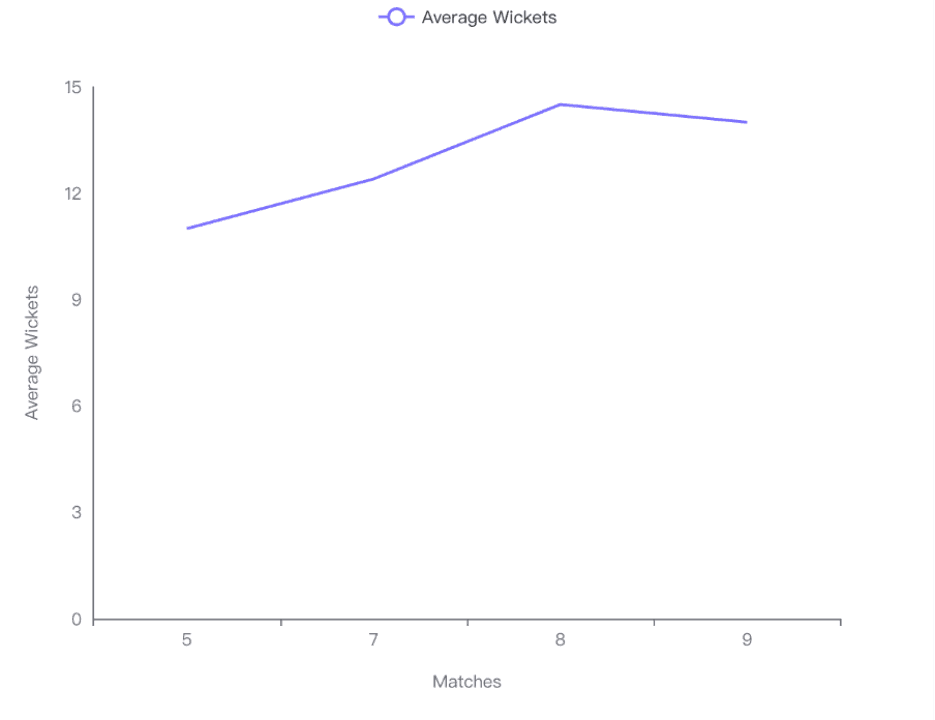
Increase in Wickets with More Matches: There is a clear upward trend in the average number of wickets taken as the number of matches increases. Players tend to take more wickets as they play more matches.
Peak Performance: The peak average wickets of 14.5 are observed at 8 matches, slightly decreasing to 14 wickets by the 9th match.
Visual Analysis
Bar Chart Analysis: The bar chart visually confirms that Fazalhaq FAROOQI and Arshdeep SINGH lead in wickets taken, with a noticeable distribution among other players.
Line Chart Analysis: The line chart effectively illustrates the increasing trend of wickets with the number of matches played, highlighting a peak before a slight drop as players approach 9 matches.
Overall, the analysis of player bowling stats reveals significant insights into player performances, trends over time, and comparative achievements among top wicket-takers. This comprehensive overview assists in understanding key aspects of bowling efficacy in cricket.
Dataset 3: Player Batting Stats - Most Runs
Descriptive Statistics for Player Batting Stats
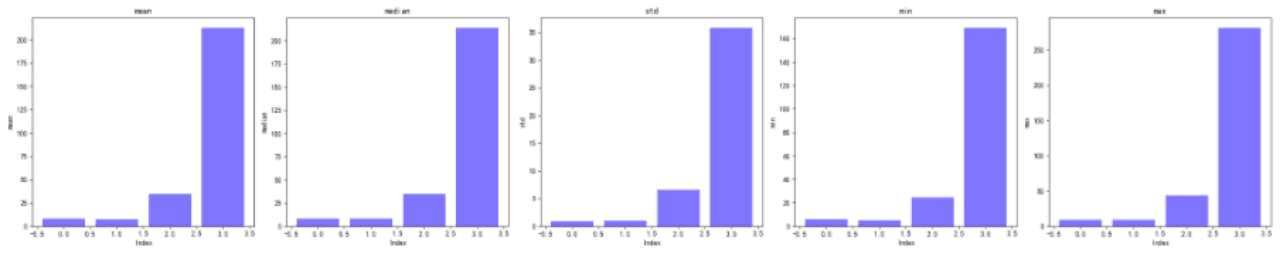
Mean Values:
Matches: 7.8
Innings: 7.4
Batting Average: 34.46
Runs: 212.8
Median Values:
Matches: 8
Innings: 8
Batting Average: 35.12
Runs: 214
Standard Deviation:
Matches: 0.86
Innings: 0.99
Batting Average: 6.57
Runs: 35.88
Minimum Values:
Matches: 6
Innings: 5
Batting Average: 24.42
Runs: 169
Maximum Values:
Matches: 9
Innings: 9
Batting Average: 43.8
Runs: 281
Top Run-Scorers Analysis
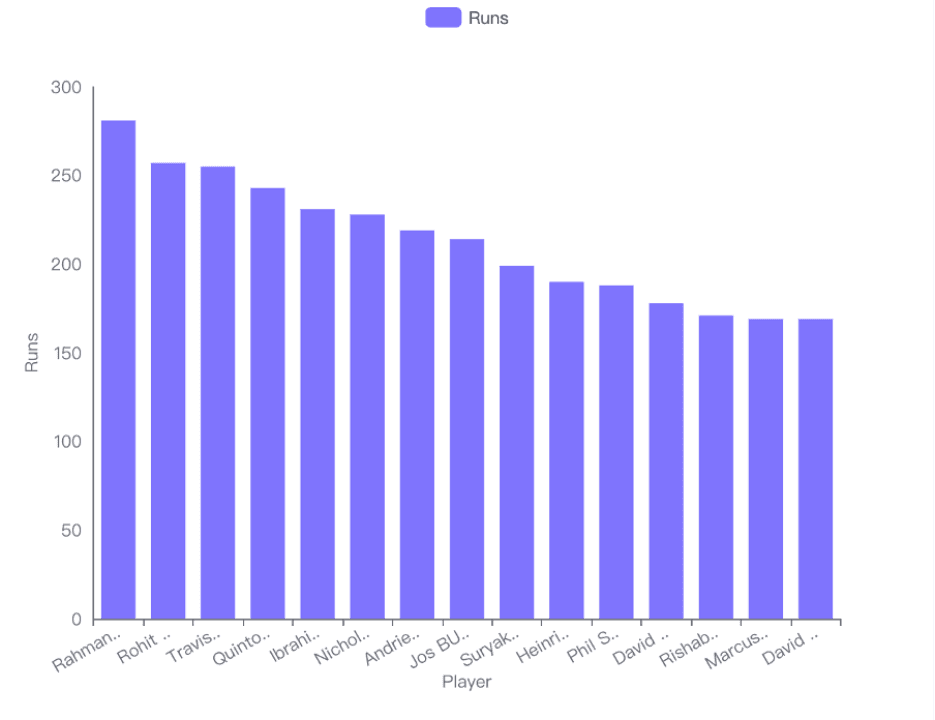
Top Players by Runs:
Rahmanullah GURBAZ (AFGHANISTAN) - 281 Runs
Rohit SHARMA (INDIA) - 257 Runs
Travis HEAD (AUSTRALIA) - 255 Runs
Quinton DE KOCK (SOUTH AFRICA) - 243 Runs
Ibrahim ZADRAN (AFGHANISTAN) - 231 Runs
Trend Analysis of Runs Scored Over Time
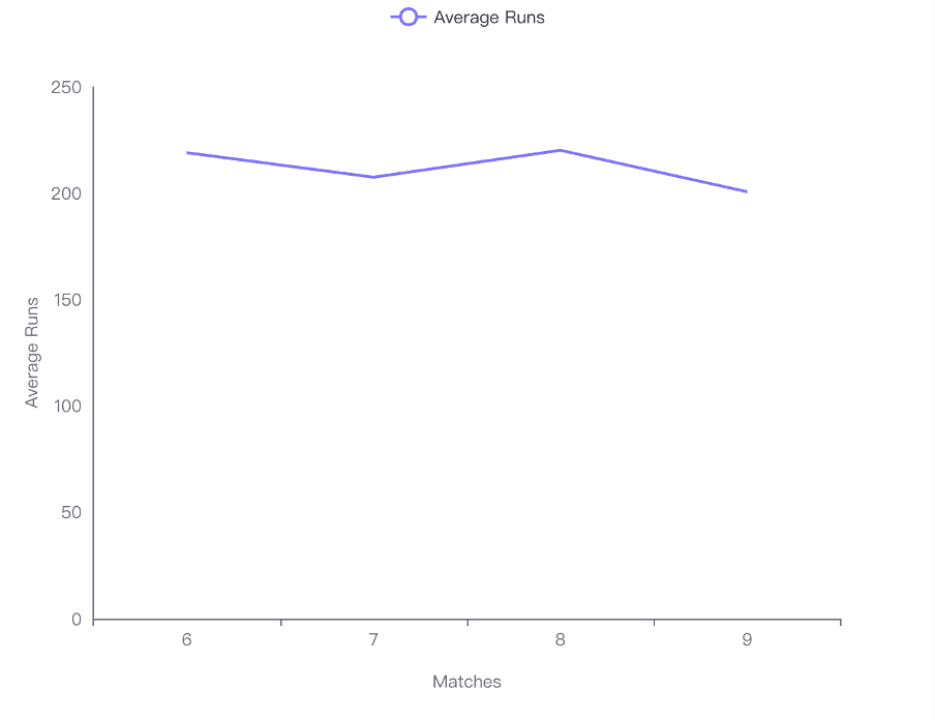
Trend Observation:
A fluctuating trend in average runs scored as the number of matches increases.
Peak average runs at 8 matches (220.143 runs), with a decline at 9 matches (200.667 runs).
Visualizations
Descriptive Statistics Bar Charts: Displayed the distribution of mean, median, standard deviation, minimum, and maximum values for Matches, Innings, Bat Avg, and Runs.
Top Run-Scorers Bar Chart: Illustrated the runs scored by each top player, highlighting the highest scorers.
Runs Trend Line Chart: Showed the relationship between the number of matches played and the average runs scored, indicating a non-linear trend.
Overall, the analysis provides a comprehensive overview of player performances in terms of batting statistics, identifying key performers and analyzing trends in run scoring relative to the number of matches played.
Combined Analyses
Correlation Analysis Between Team Win Percentage and Player Performance Metrics
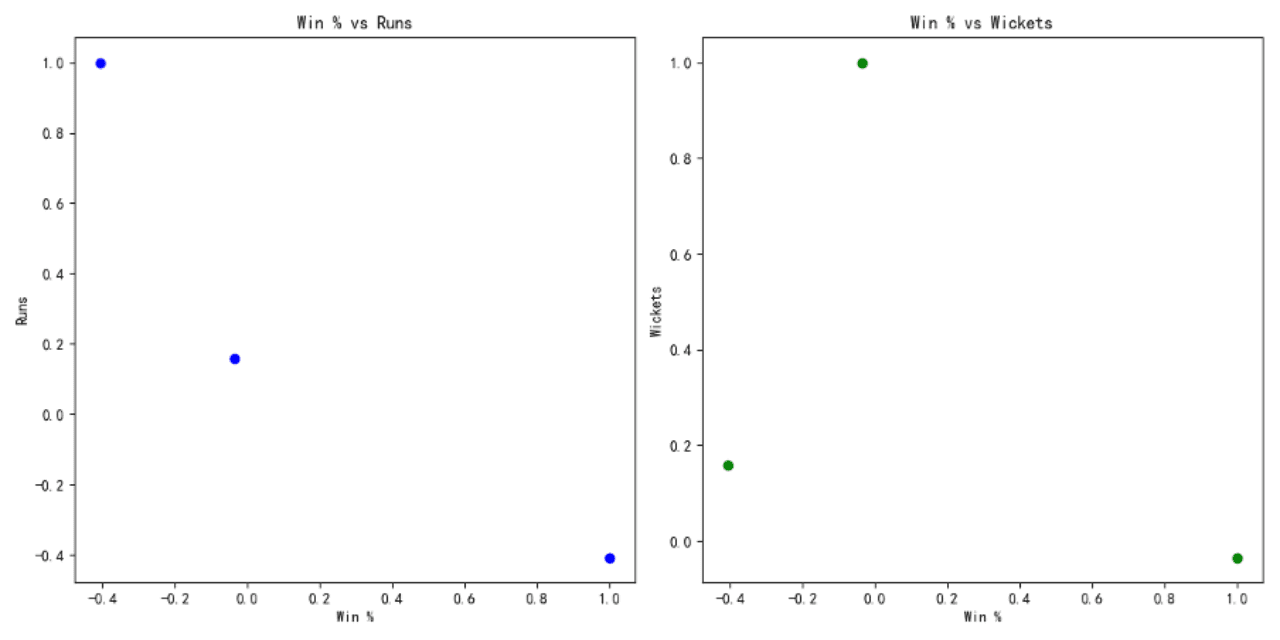
Runs and Win Percentage: The correlation coefficient between 'Runs' scored by players and 'Win %' is -0.40659, indicating a weak negative correlation. This suggests that higher runs do not necessarily correlate with higher win percentages.
Wickets and Win Percentage: The correlation coefficient between 'Wickets' taken by players and 'Win %' is -0.0344329, indicating a very weak negative correlation. This implies that the number of wickets taken by players has almost no impact on the win percentage.
Comparative Analysis of Team Win Percentages
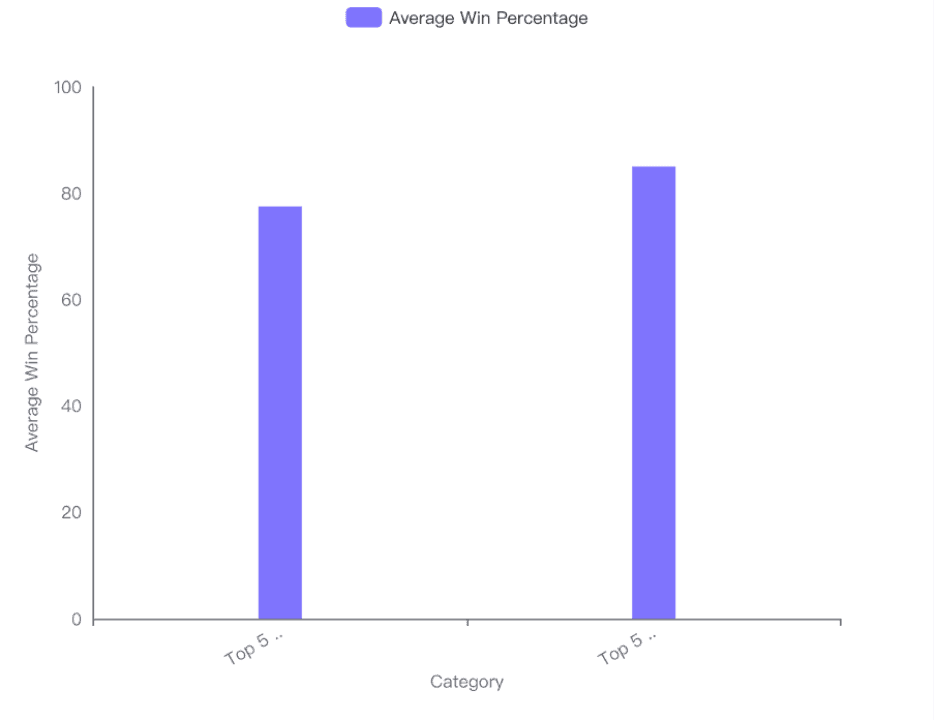
Top 5 Run-Scorers: Teams with the top 5 run-scorers have an average win percentage of 77.5%.
Top 5 Wicket-Takers: Teams with the top 5 wicket-takers have a higher average win percentage of 85%.
Conclusion: Teams with top wicket-takers tend to have a higher win percentage compared to teams with top run-scorers.
Identification of Key Players Impacting Team Win Percentage
The correlation analysis indicates that individual player performance metrics ('Runs' and 'Wickets') have a minimal to negative correlation with team win percentage. Specifically:
Runs: Correlation with win percentage is -0.40659.
Wickets: Correlation with win percentage is -0.0344329.
Conclusion: Neither high runs nor high wickets strongly correlate with higher team win percentages, suggesting that other factors might be more influential in determining the outcomes of matches.
Overall Summary
The analysis suggests that while top wicket-takers seem to contribute slightly more to team success compared to top run-scorers, individual performance metrics like runs and wickets are not strong predictors of team win percentage. Teams should perhaps focus on broader strategic elements beyond just individual performances to enhance their chances of winning.
Try Now
Try Powerdrill AI now, explore more interesting data stories in an effective way!

