
Introduction
Infographics have become one of the most effective ways to simplify complex information and present it in a visually engaging format. Whether you’re explaining data trends, summarizing research findings, or creating marketing content, a well-designed infographic can capture attention and improve understanding instantly.
Traditionally, creating infographics required design expertise and hours of manual work. But with the rise of AI-powered tools, the process has become much faster and more accessible. In this guide, we’ll explore how you can leverage AI—specifically with Powerdrill Bloom—to create professional infographics based on any topic, even without design skills.
Why Use AI to Create Infographics Based on a Topic
AI brings a number of advantages to the infographic creation process:
Time Efficiency – AI automates the heavy lifting, from analyzing your topic to generating charts and layouts, cutting hours of work down to minutes.
Accessibility – You don't need to be a graphic designer. With AI, anyone can create polished visuals.
Consistency and Accuracy – AI ensures that your data is visualized clearly and consistently, reducing the risk of errors or cluttered designs.
Creativity Boost – AI suggests design elements, color schemes, and layouts you may not have considered, inspiring fresh ideas.
Scalability – Whether you need one infographic or a series across different topics, AI helps you produce them quickly and at scale.
By combining automation with customization, AI enables professionals, educators, and marketers alike to turn ideas into visuals with minimal effort—unlocking the power of visual storytelling for everyone.
Step-by-Step Guide by Using Powerdrill Bloom
Step 1. Sign in and Enter Your Topic
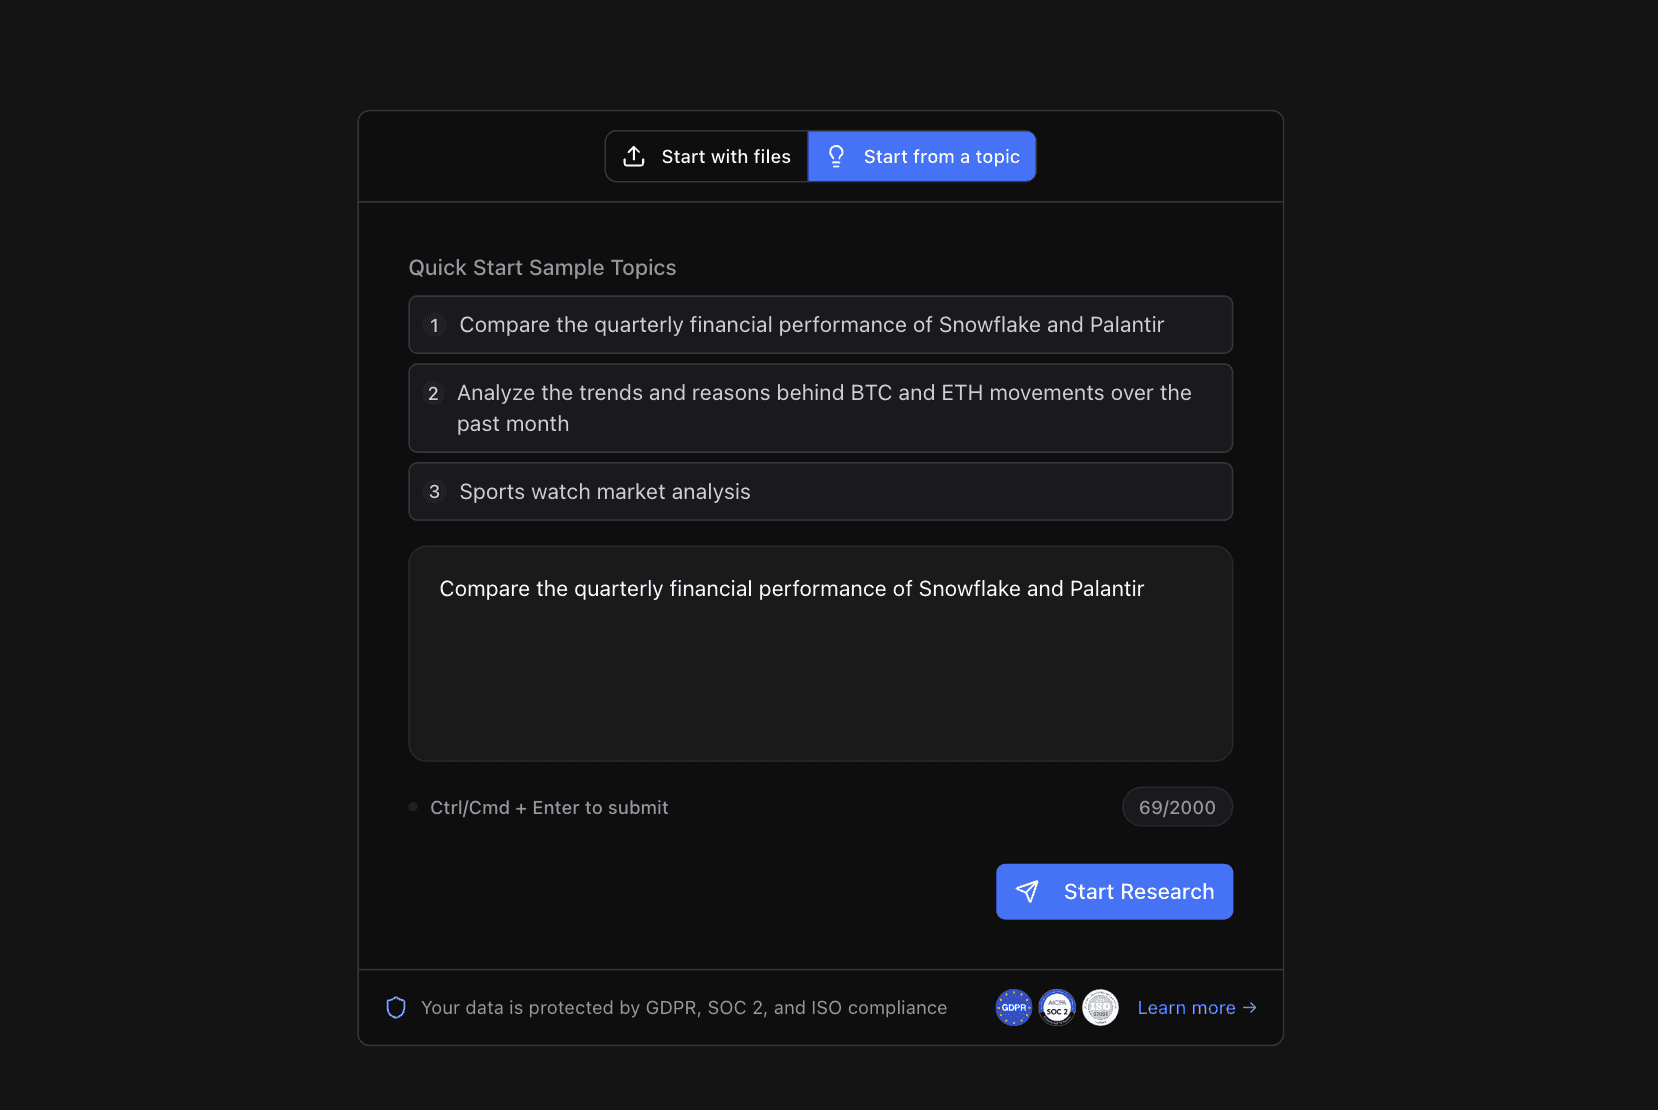
Sign in to Powerdrill Bloom.
Click "Start Blooming", choose "Start from a topic", enter your topic, and click "Start Research".
Example: Compare the quarterly financial performance of Snowflake and Palantir.
Select the option that best suits your needs, and click "Confirm".
Example: Compare the latest reported quarter for both companies (default): headline P&L, growth, margins (GAAP & non-GAAP), cash flow, RPO/billings, guidance.
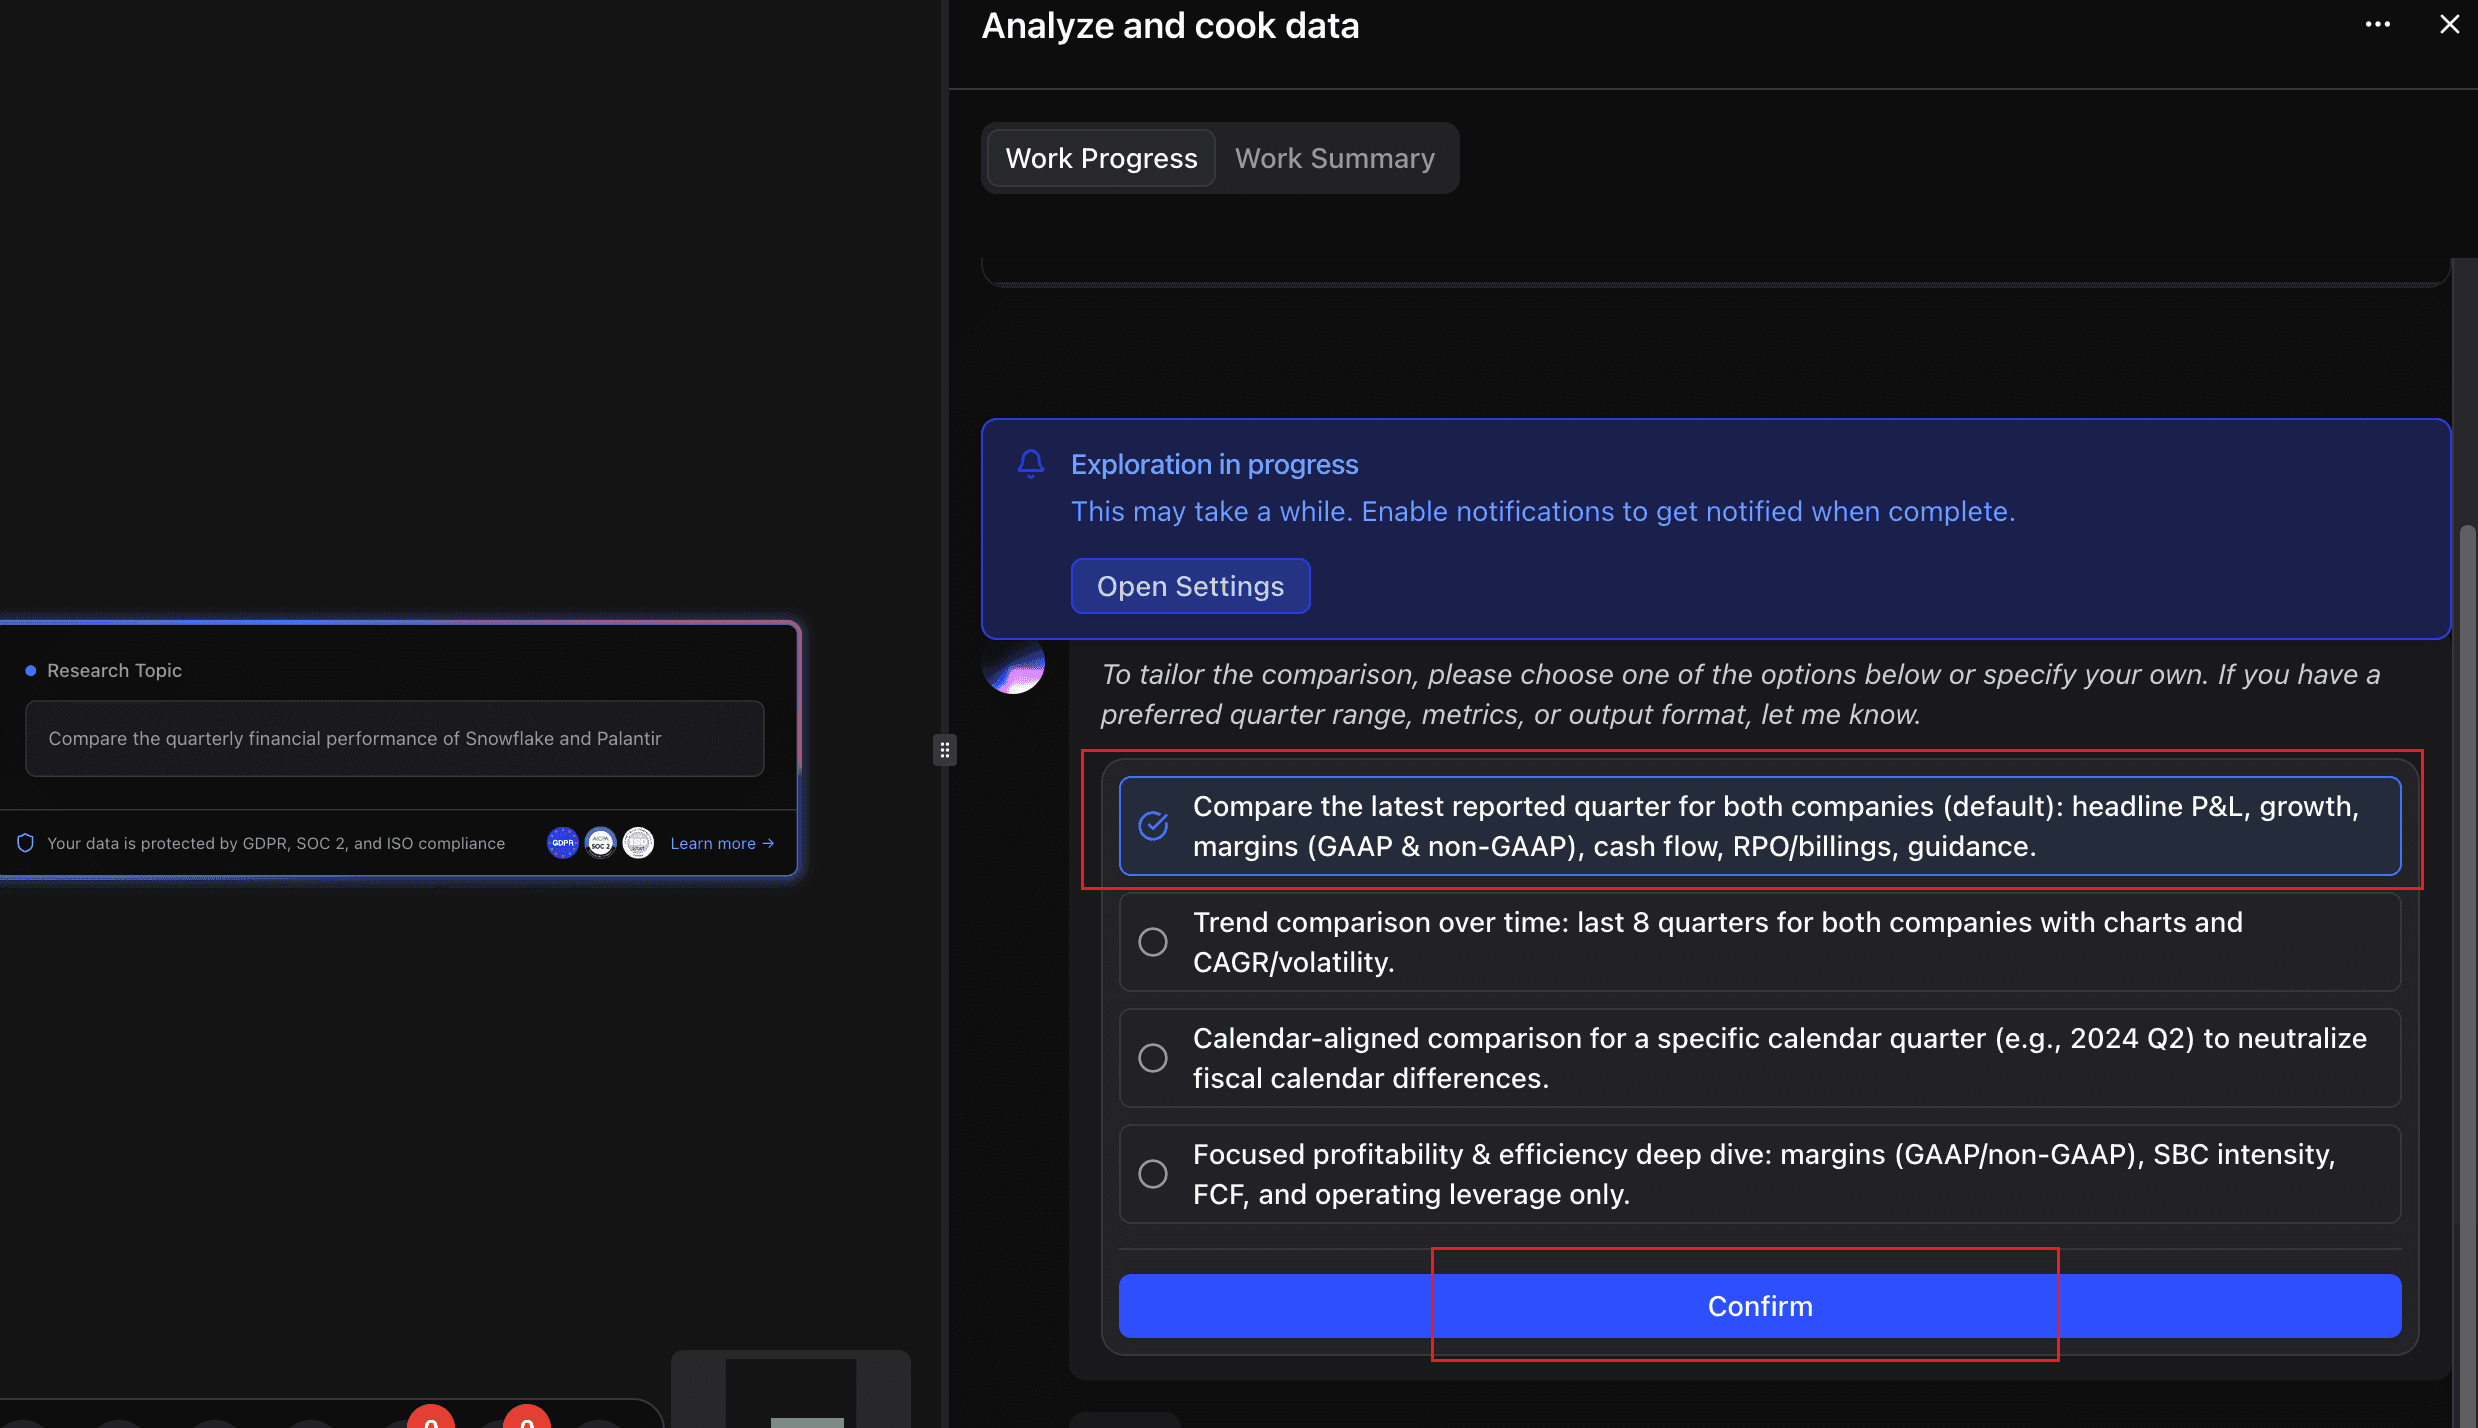
Then, Bloom immediately scans the web, collects data, and prepares the exploration results for you.
Step 2. View the Exploration Results
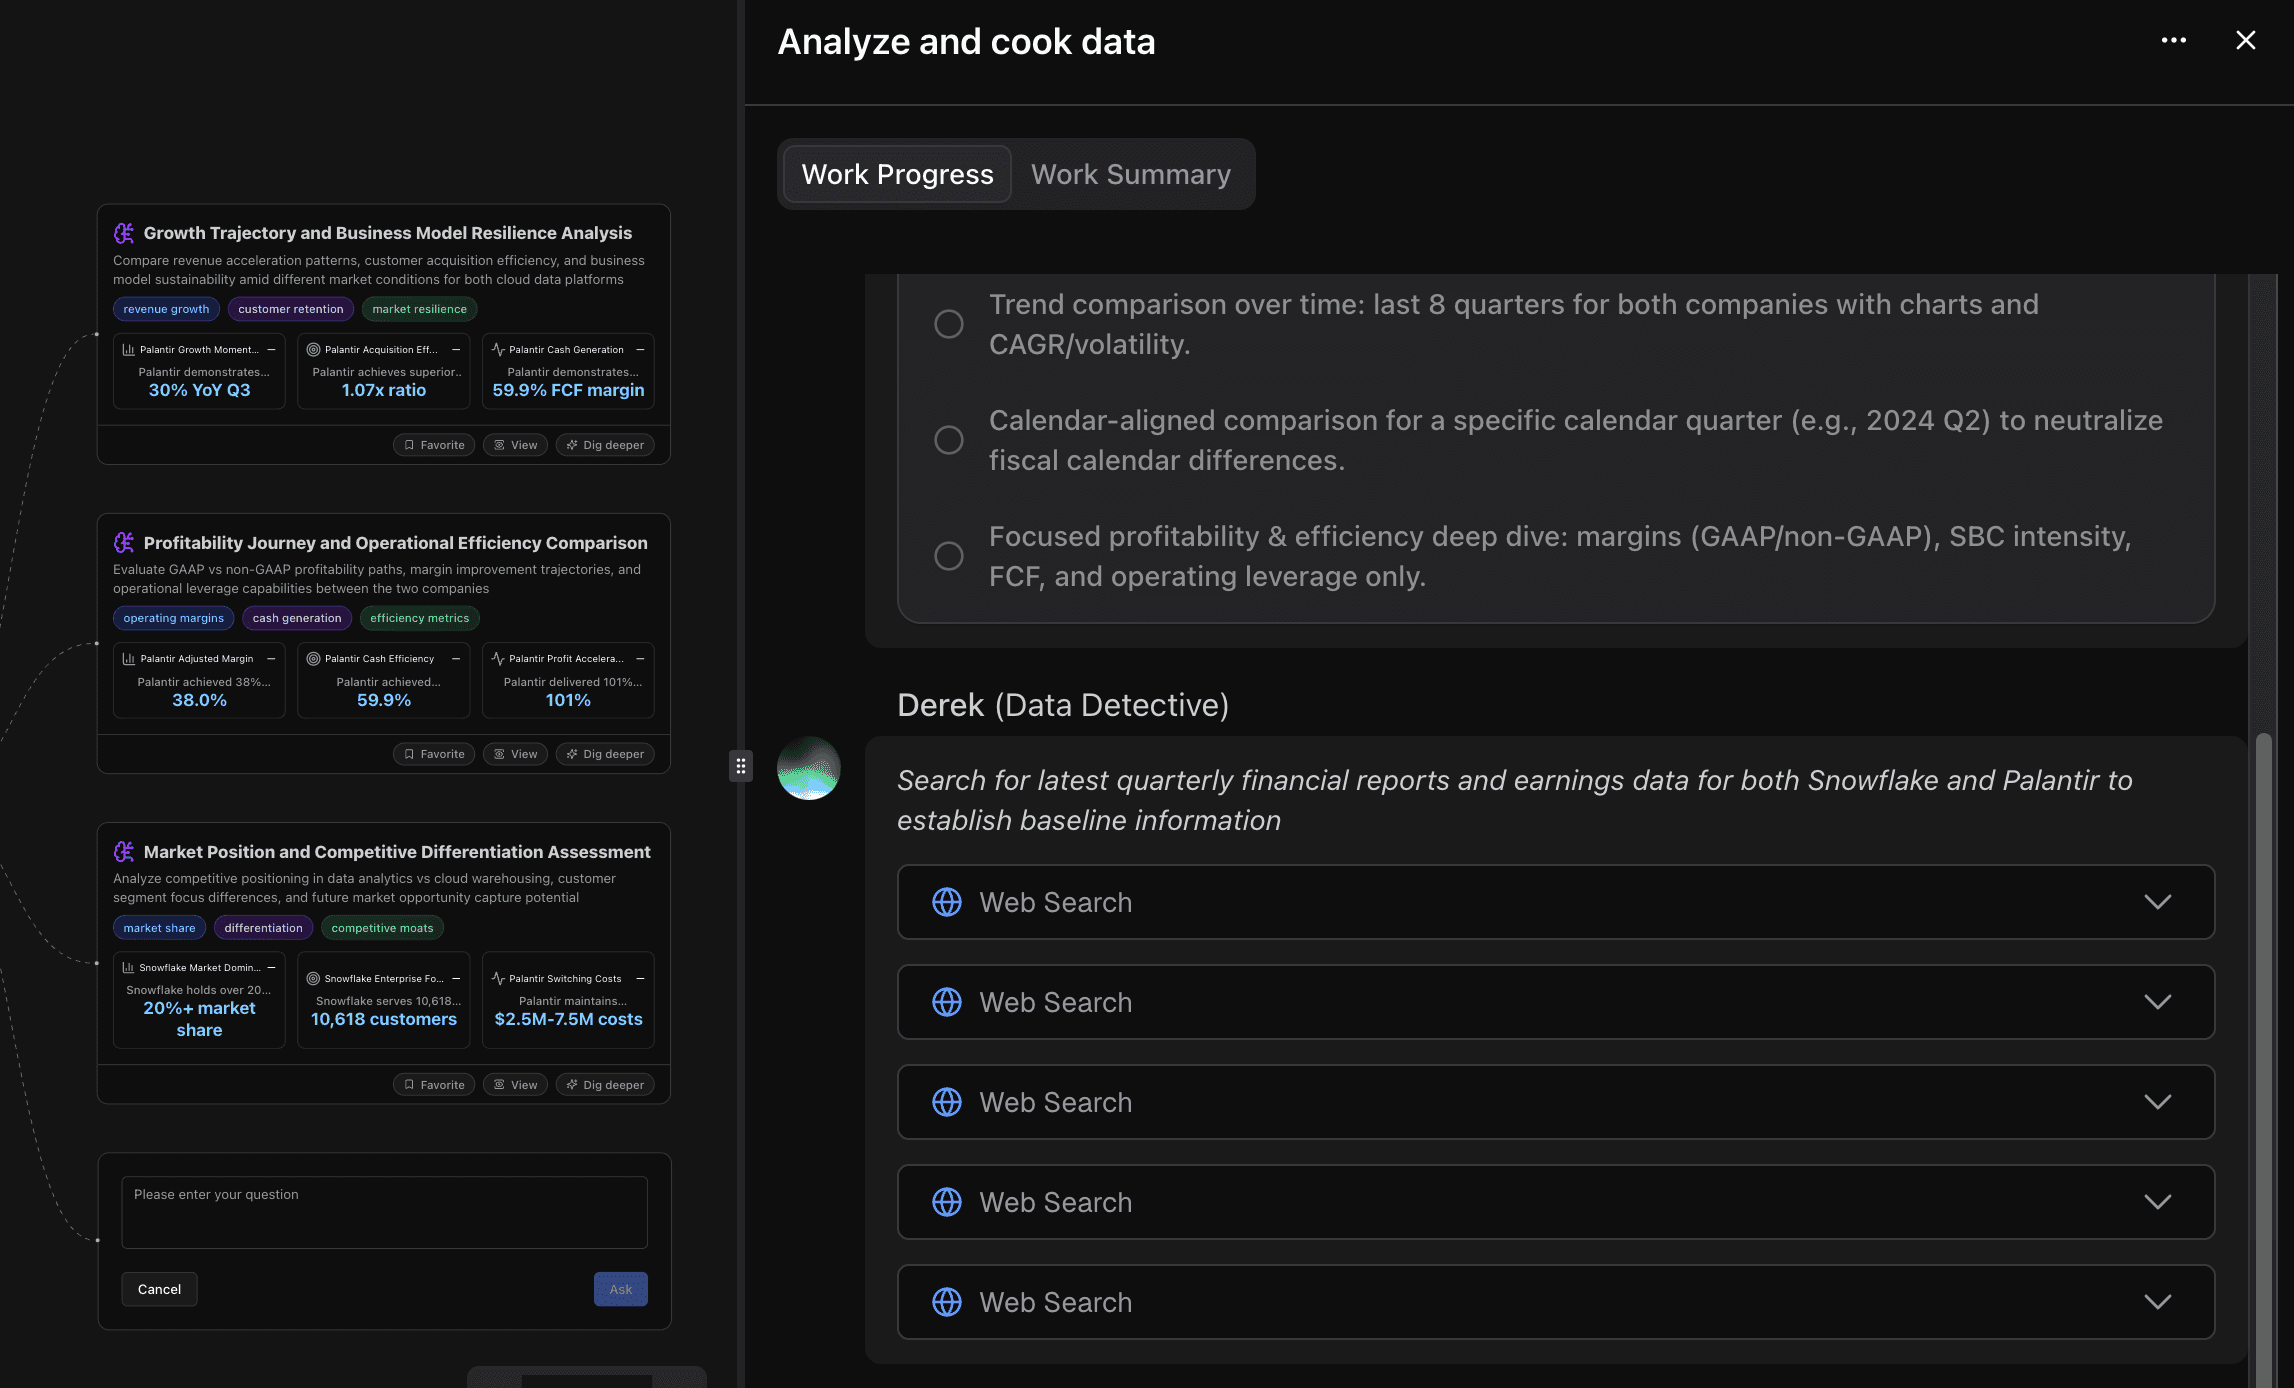
After the initial scan, Bloom generates several exploration paths based on your dataset. These might include:
Growth Trajectory and Business Model Resilience Analysis
Profitability Journey and Operational Efficiency Comparison
Market Position and Competitive Differentiation Assessment
You can select one path to explore in depth or compare multiple perspectives.
During the process, you can track progress in the Work Progress panel on the right-hand side.
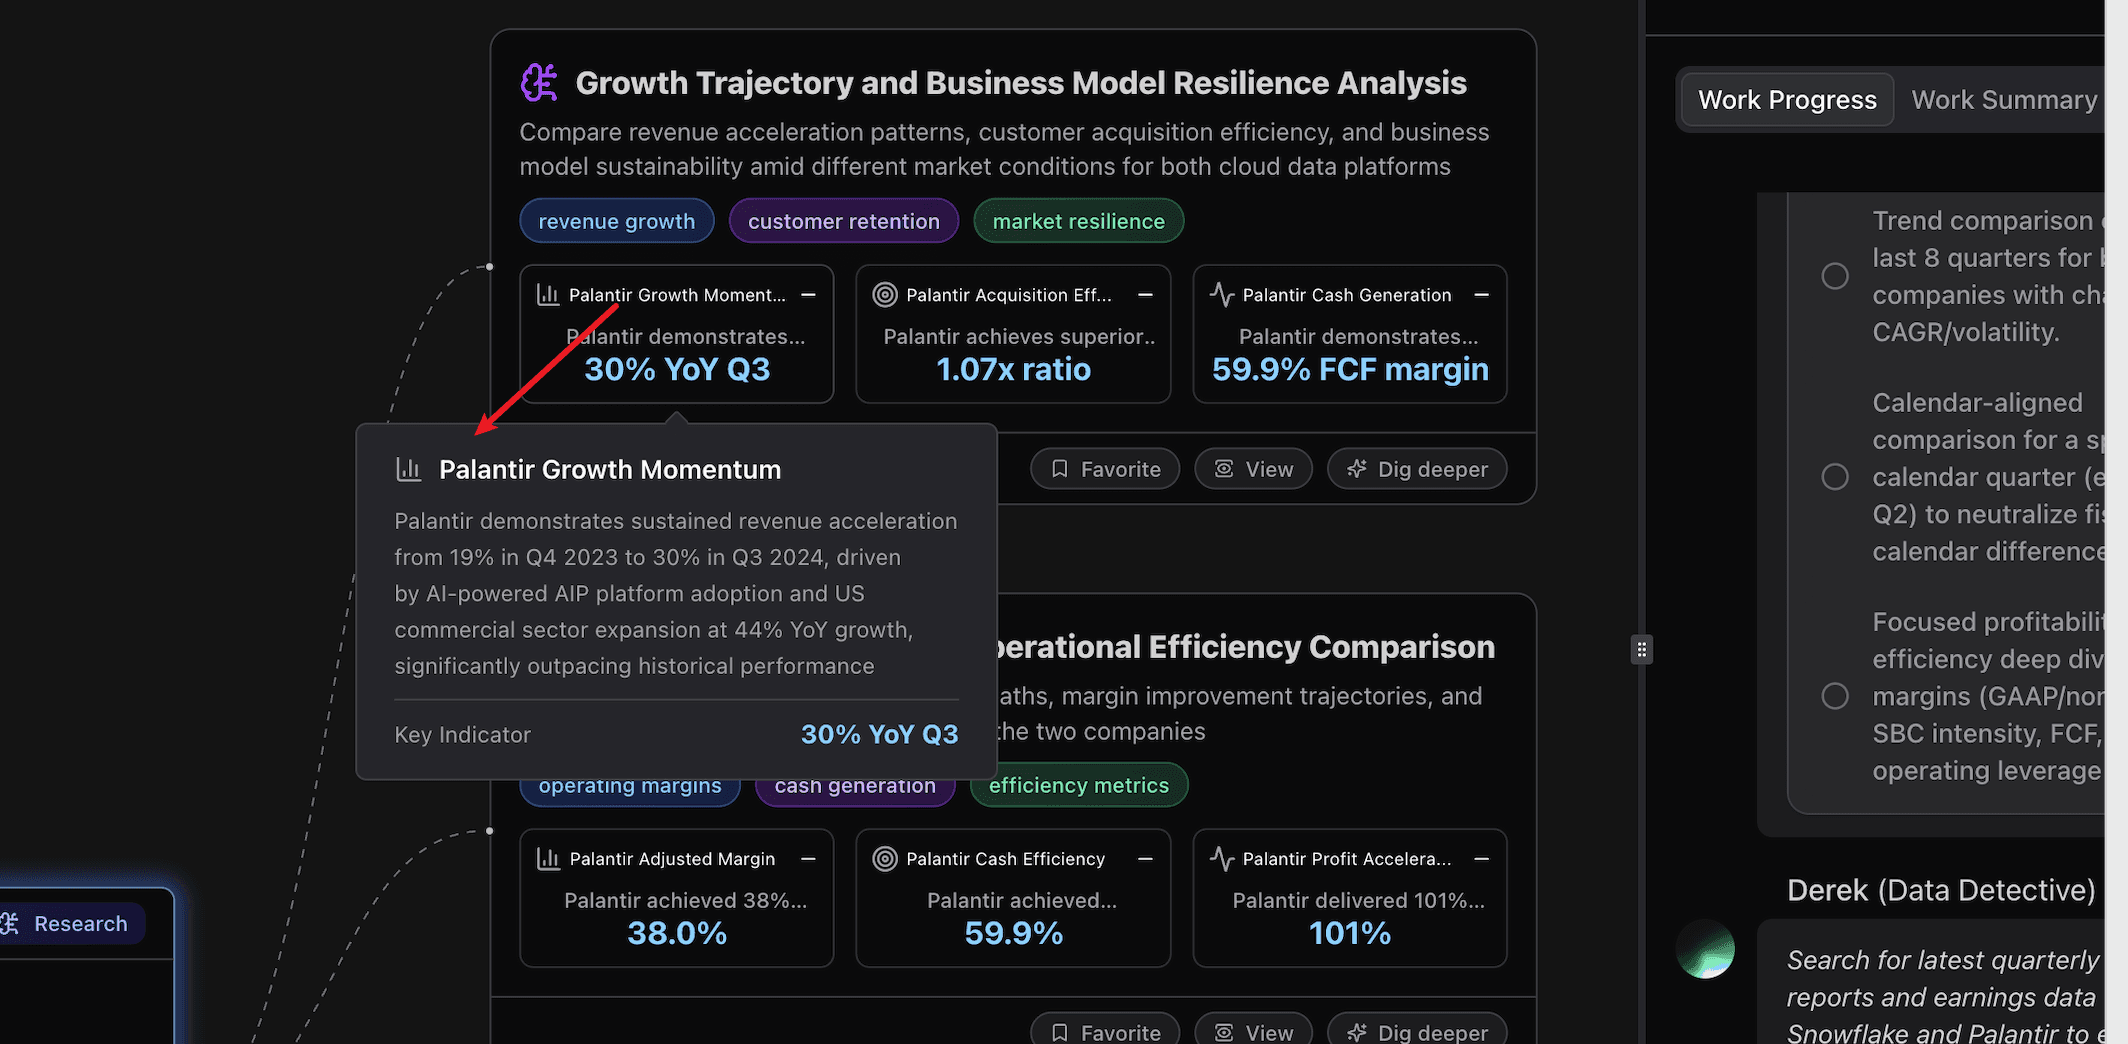
Once exploration is complete, hover over any metric you're interested in to view its details.
If you want to learn more about a specific exploration path, click “View” on the corresponding node. For example, you might open the “Market Position and Competitive Differentiation Assessment” node to see detailed insights.
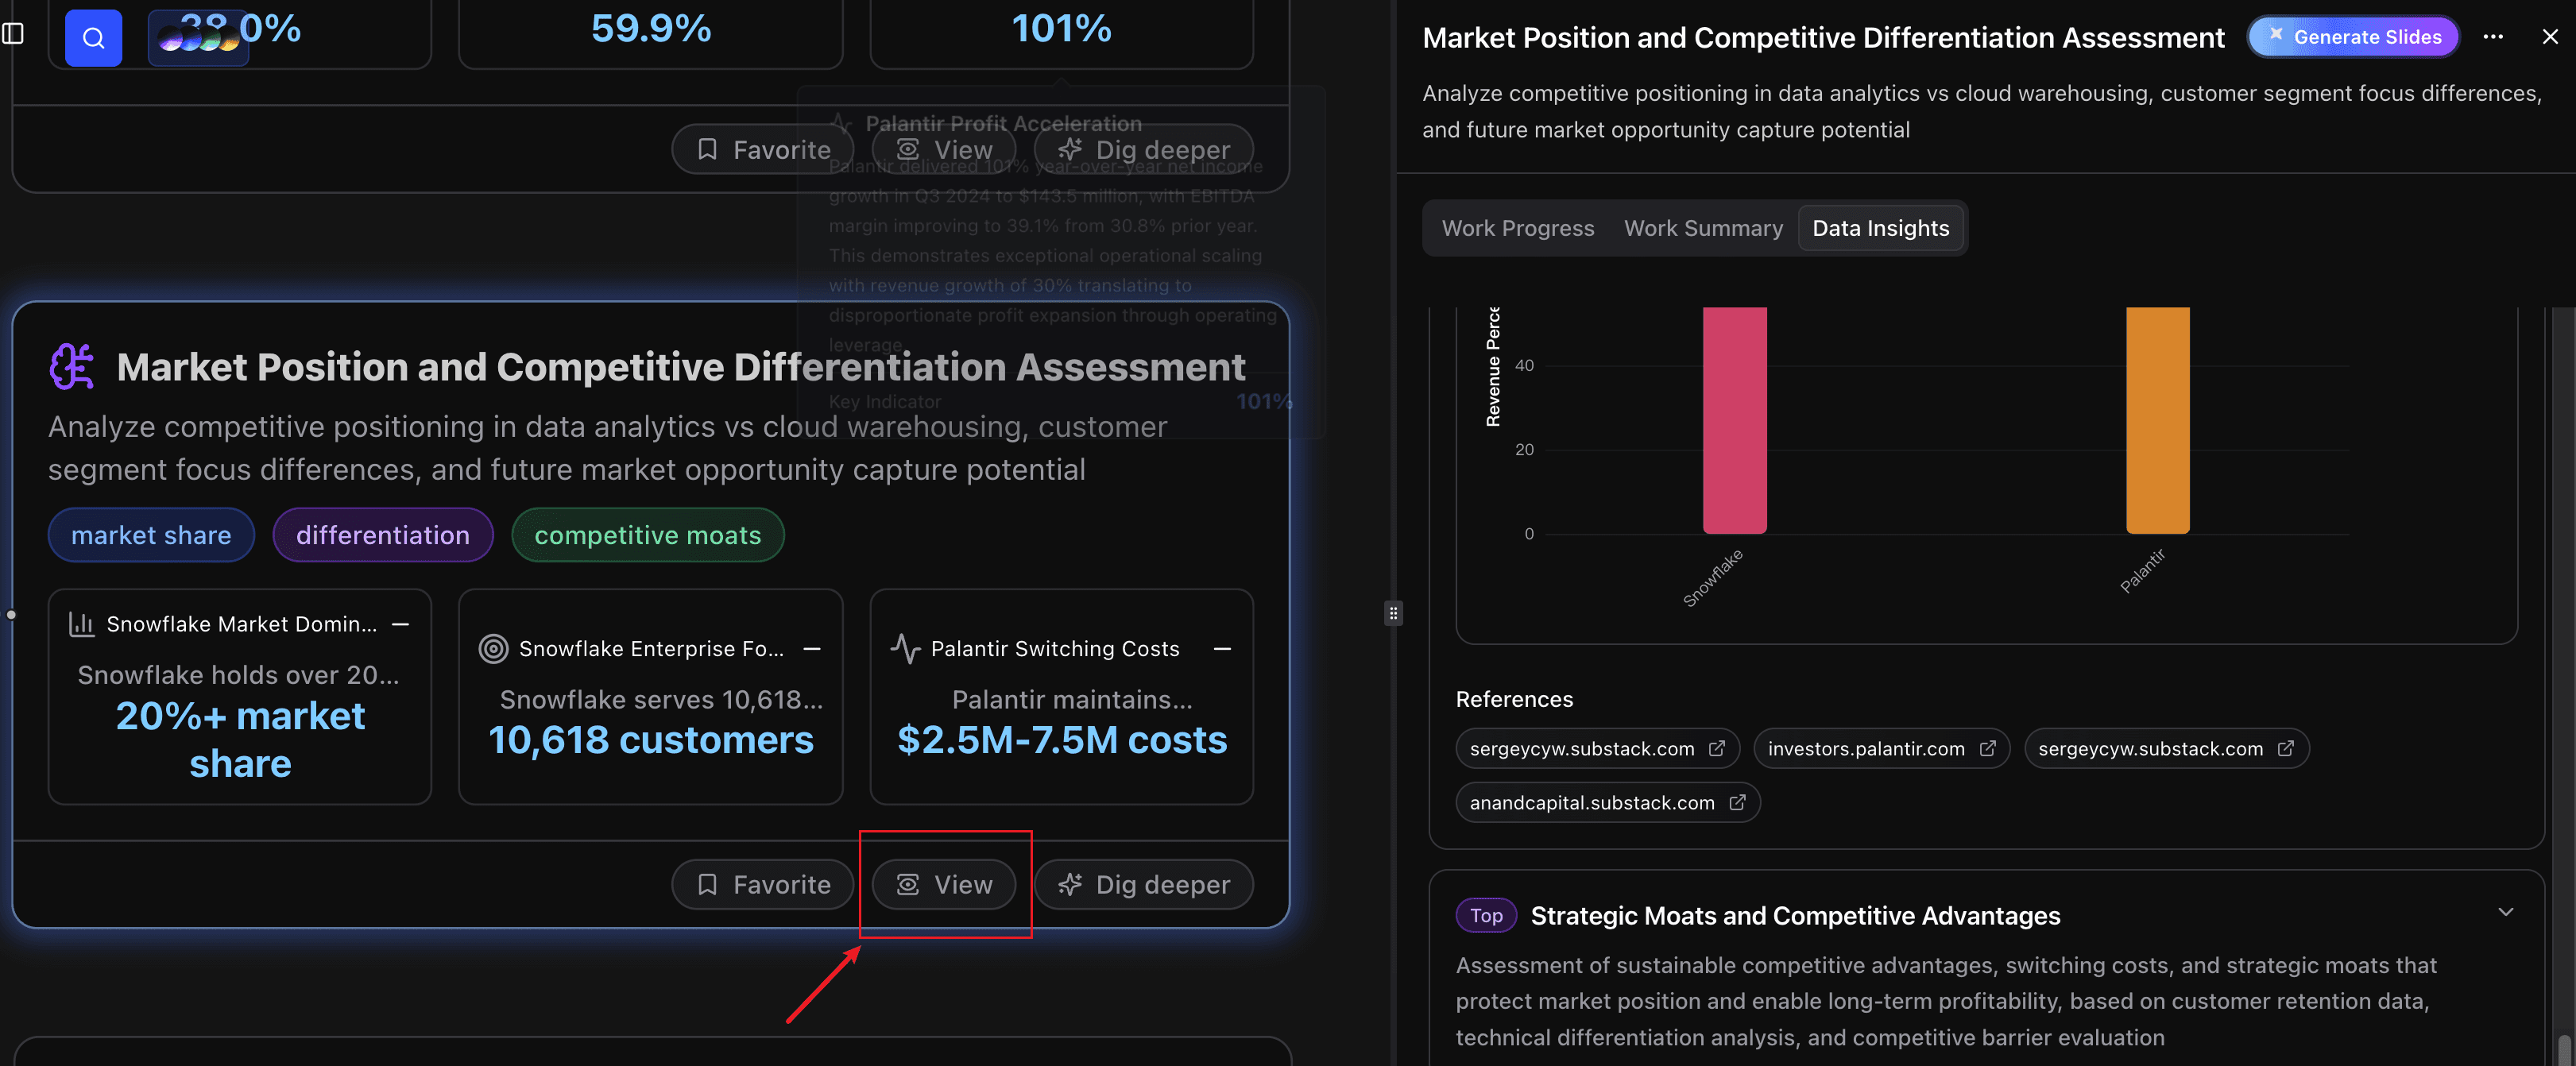
Here's the details of this node:

Step 3. Convert Analysis Results into an Infographic
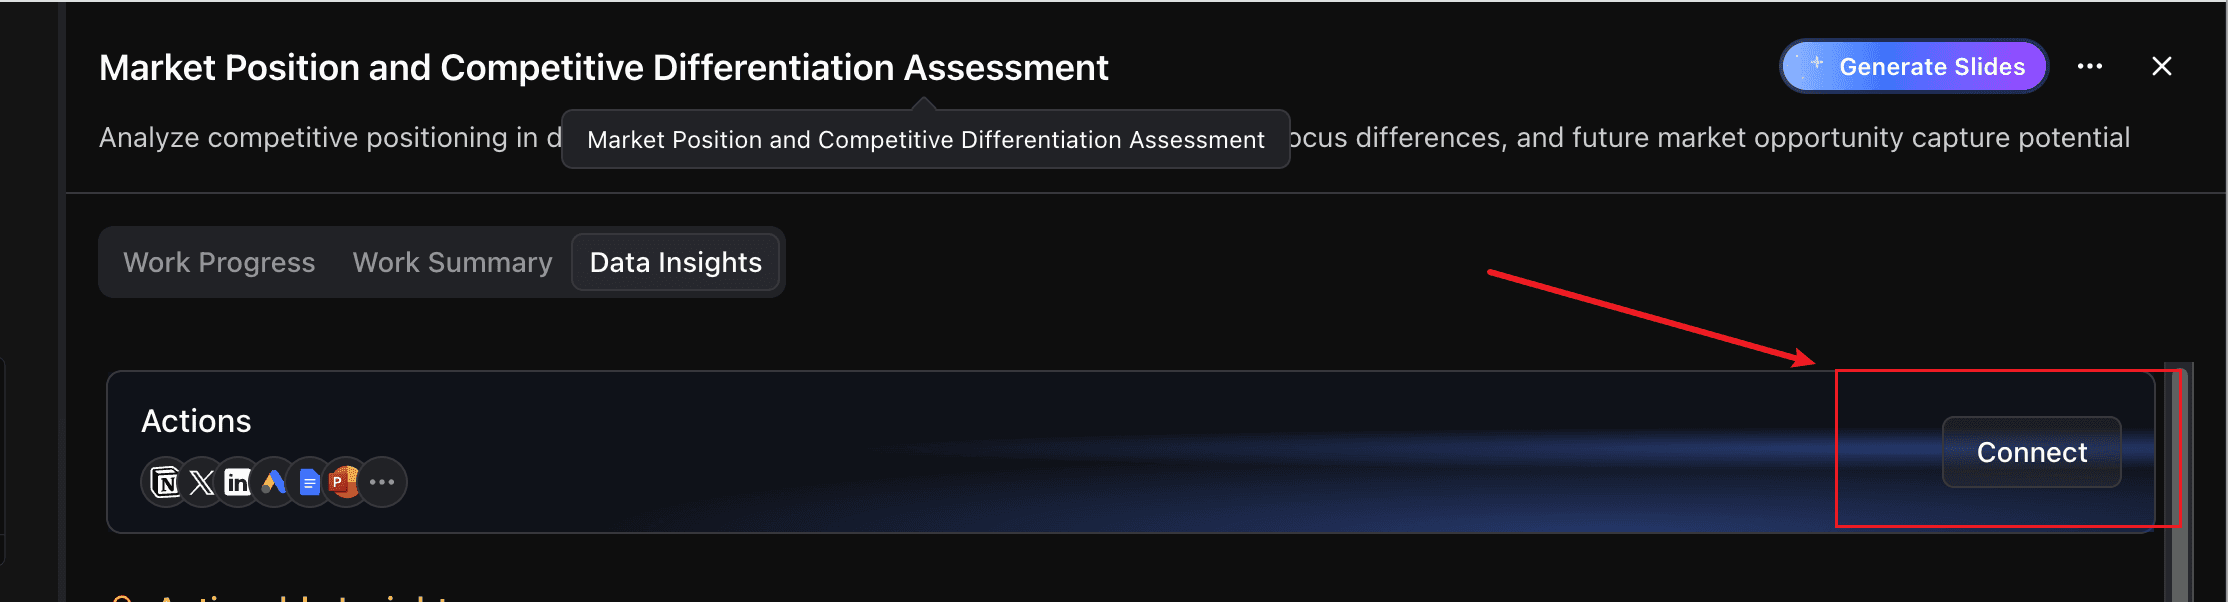
When you're satisfied with the analysis, you can convert it into an infographic:
Click "Connect" in the "Actions" section.
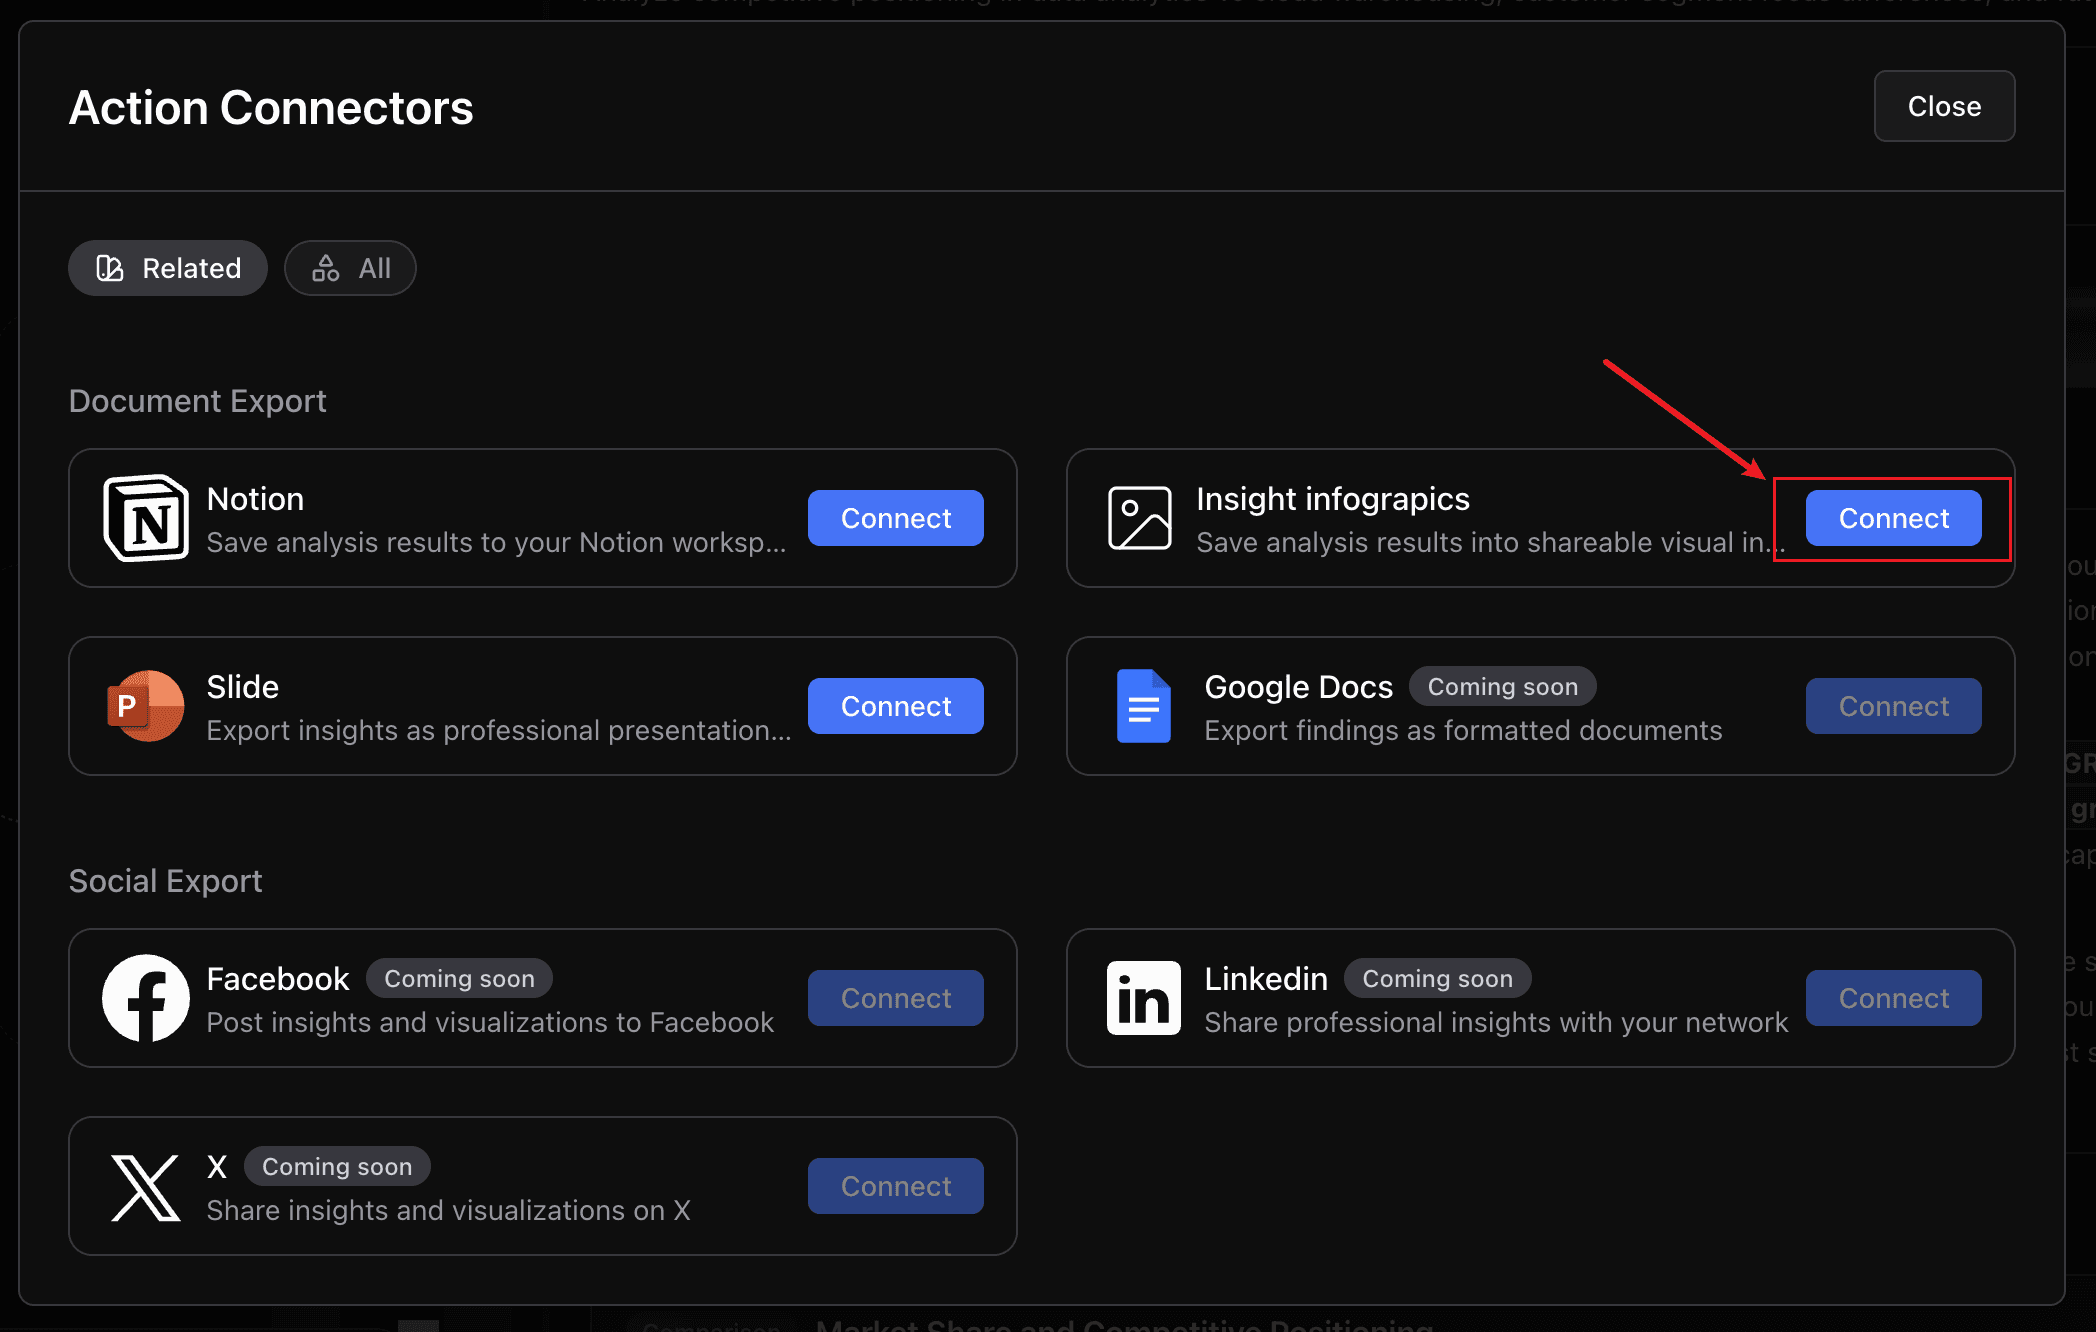
Click "Connect" in the "Insight Infographics" section.
In the "Settings" section, deselect the info that you don't want to include in your infographic, and click "Export".
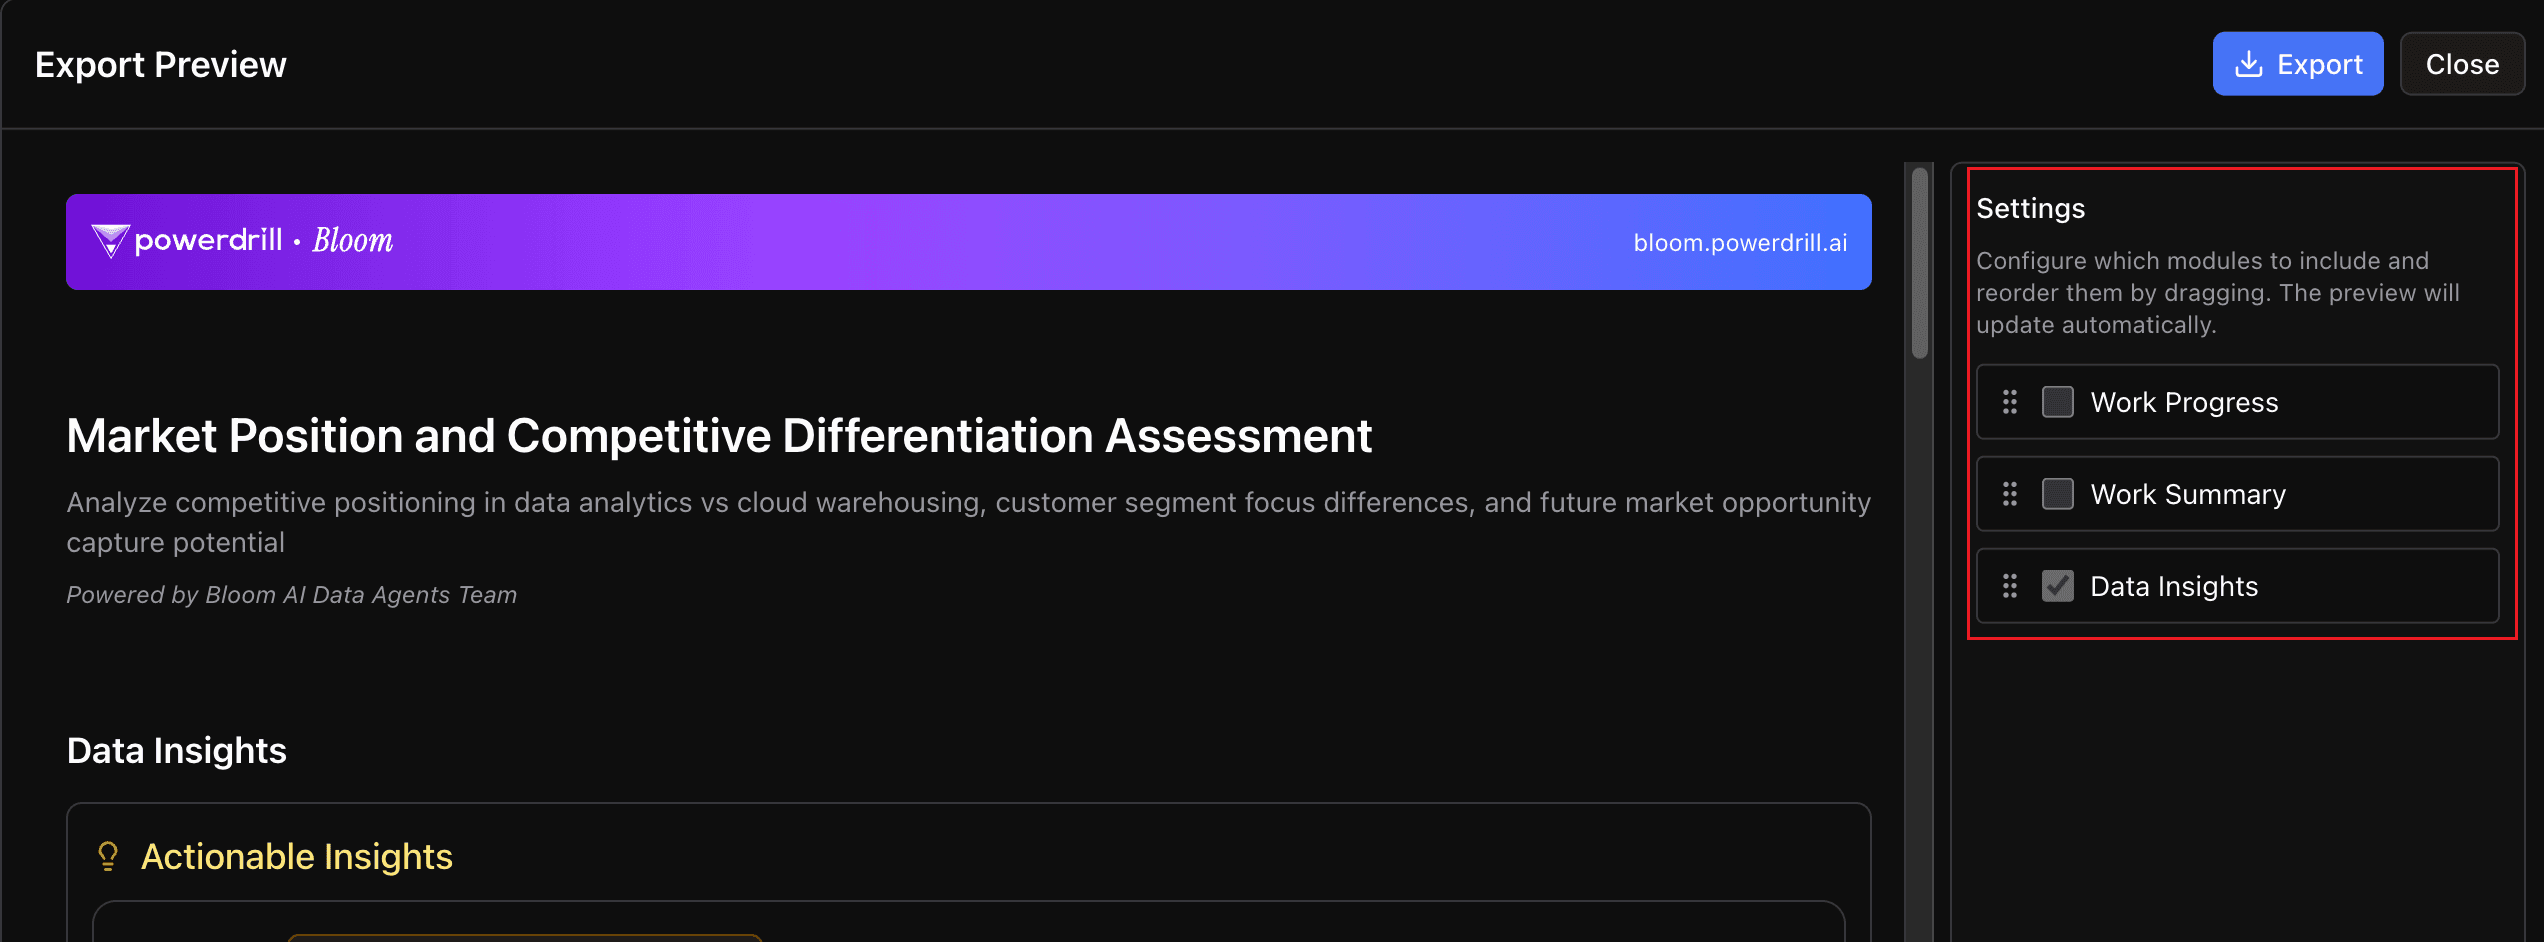
Now you infographic is ready to share or present.
FAQ
Do I need design skills to create infographics with Powerdrill Bloom?
No. Bloom handles the design work automatically. You simply provide a topic or dataset, and Bloom generates polished, professional visuals that you can refine as needed.
Can Bloom handle any type of topic?
Yes. Whether you’re analyzing financial data, market trends, or research insights, Bloom can scan the web, process datasets, and generate meaningful visualizations.
How accurate is the data Bloom provides?
Bloom integrates real-time data from the web and uses built-in verification data agents to ensure accuracy. Still, it’s recommended to review and confirm critical numbers before publishing.
Conclusion
AI-powered tools like Powerdrill Bloom are transforming the way we create and share information. Instead of spending hours designing charts and layouts, you can now generate professional infographics in minutes—backed by real-time data and automated analysis.
By starting with a topic, exploring AI-generated insights, and exporting refined visuals, you unlock a faster, smarter, and more scalable way to communicate ideas. Whether you’re a marketer, researcher, or educator, Bloom makes infographics accessible to everyone, blending automation with creativity to deliver powerful visual storytelling.


