
Introduction
Creating a presentation should be about communicating ideas — not wasting hours on formatting slides or copying text from your files. Yet for most students, professionals, and teams, this process is painfully slow. You gather data from spreadsheets, summarize findings from reports, and then spend hours turning them into slides that look presentable.
Powerdrill Bloom changes that. It's an AI-powered presentation generator that instantly transforms your files — whether they’re Excel sheets or PDFs — into clean, professional, and insight-driven slides. With just one click, Bloom analyzes your content, summarizes key points, visualizes data, and organizes everything into a logical, ready-to-present structure.
Instead of spending hours crafting slides, you can now go from data to story in seconds — all powered by Bloom’s intelligent automation.
Why Traditional Presentation Making Is Inefficient?
If you've ever built a presentation from scratch, you know how tedious it can be. The process usually looks like this:
Copying numbers or charts from Excel into PowerPoint.
Summarizing paragraphs of text into short bullet points.
Adjusting colors, fonts, and layouts to make slides look uniform.
Reordering content to make it flow logically.
All these steps are repetitive, time-consuming, and prone to inconsistency — especially when working under tight deadlines.
Traditional tools like PowerPoint or Google Slides focus on design, not data understanding. They don't interpret the content of your files or help you tell a story with it. As a result, you spend more time arranging information than analyzing it.
Powerdrill Bloom eliminates this friction. It doesn't just beautify slides — it reads, understands, and structures your content intelligently. With Bloom, your data, insights, and key points are automatically turned into a visually clear, logically organized presentation, ready to share in minutes.
What Is Powerdrill Bloom?
Powerdrill Bloom is an AI-powered presentation generator that bridges the gap between data and storytelling. Built on Powerdrill’s advanced data analysis and visualization engine, Bloom automatically transforms your existing files — spreadsheets, reports, PDFs, or documents — into structured, ready-to-present slides.
Instead of manually copying charts or summarizing text, Bloom interprets your files just like a human analyst would. It identifies key metrics, extracts insights, and turns them into clear, visually compelling slides — complete with data visualizations, summaries, and takeaways.
What makes Bloom different is its contextual intelligence. It doesn’t just convert content into slides; it builds a story. Whether your file contains sales data, research results, or project updates, Bloom organizes the presentation into a logical narrative that flows naturally from introduction to conclusion.
With Powerdrill Bloom, you don’t need design skills, technical expertise, or hours of editing. You only need your data — Bloom does the rest.
How It Works — Create a Presentation in 3 Steps
Creating a presentation with Powerdrill Bloom is as effortless as uploading a file. Here's how it works:
Step 1. Sign In and Upload Your File(s)
Sign in to Powerdrill Bloom and click Start Blooming.
Select Generic Data Agent for Analytics and Exploration, and click Create Canvas.
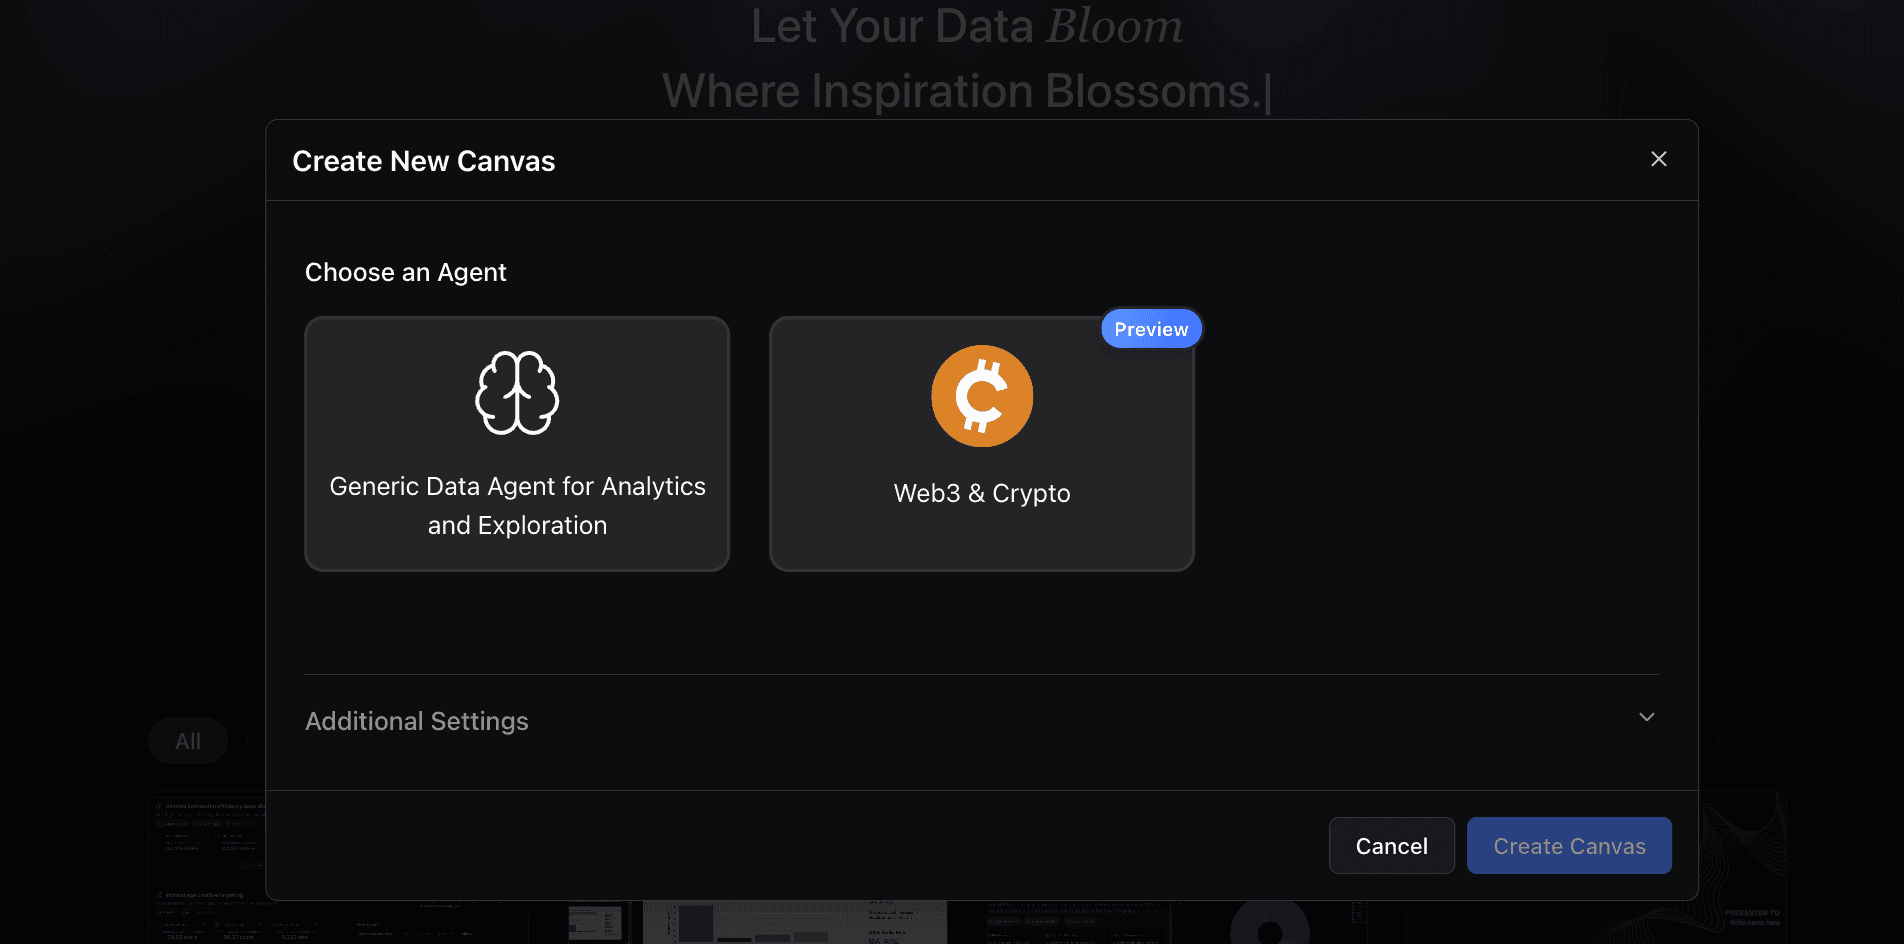
Upload your file. Here we use Nvidia's FY26Q2 financial report as an example.
Step 2. Check the Analytics and Exploration Results
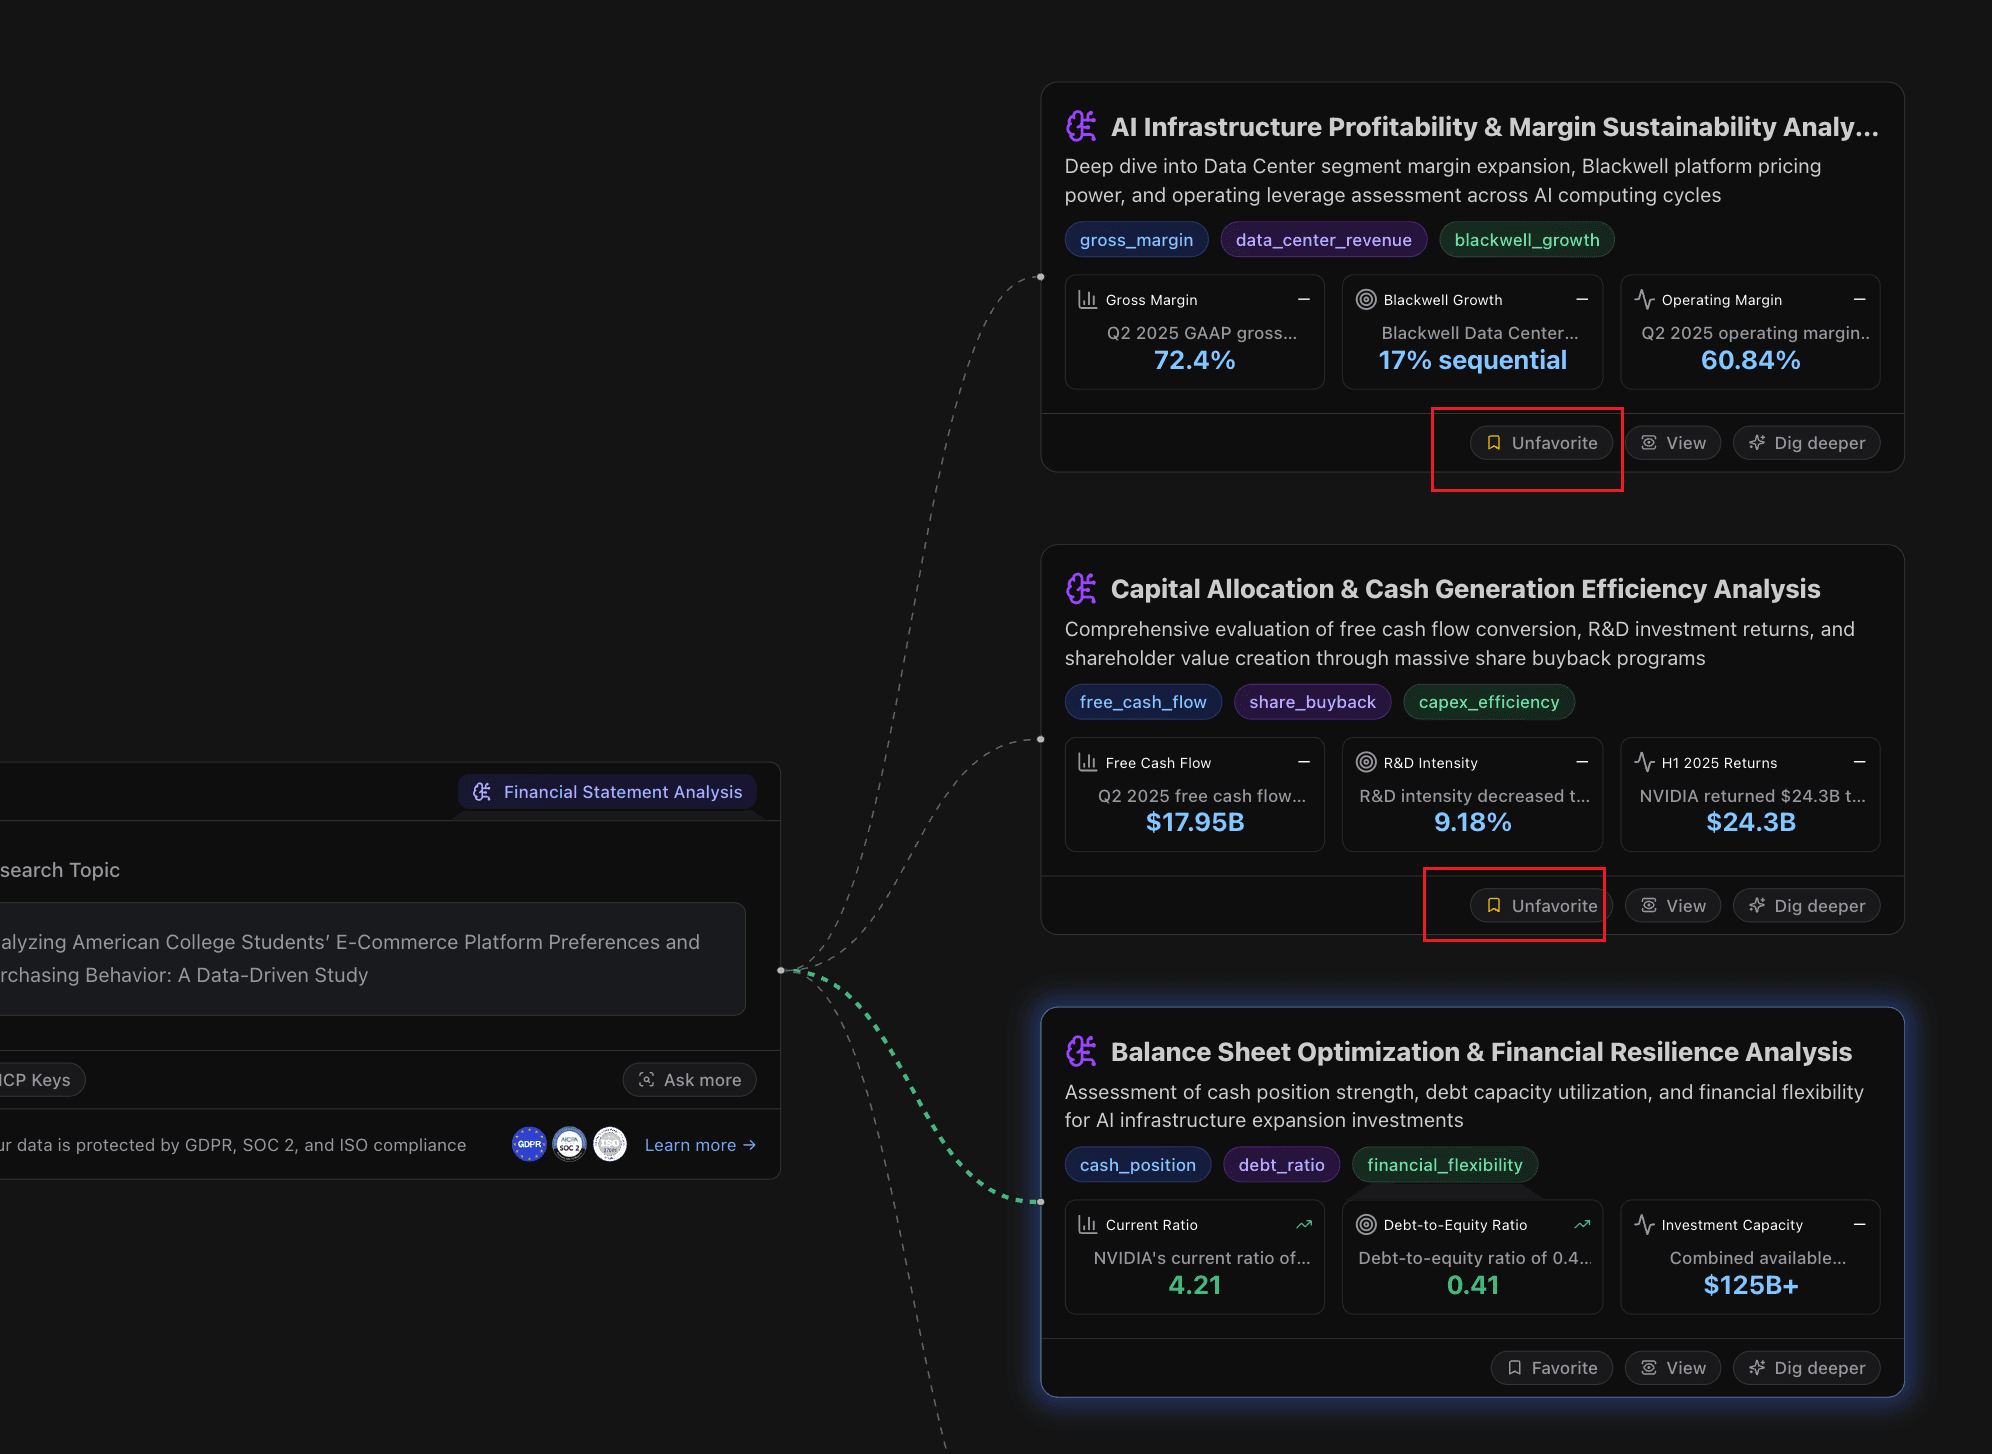
Here's the first layer of exploration. If you're interested in any direction, you can click Dig deeper to explore further.
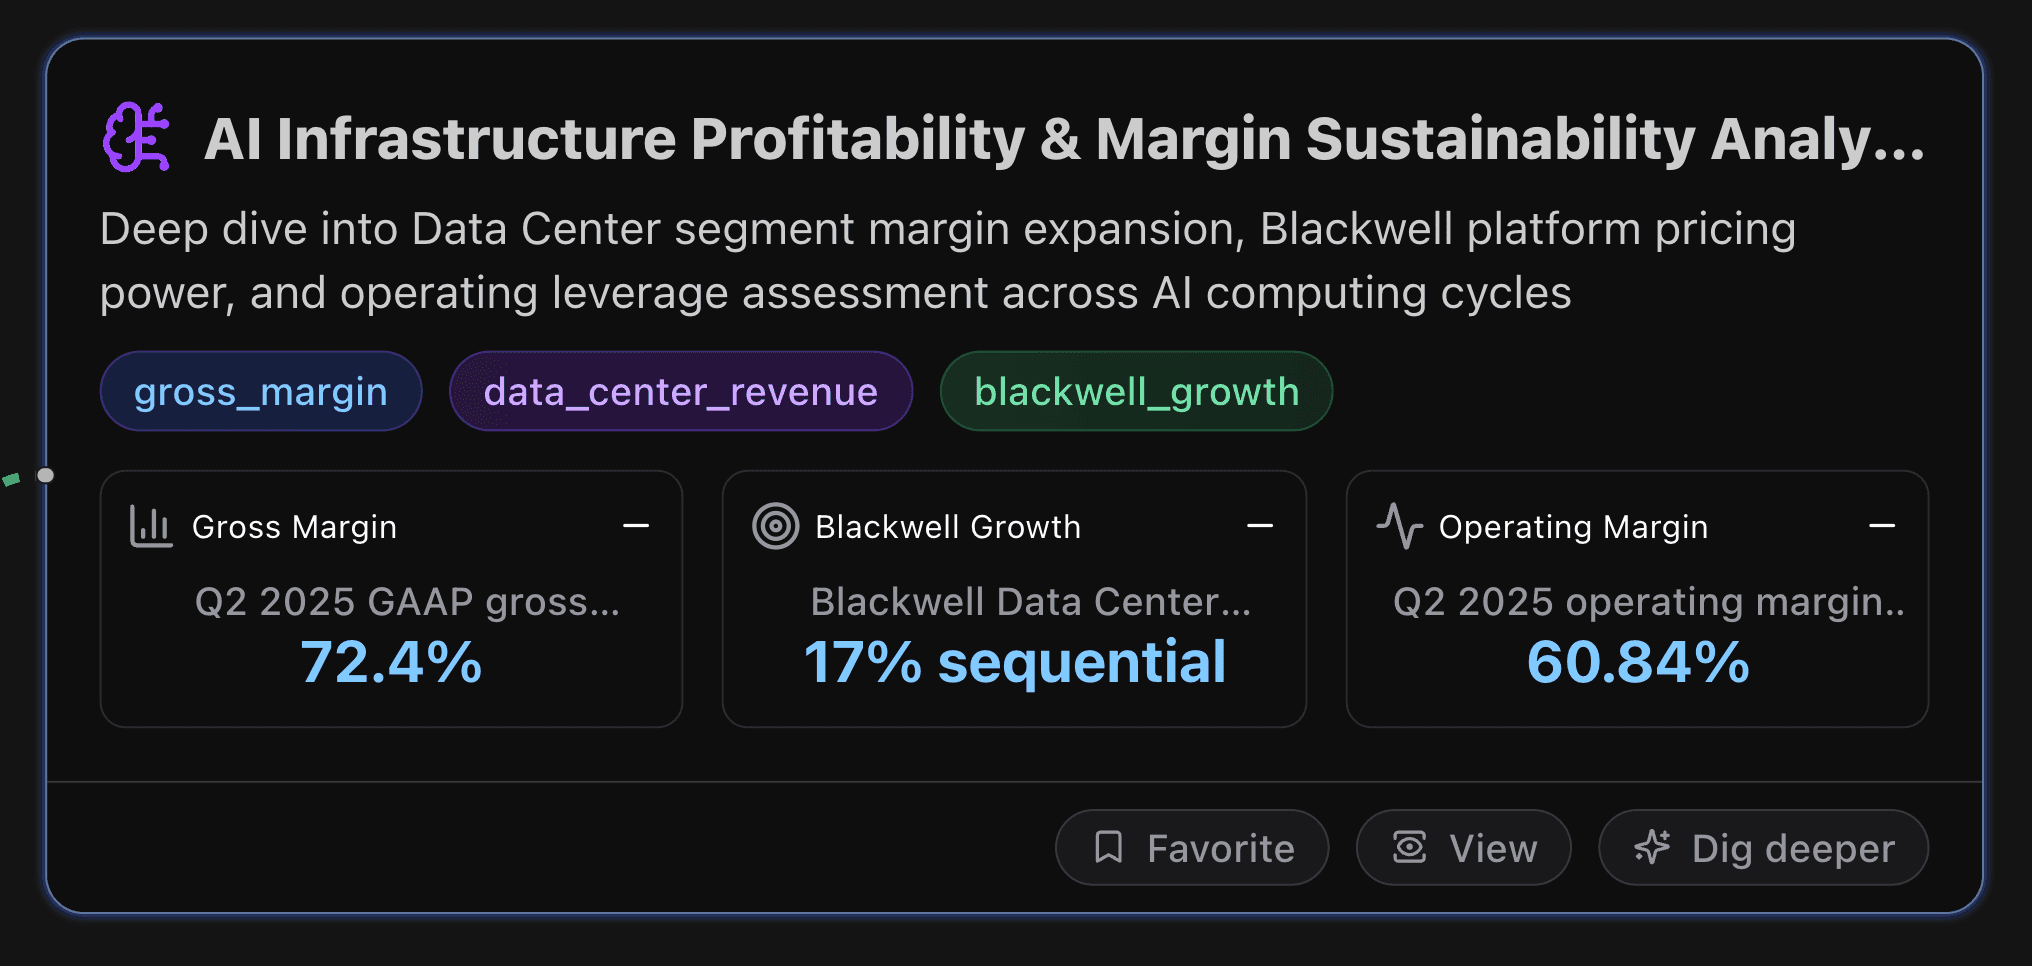
AI Infrastructure Profitability & Margin Sustainability Analysis
This node dives deep into Data Center segment margin expansion, Blackwell platform pricing power, and operating leverage assessment across AI computing cycles.
Key Metrics
Gross Margin
Q2 2025 GAAP gross margin of 72.4% represents a 2.7 percentage point decline from Q2 2024's 75.1%, primarily due to product mix shifts and increased Blackwell production costs. However, Q3 2025 guidance projects recovery to 73.3%, indicating margin stabilization as Blackwell scales and manufacturing efficiencies improve.
Blackwell Growth
Blackwell Data Center revenue achieved 17% sequential growth in Q2 2025, demonstrating strong initial adoption despite being early in product cycle. This growth rate exceeds overall Data Center segment's 5% sequential growth, indicating premium demand for next-generation AI architecture and successful market penetration against competitive offerings.
Operating Margin
Q2 2025 operating margin of 60.84% ($28.4B operating income / $46.7B revenue) demonstrates exceptional operational efficiency, slightly down from 62.07% in Q2 2024 due to strategic R&D investments. This margin significantly exceeds semiconductor industry average of 15-25%, reflecting AI infrastructure premium economics and operational scale advantages.
Actionable Insights
Margin Stabilization Strategy: Focus on maintaining gross margins above 70% through Blackwell platform optimization and manufacturing scale improvements. The current 72.4% Q2 margin with recovery to 73.3% in Q3 guidance indicates successful margin management during product transitions. Monitor competitor pricing pressures and adjust product mix to sustain premium positioning in AI infrastructure market.
Operating Leverage Optimization: Capitalize on positive operating leverage by controlling operating expense growth to high-30% range while scaling 56% growth. Current 60.84% operating margin demonstrates exceptional efficiency but requires careful R&D investment balance to maintain technology leadership while capturing AI market expansion opportunities through disciplined cost management.
Blackwell Platform Expansion: Accelerate Blackwell platform adoption beyond current 17% sequential growth through strategic customer engagement and ecosystem development. With 70-95% market share advantage, prioritize platform stickiness and customer lock-in effects to sustain pricing power across AI infrastructure cycles and defend against emerging competitive threats in next-generation AI computing architectures.
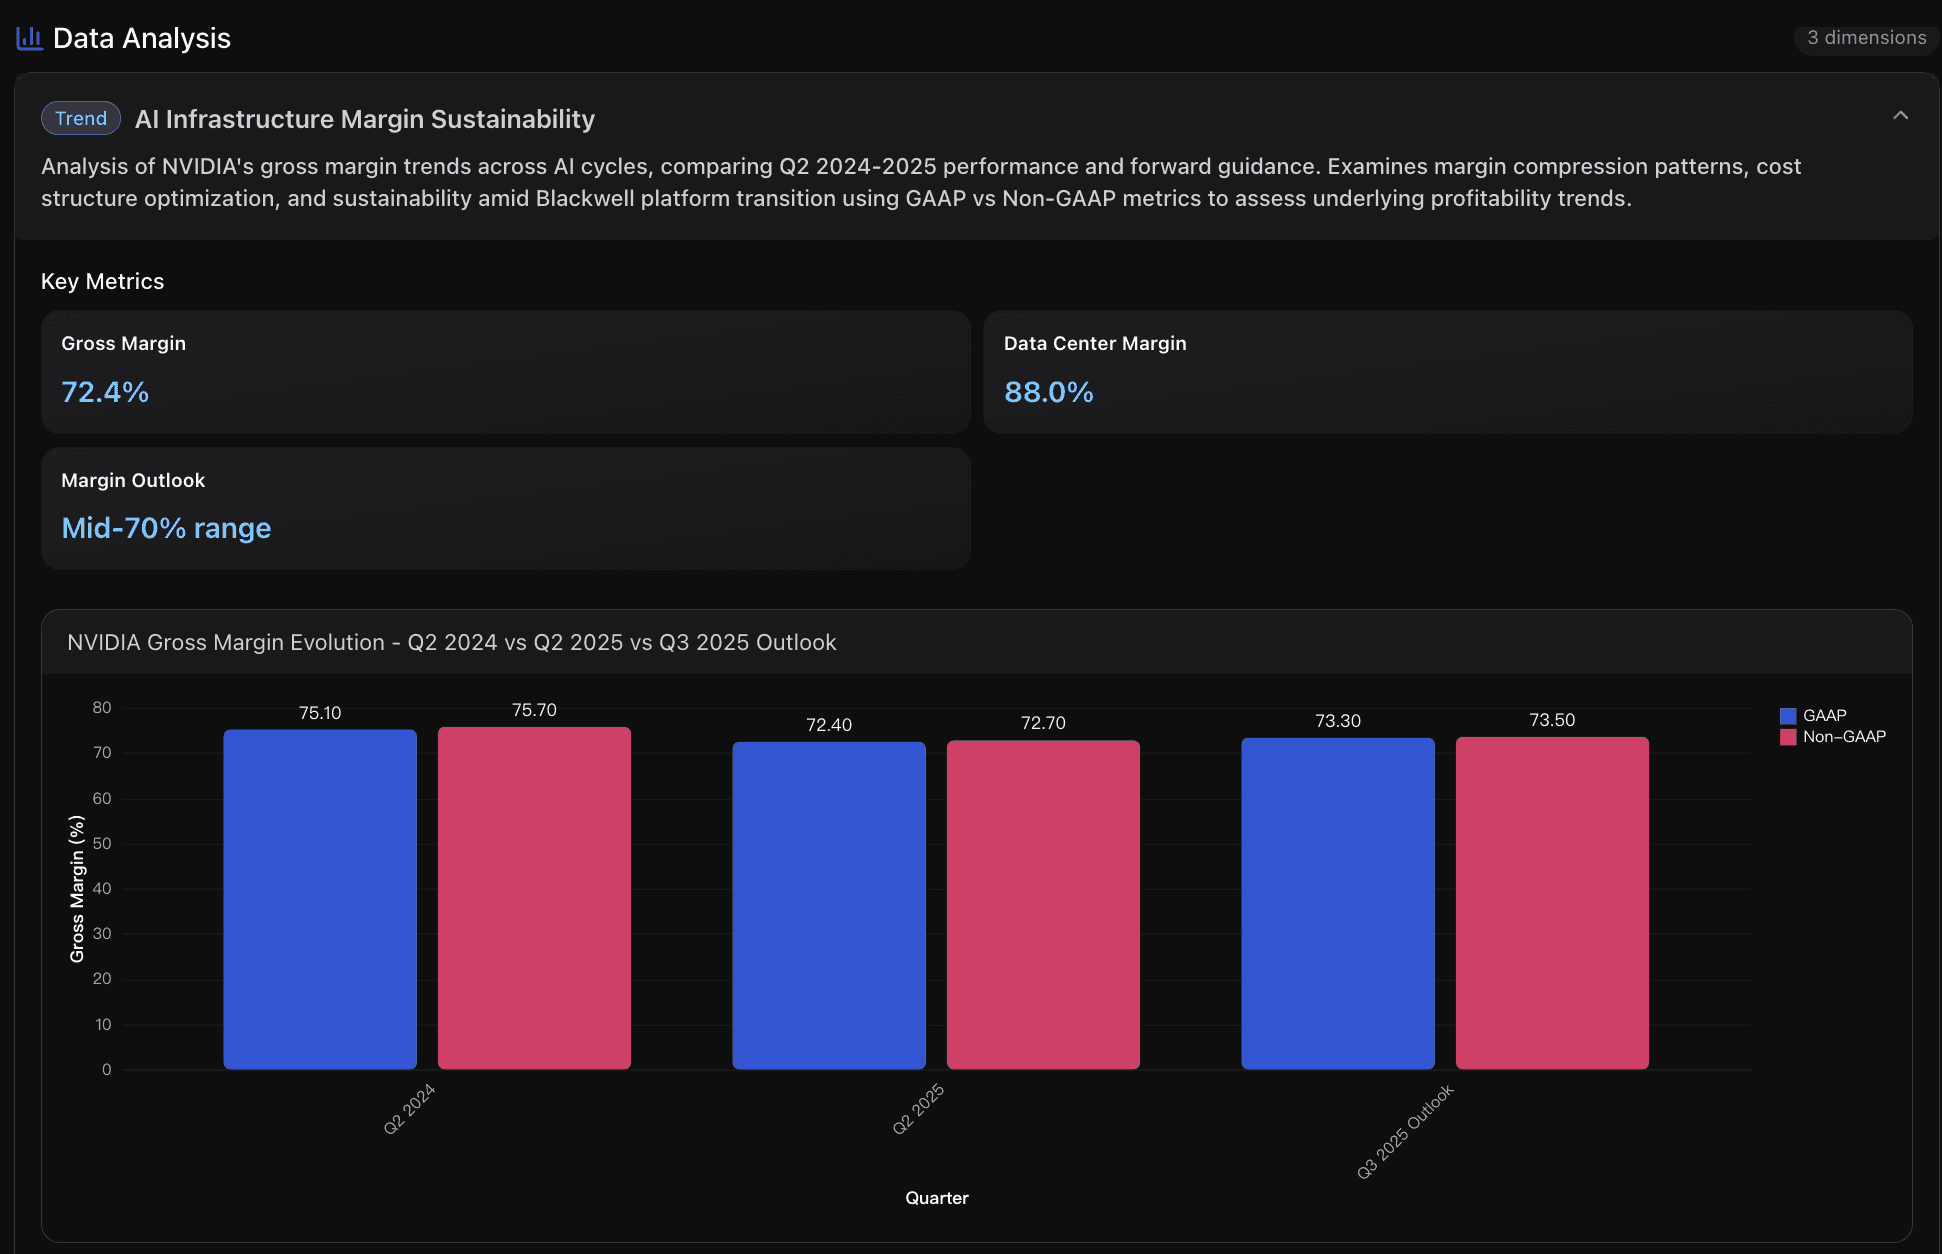
Visualization
Here is a data visualization example:
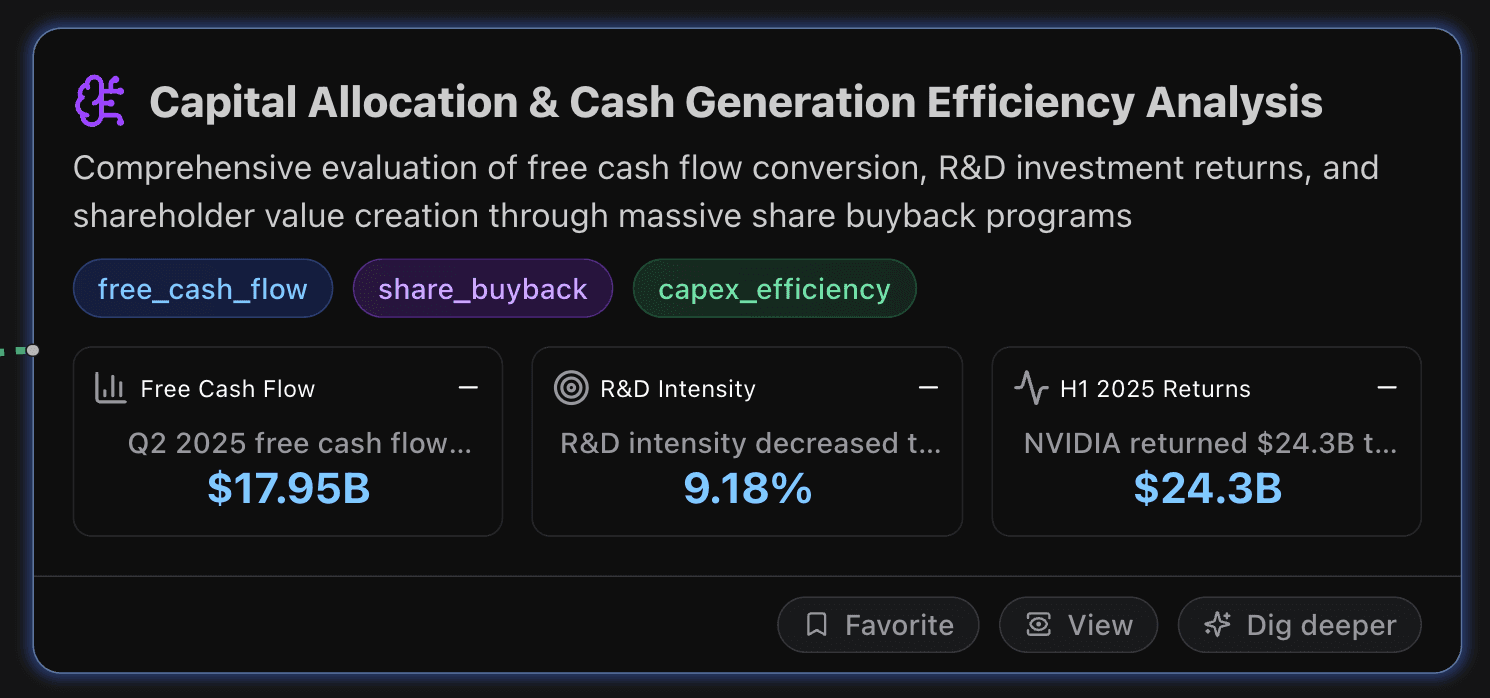
Capital Allocation & Cash Generation Efficiency Analysis
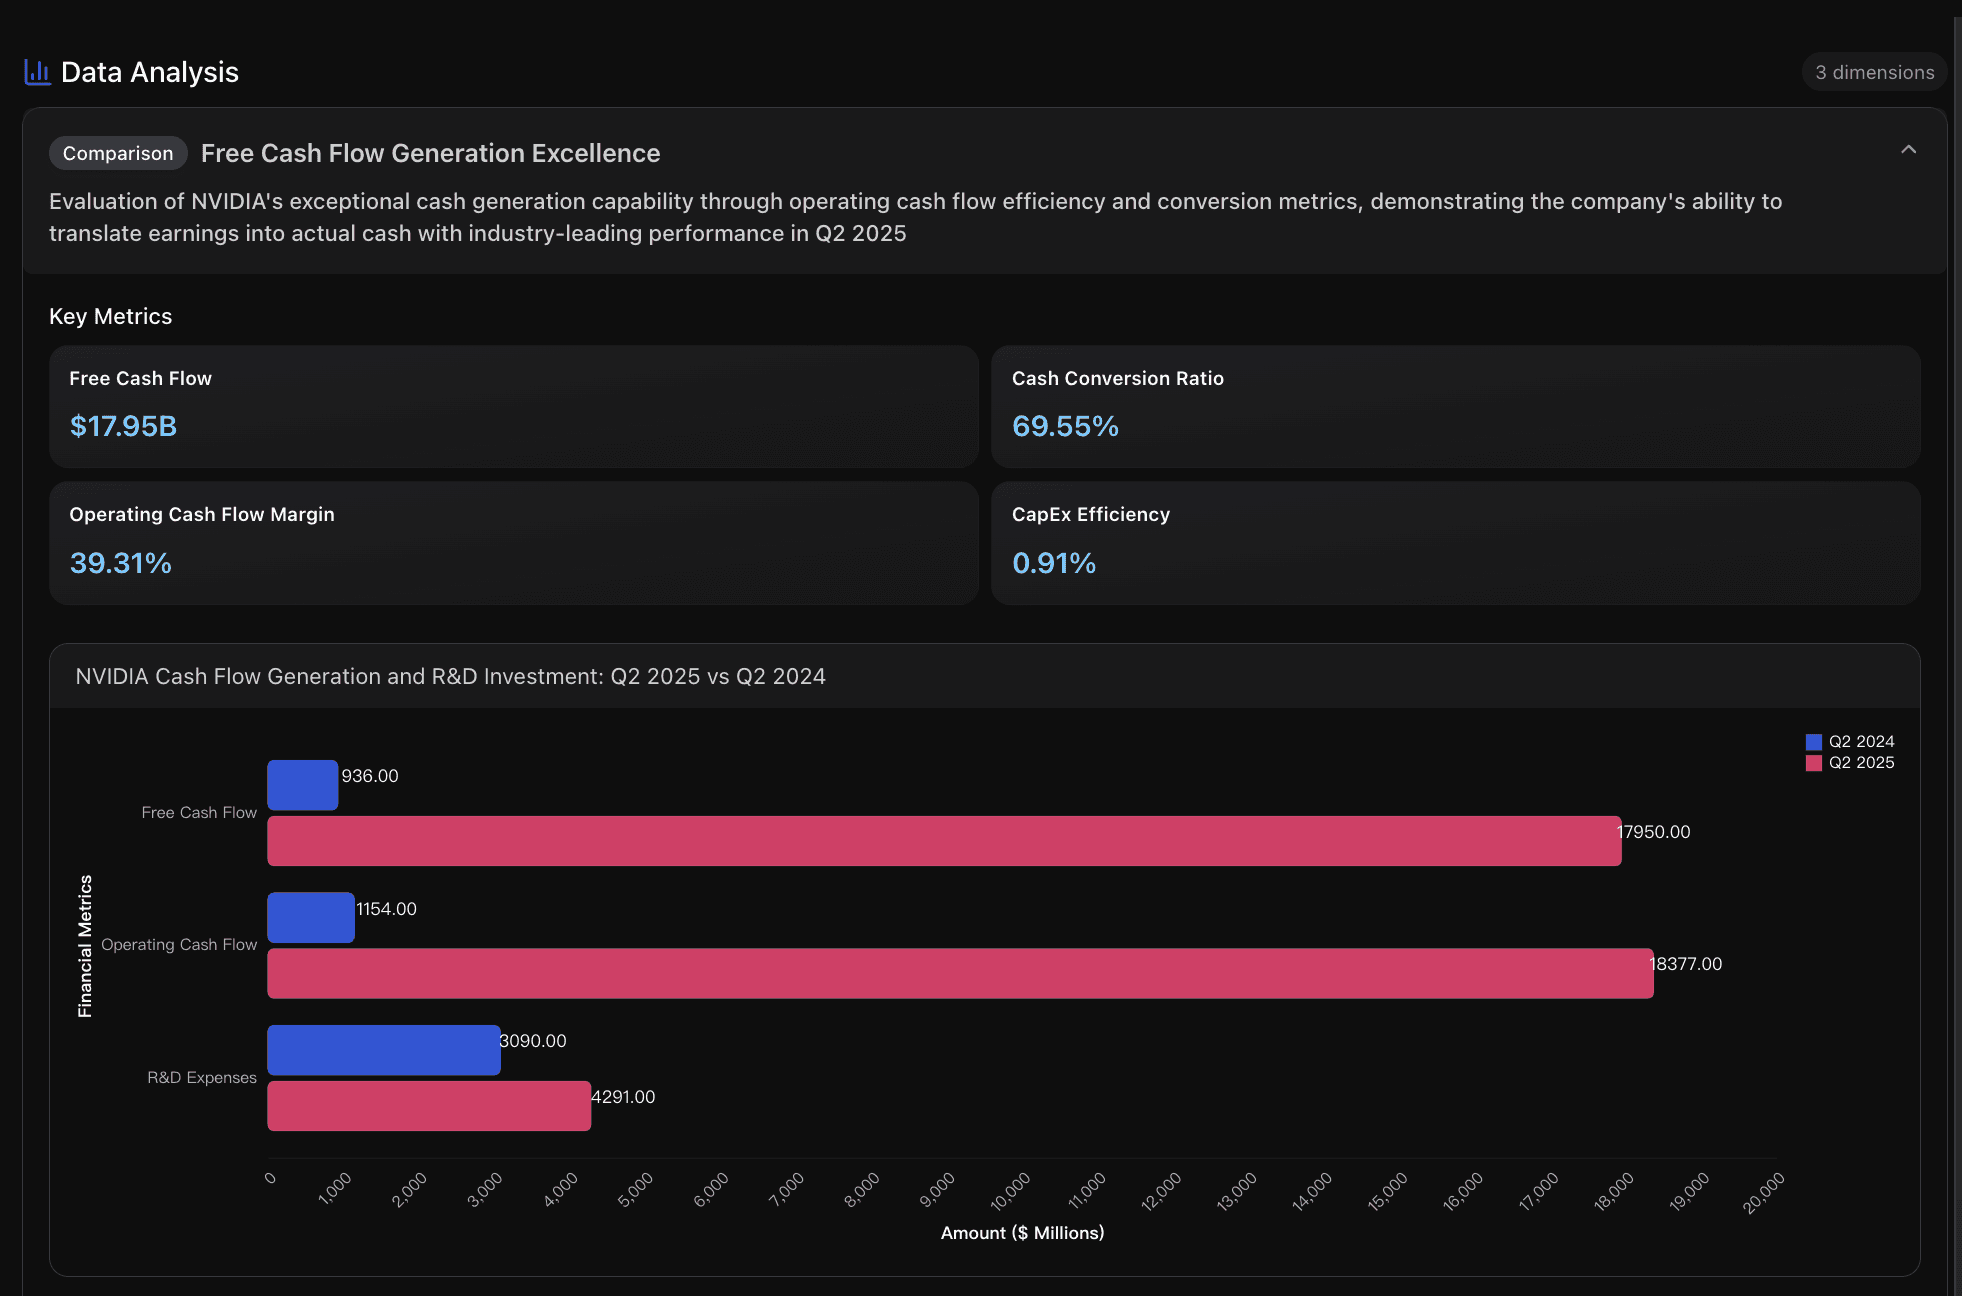
This node provides a comprehensive evaluation of free cash flow conversion, R&D investment returns, and shareholder value creation through massive share buyback programs.
Key Metrics
Free Cash Flow
Q2 2025 free cash flow reached $17.95B, representing an extraordinary 1,818% YoY growth from $936M in Q2 2024. This exceptional performance significantly outpaces semiconductor industry benchmarks where typical free cash flow margins range 15-25%, positioning NVIDIA among the top-tier cash generators in technology.
R&D Intensity
R&D intensity decreased to 9.18% in Q2 2025 from 10.29% in Q2 2024, indicating improved efficiency despite absolute R&D spending growth of 38.87% YoY. This optimization compares favorably to industry averages of 12-18% for leading semiconductor companies, showing NVIDIA's strong revenue scaling.
H1 2025 Returns
NVIDIA returned $24.3B to shareholders in first half of fiscal 2026 through share repurchases and dividends, representing approximately 27% of six-month revenue. This aggressive capital return significantly exceeds technology industry averages of 10-15% of revenue, demonstrating exceptional cash generation and shareholder-friendly capital allocation.
Actionable Insights
Leverage Cash Generation Strength for Diversification: With $17.95B free cash flow generating in a single quarter and 69.55% conversion ratio, NVIDIA should consider strategic acquisitions in adjacent AI markets or vertical integration opportunities. The exceptional cash generation capability provides flexibility to pursue transformative deals worth $5-10B annually while maintaining current shareholder return programs, enabling accelerated market expansion beyond current GPU dominance.
Optimize Share Buyback Timing Strategy: The massive $74.7B total authorization provides unprecedented flexibility for tactical execution. Implement a systematic approach that accelerates repurchases during market volatility periods when shares trade below intrinsic value, while moderating buybacks during peak valuations. This could enhance per-share value creation by 20-30% compared to linear execution, maximizing shareholder wealth while preserving cash for growth investments.
Establish R&D Investment Floor with Efficiency Targets: Despite improving R&D intensity to 9.18%, maintain minimum annual R&D spending growth of 25-30% to preserve technological leadership while targeting further efficiency gains. Set specific ROI metrics requiring each $1B incremental R&D investment to generate $8-10B additional revenue within 3 years, ensuring continued innovation leadership while maximizing returns on research capital deployed across AI, autonomous vehicles, and emerging computing paradigms.
Visualization
Here is a data visualization example:
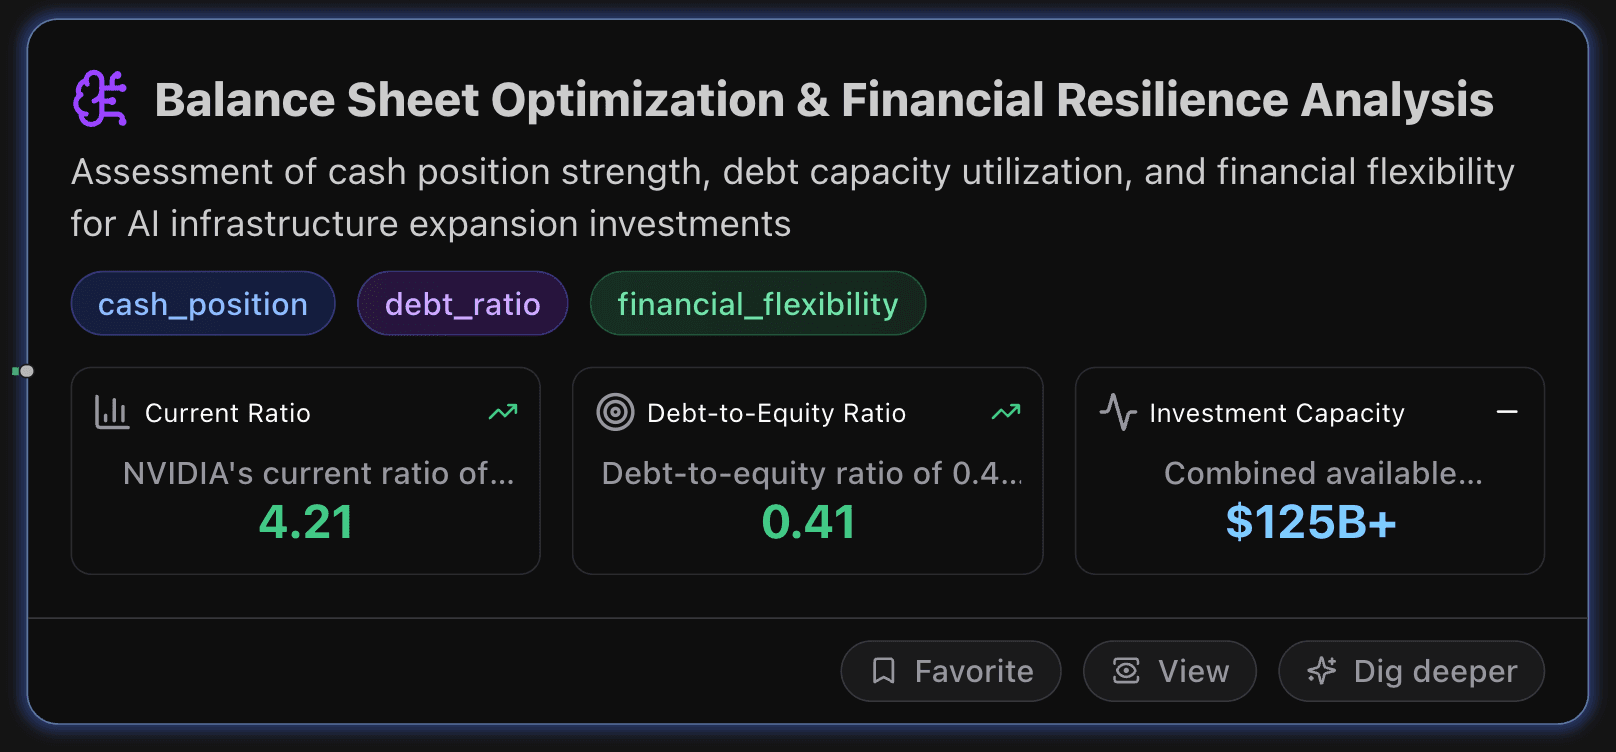
Balance Sheet Optimization & Financial Resilience Analysis
This node assesses cash position strength, debt capacity utilization, and financial flexibility for AI infrastructure expansion investments.
Key Metrics
Current Ratio
NVIDIA's current ratio of 4.21 significantly exceeds the semiconductor industry benchmark of ~2.0, indicating exceptional ability to meet short-term obligations. This ratio demonstrates that current assets can cover current liabilities over 4 times, providing substantial buffer for operational flexibility and unexpected capital requirements in AI infrastructure development.
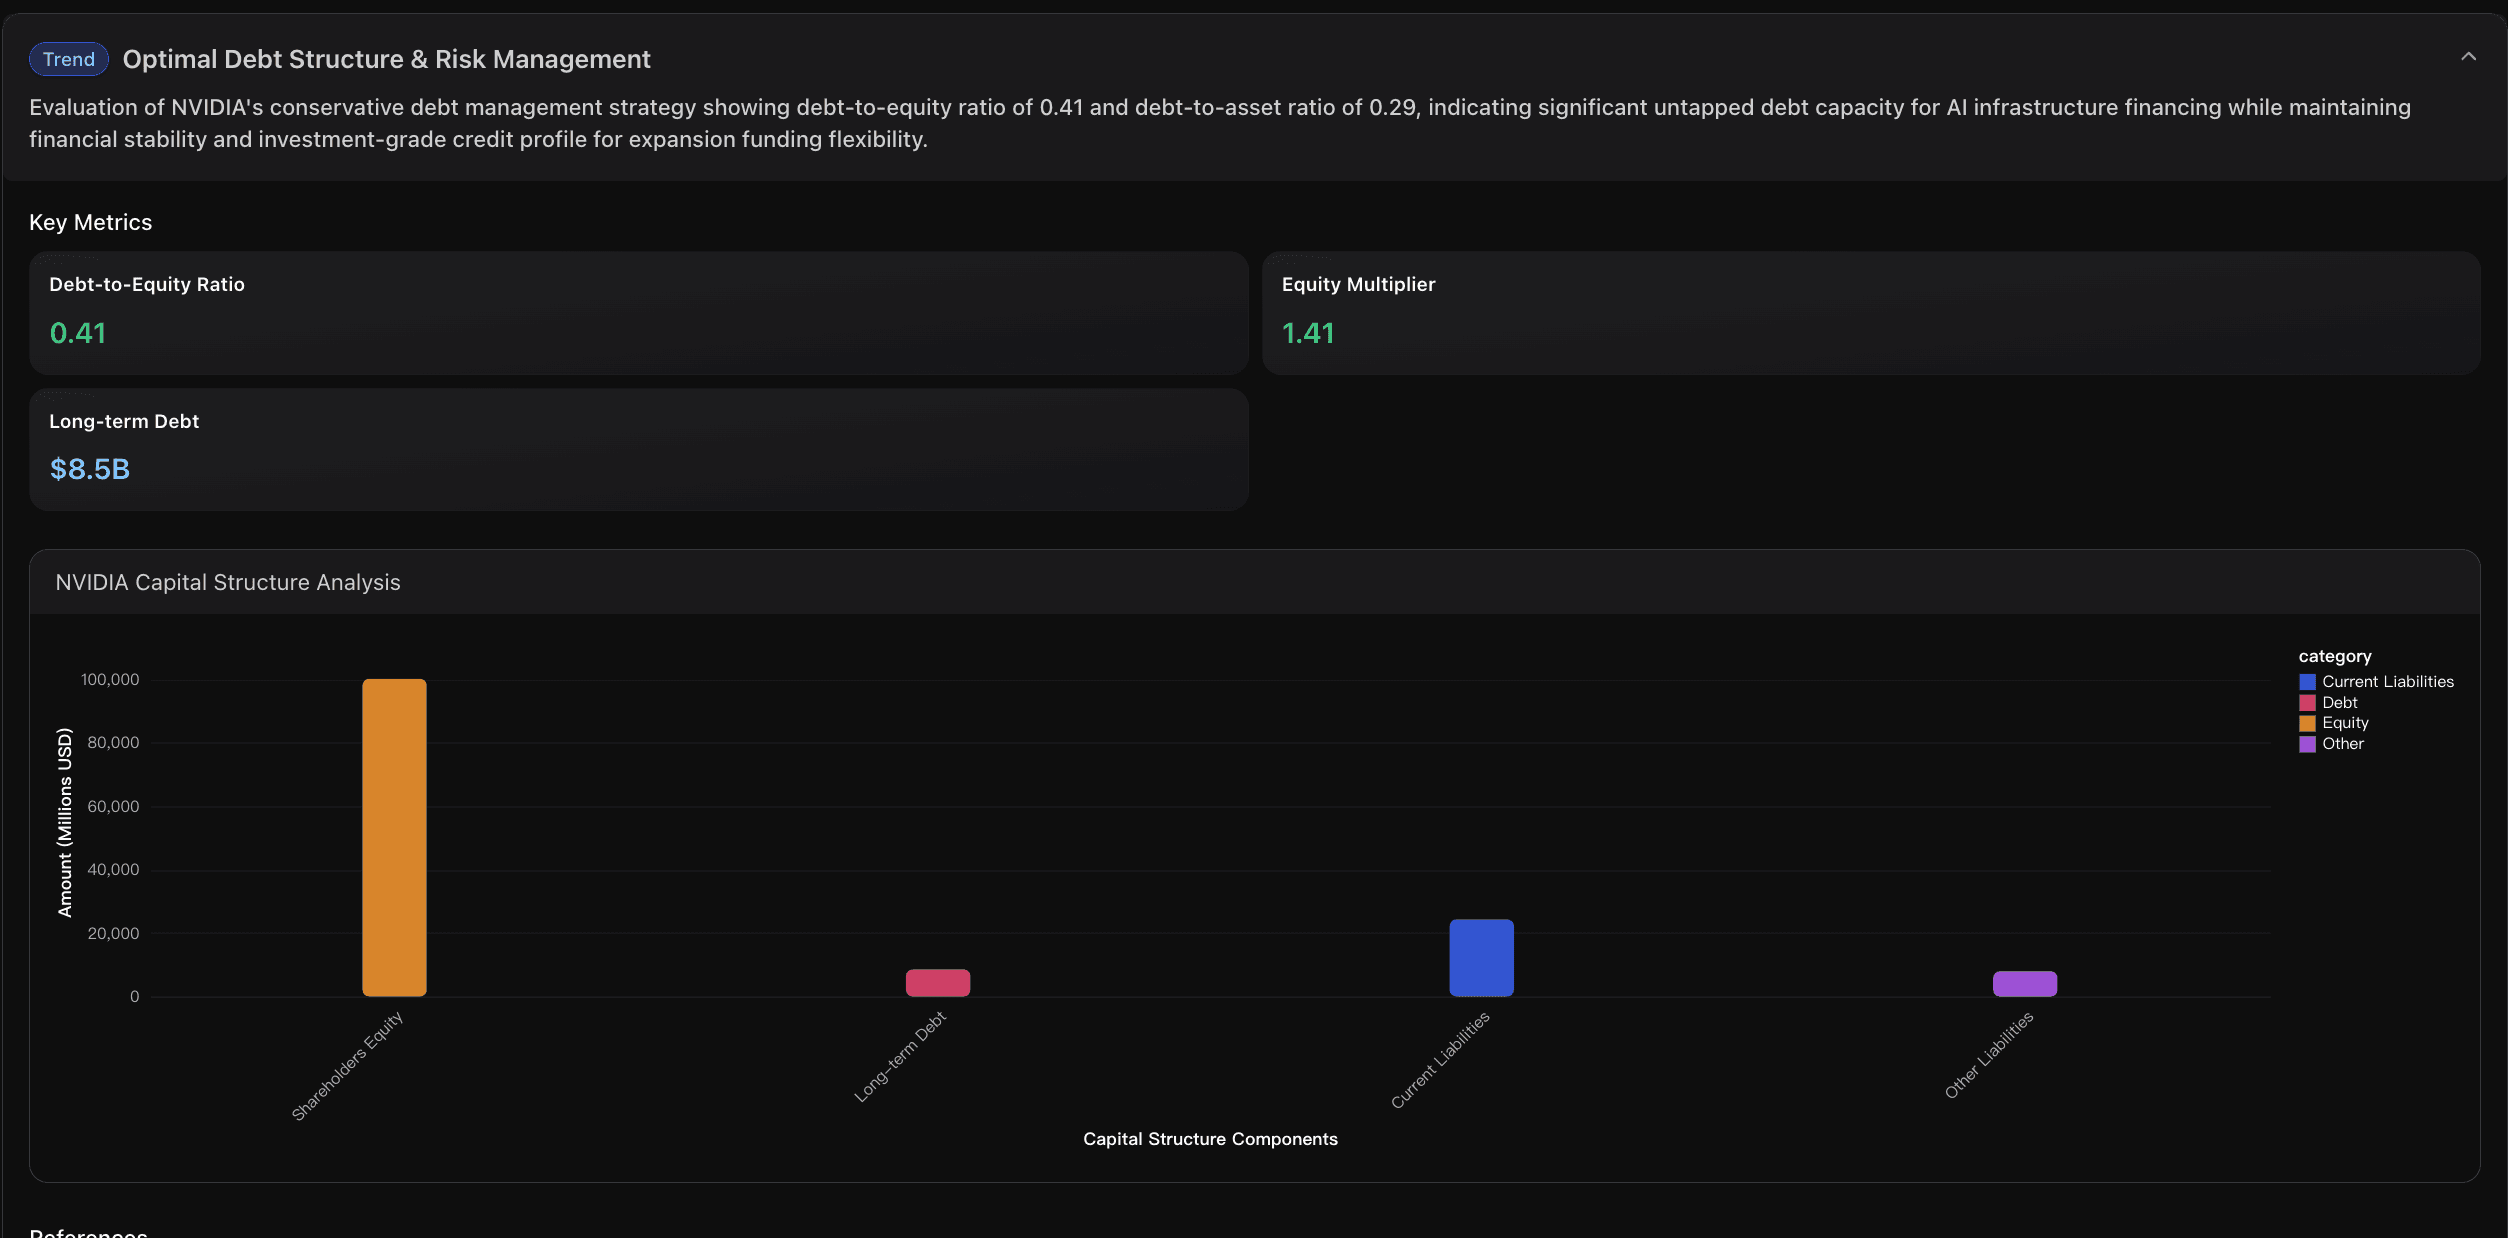
Debt-to-Equity Ratio
Debt-to-equity ratio of 0.41 reflects conservative capital structure with total liabilities of $40.6B against shareholders' equity of $100.1B. This moderate leverage provides substantial capacity to increase debt financing for AI infrastructure investments while maintaining strong credit ratings and financial flexibility for strategic initiatives.
Investment Capacity
Combined available investment capacity exceeds $125B through existing cash position ($56.8B) plus conservative debt capacity estimate ($70B) based on industry leverage benchmarks. This substantial capacity enables major AI infrastructure projects, strategic acquisitions, and R&D investments without compromising financial stability or operational flexibility.
Actionable Insights
Leverage Conservative Debt Structure for Strategic Expansion: With debt-to-equity ratio of only 0.41 compared to industry average of 0.8-1.2, NVIDIA should consider increasing leverage to 0.6-0.7 range to fund major AI infrastructure projects. This could unlock $30-50B additional capital while maintaining investment-grade credit rating, enabling aggressive market capture in rapidly expanding AI infrastructure market without depleting cash reserves needed for operational flexibility.
Optimize Cash Deployment for Infrastructure Investments: Current $56.8B cash position represents significant opportunity cost in low-yield instruments. Recommend deploying $25-35B of excess cash into high-return AI infrastructure investments including data center expansion, chip manufacturing capacity, and strategic technology acquisitions. Maintain $20-25B minimum cash buffer for operational security and market volatility protection.
Establish Strategic Credit Facilities for Market Opportunities: Given exceptional 4.21x current ratio and minimal debt burden, NVIDIA should establish $20-30B revolving credit facilities and term loan commitments to capture time-sensitive AI market opportunities. This pre-arranged financing capacity would enable rapid response to strategic acquisitions, infrastructure projects, or supply chain securing investments without lengthy capital raising processes during competitive bidding situations.
Visualization
Here is a data visualization example:
Step 3. Convert the Analysis Results into PPT
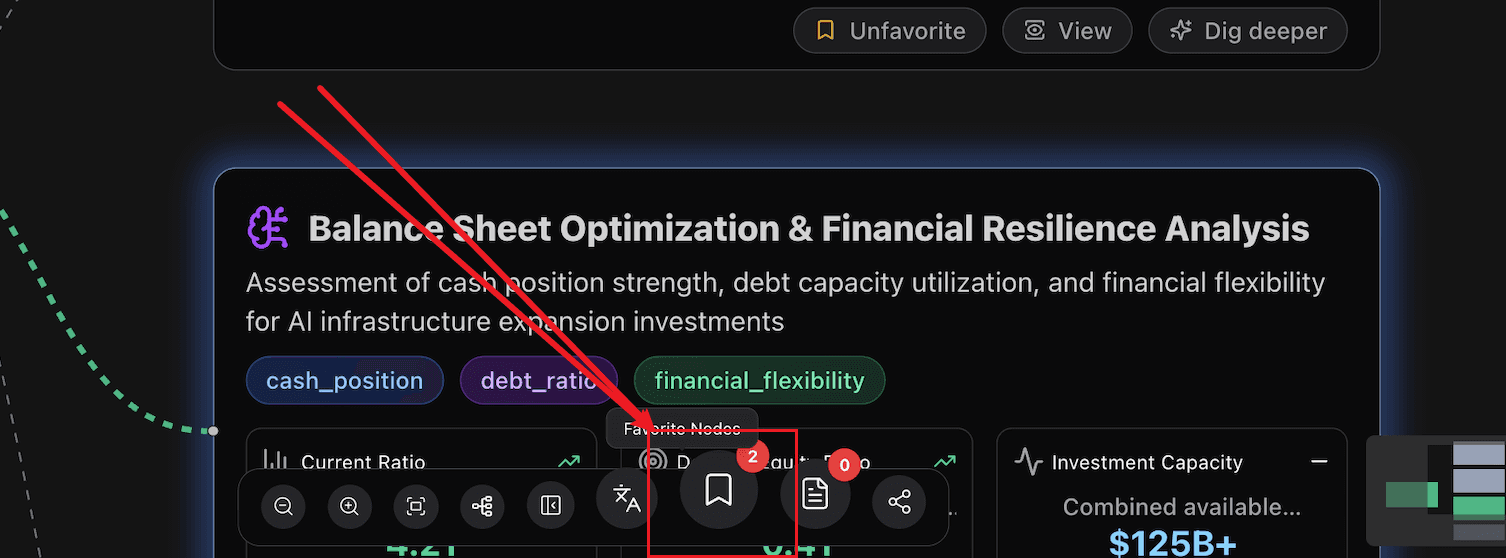
Add the nodes that you want to include in your presentation into the Favorites directory.
Click the Favorite Nodes button at the bottom of the page.
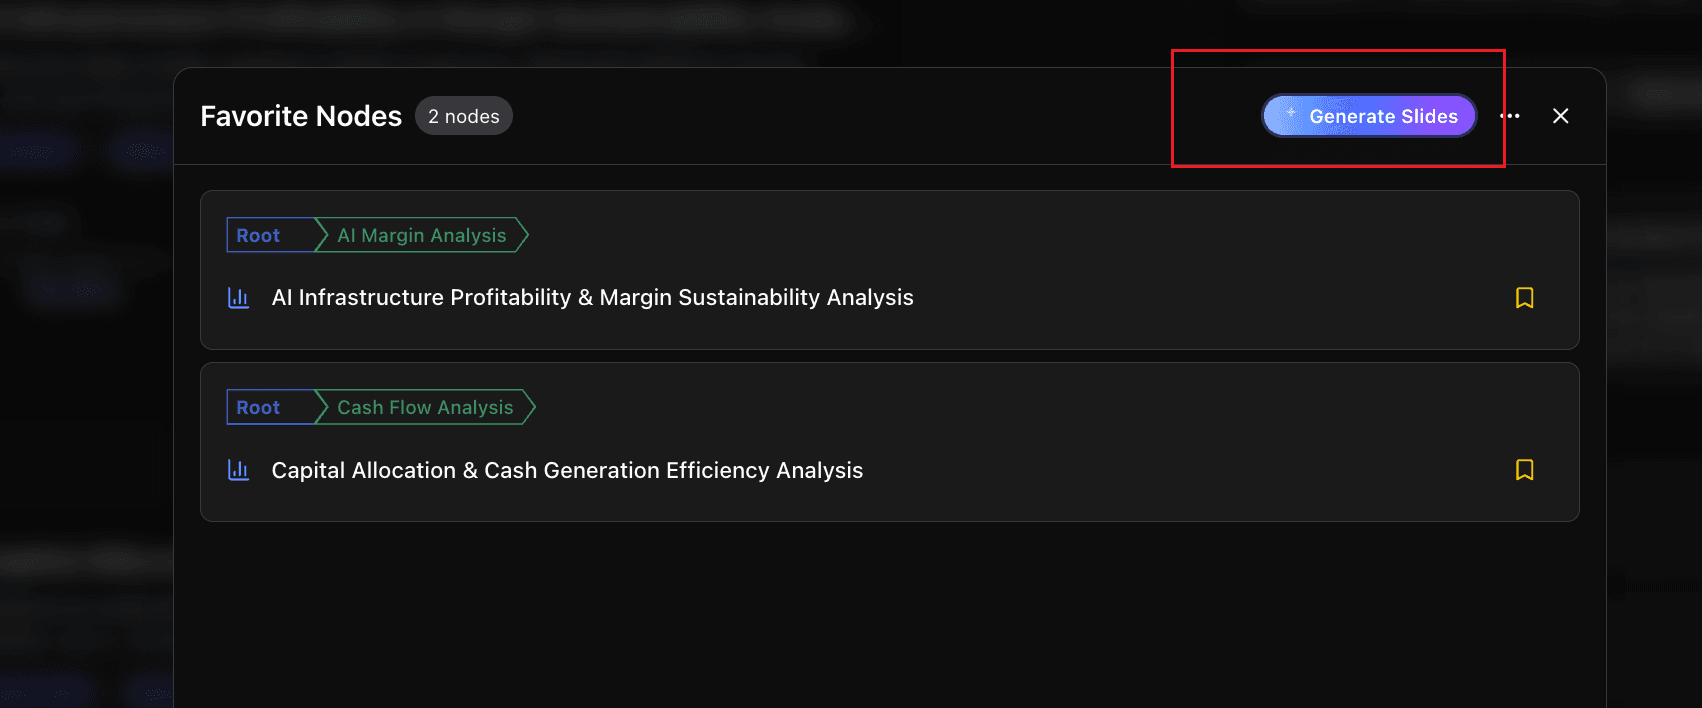
Click Generate Slides.
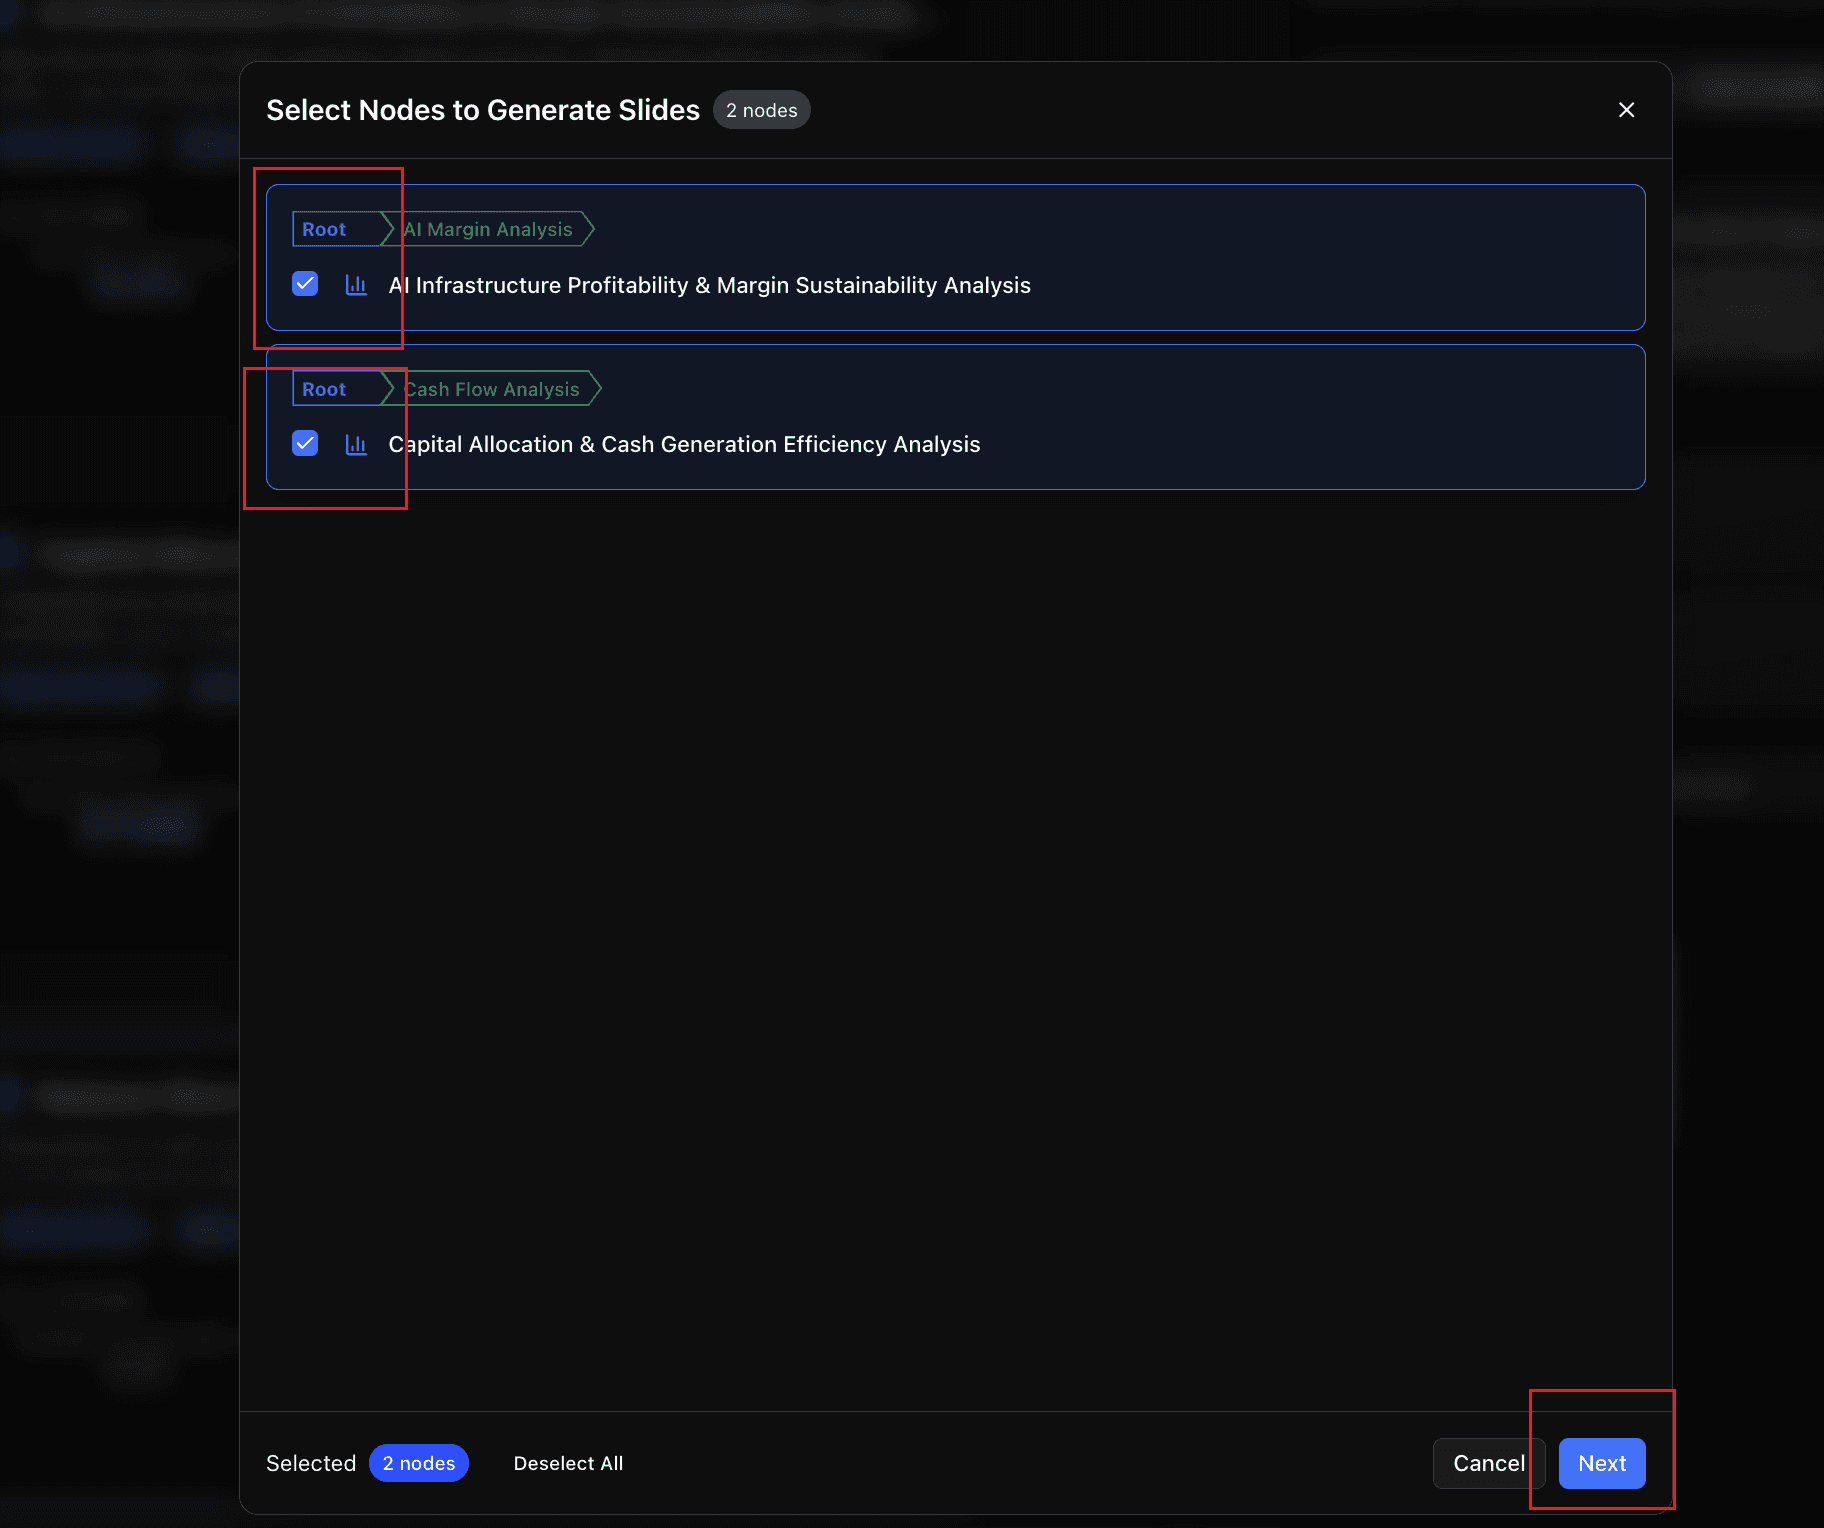
Select the target nodes and click Next.
Choose a theme and click Start Generating Slides.
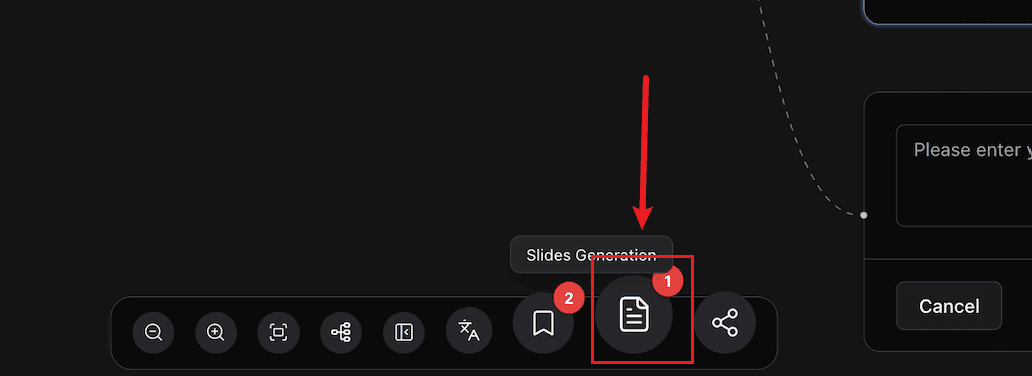
After the slides are generated, you can click the Slides Generation button at the bottom of the page to download the PPT.
Conclusion
Building a great presentation shouldn’t take hours of formatting, editing, and rearranging — it should be as simple as turning your insights into a story. Powerdrill Bloom makes that possible.
By combining intelligent data understanding with automated design, Bloom transforms static files into dynamic, presentation-ready decks in just a few clicks. Whether you’re preparing a class presentation, a business report, or a research summary, Bloom saves you time while ensuring your message is clear, visual, and impactful.
No more manual slide creation. No more design stress. Just upload, generate, and present — effortlessly.
Try Powerdrill Bloom today and experience how AI can help you create beautiful, data-driven presentations from your files in seconds.


