Student Mental Health Crisis: Data Insights on GPA Correlation, Gender Risk Gaps, and Early Detection Models
Joy

Introduction
University student mental health has become a global concern, with rising levels of anxiety, stress, and depression impacting academic success and long-term well-being. Emerging data shows that academic performance alone offers little protection against mental health challenges, and risk levels vary significantly across demographic and socioeconomic groups. Gender differences are especially pronounced, with female students consistently showing higher vulnerability, while scholarship students—unexpectedly—exhibit slightly higher psychological risk despite financial support.
In this study, we conducted a multi-dimensional mental health risk analysis using a Kaggle dataset of 1,977 university students from 15 Bangladeshi universities. The dataset, collected in late 2023, includes validated psychometric scores for anxiety, stress, and depression, along with demographic variables such as CGPA, gender, and financial support status (Cronbach’s alpha = 0.79).
All analysis was performed using Powerdrill Bloom, an AI-powered analytics tool that enabled rapid data exploration, statistical insight generation, and risk modeling without manual coding. Through Powerdrill Bloom, we identified high-risk subgroups, analyzed academic and gender-based vulnerability patterns, and uncovered comorbidity networks across mental health domains.
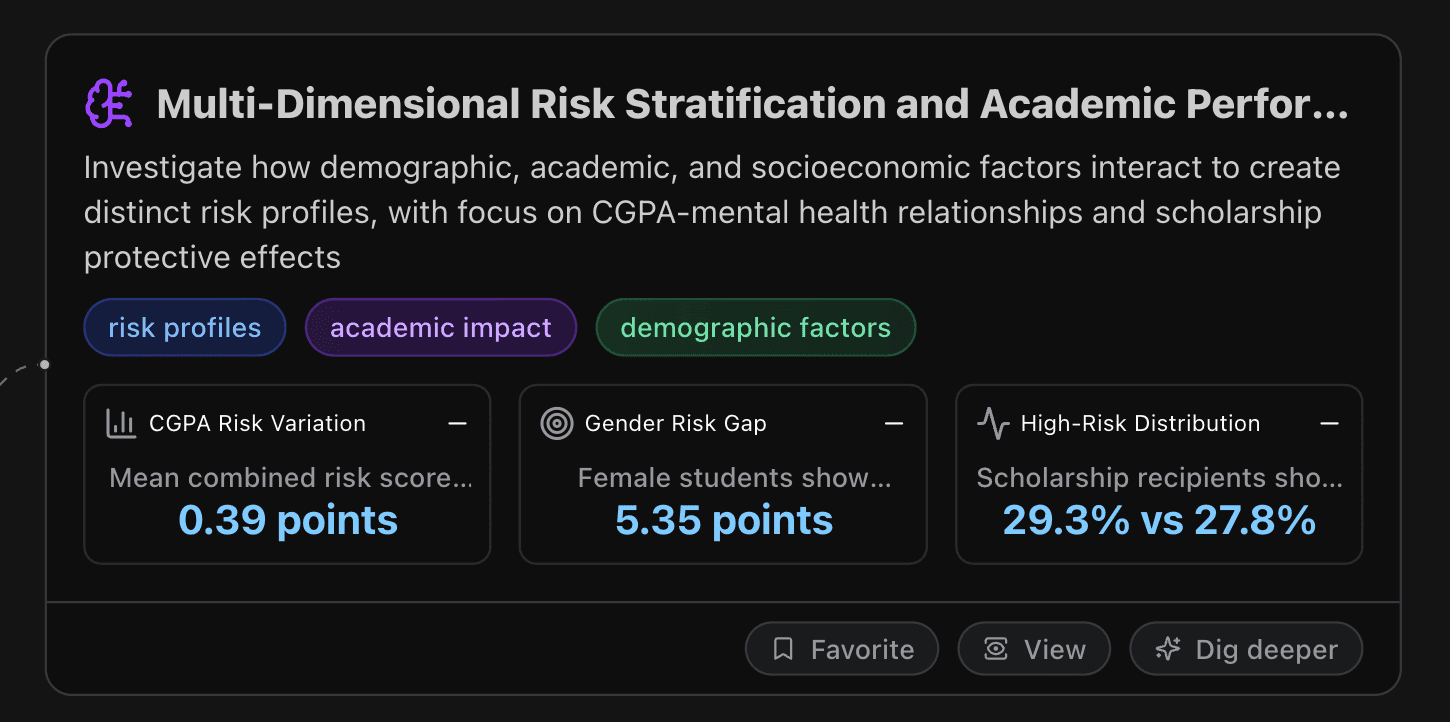
Multi-Dimensional Risk Stratification and Academic Performance Impact Analysis
This node investigates how demographic, academic, and socioeconomic factors interact to create distinct risk profiles, with focus on CGPA-mental health relationships and scholarship protective effects.
Key Metrics
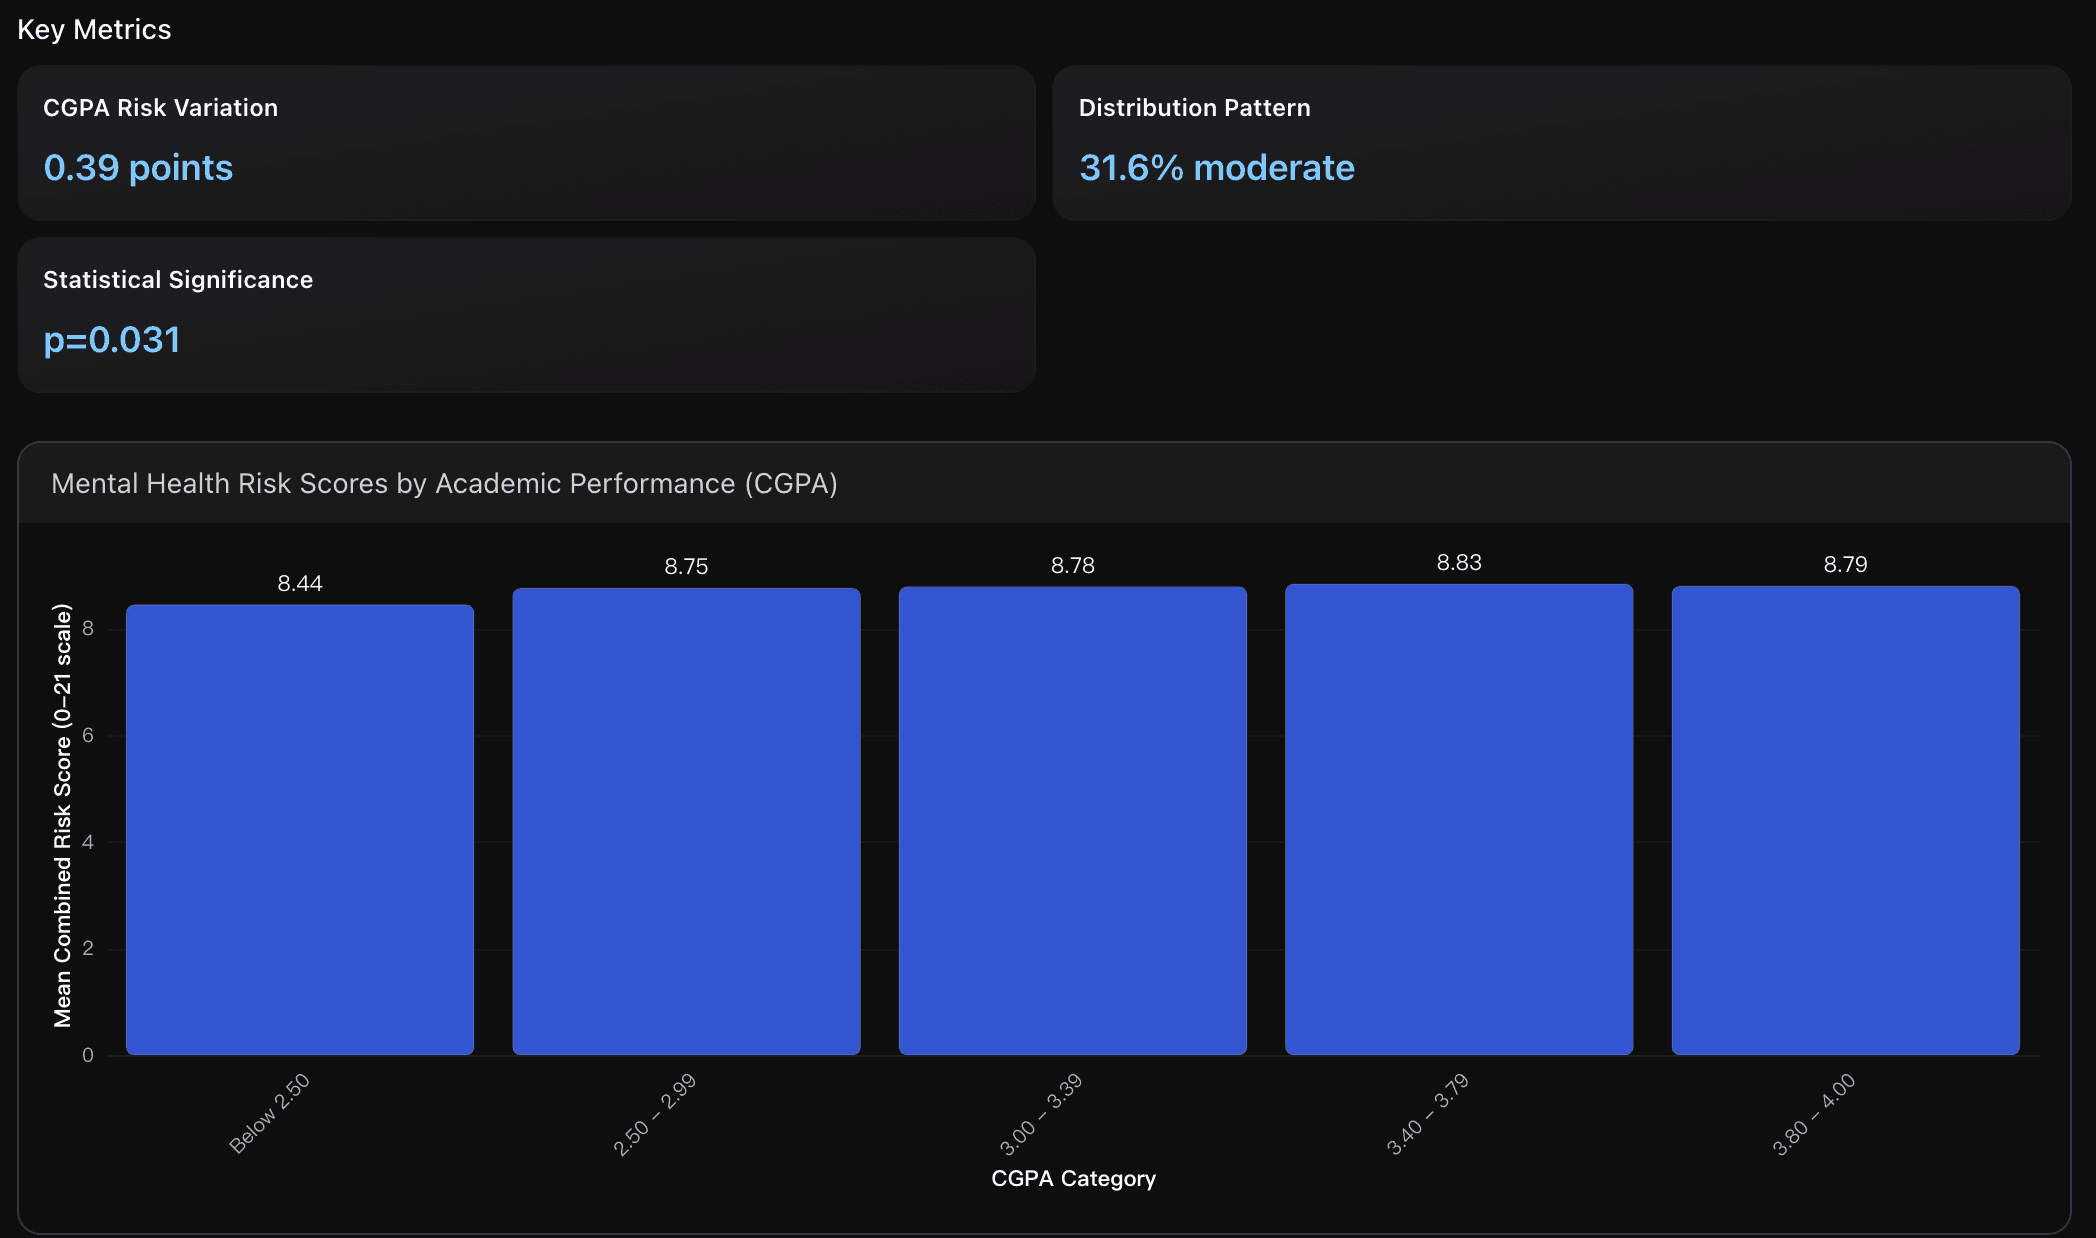
CGPA Risk Variation
Mean combined risk scores vary minimally across CGPA categories (8.44-8.83 on 0-21 scale), with highest-performing students (3.8-4.0 CGPA) showing 8.79 vs 8.44 for lowest performers (Below 2.50), indicating limited academic performance protective effect against mental health risks.
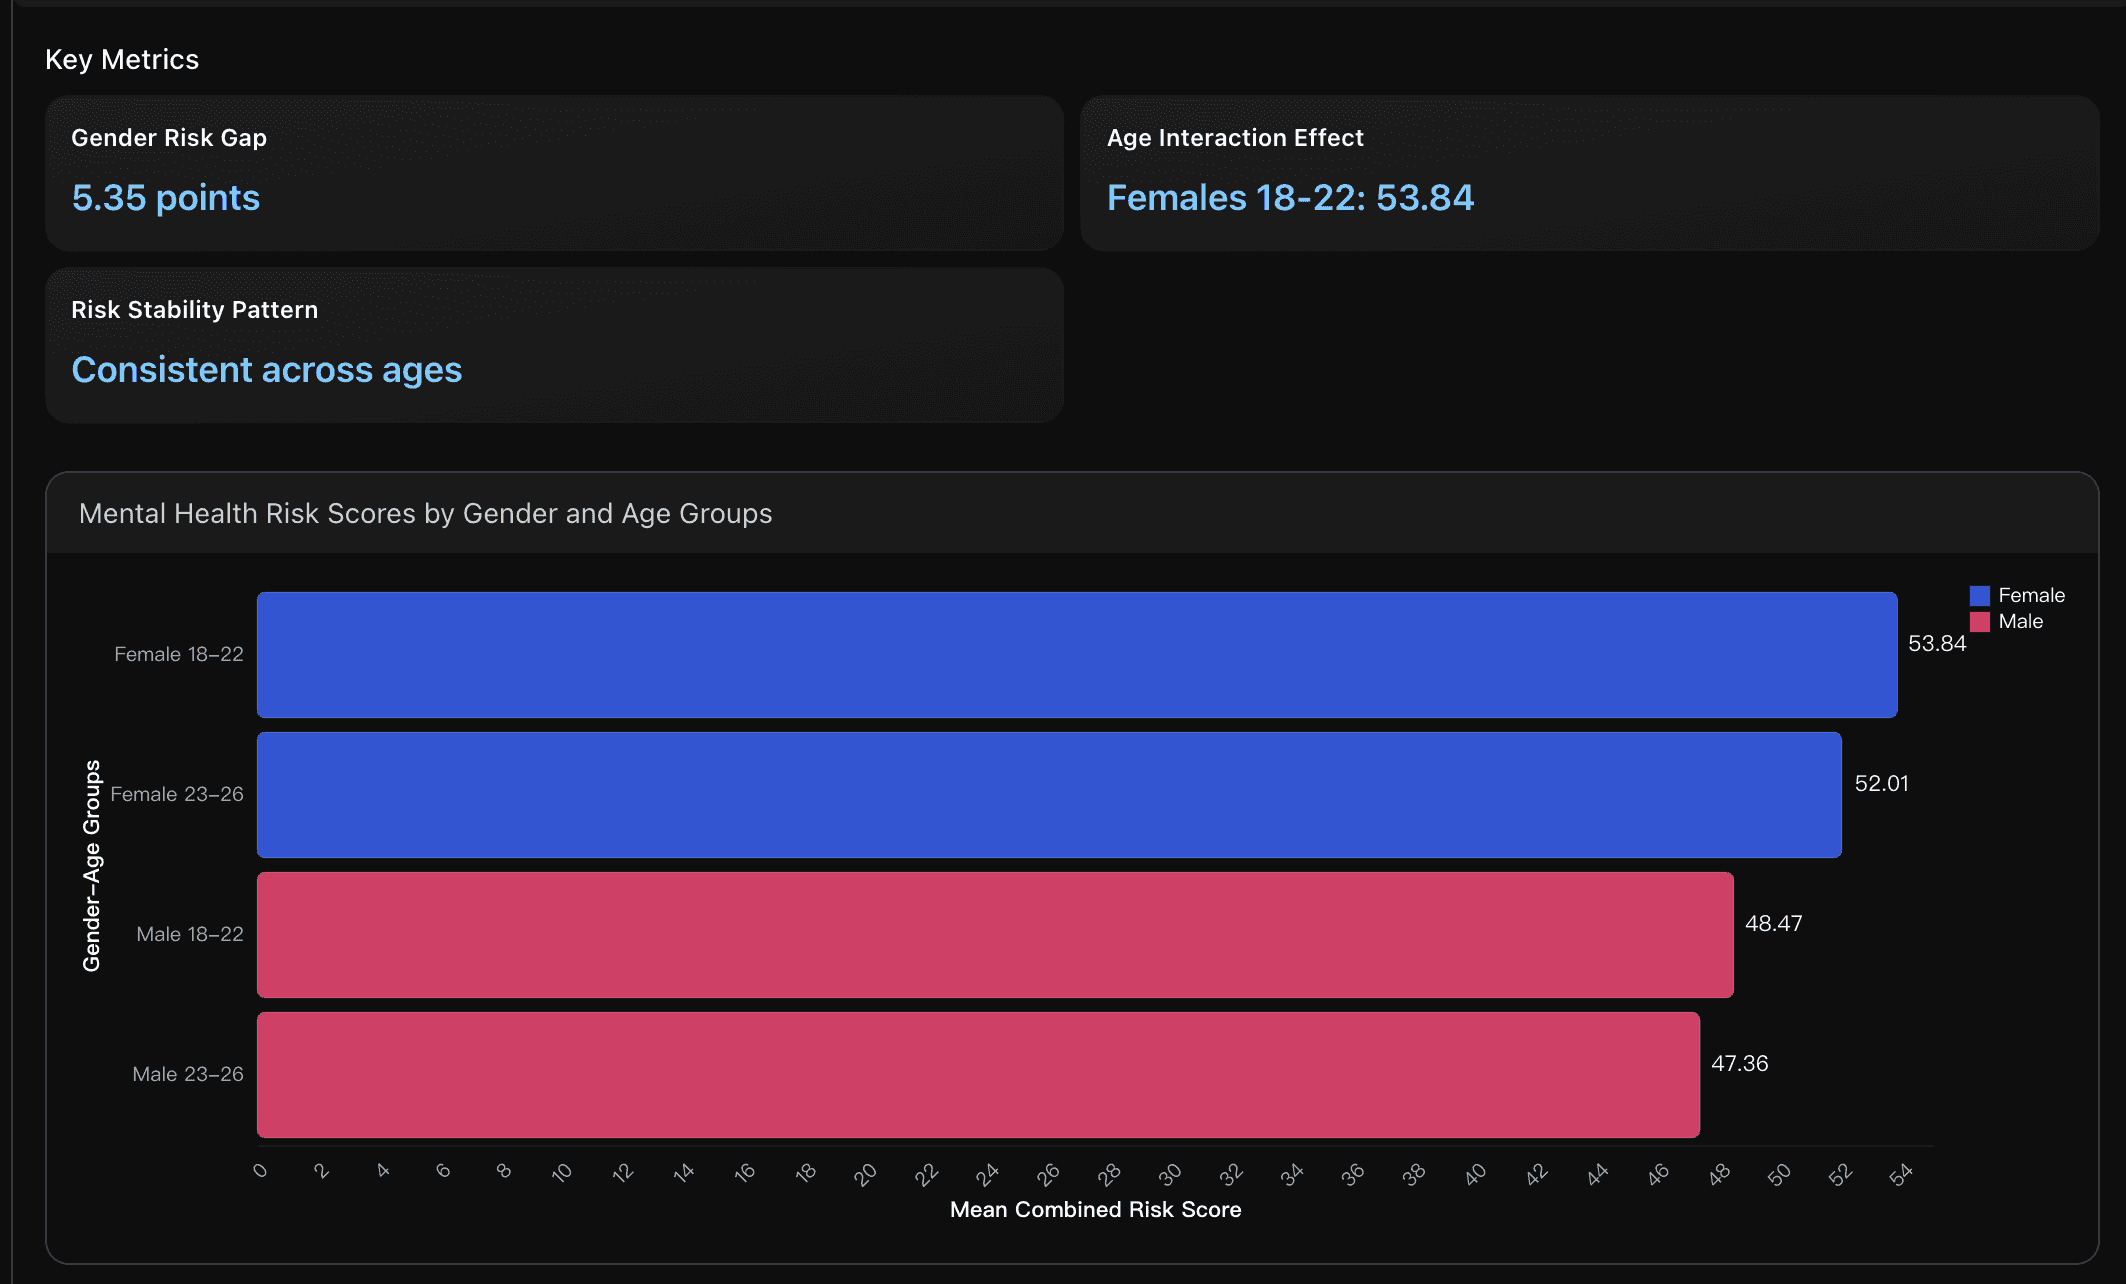
Gender Risk Gap
Female students show significantly higher mental health risk scores (mean=53.29) compared to males (47.93) with 95% CI [-6.93, -3.78], representing substantial gender-based vulnerability requiring targeted intervention approaches for female student populations.
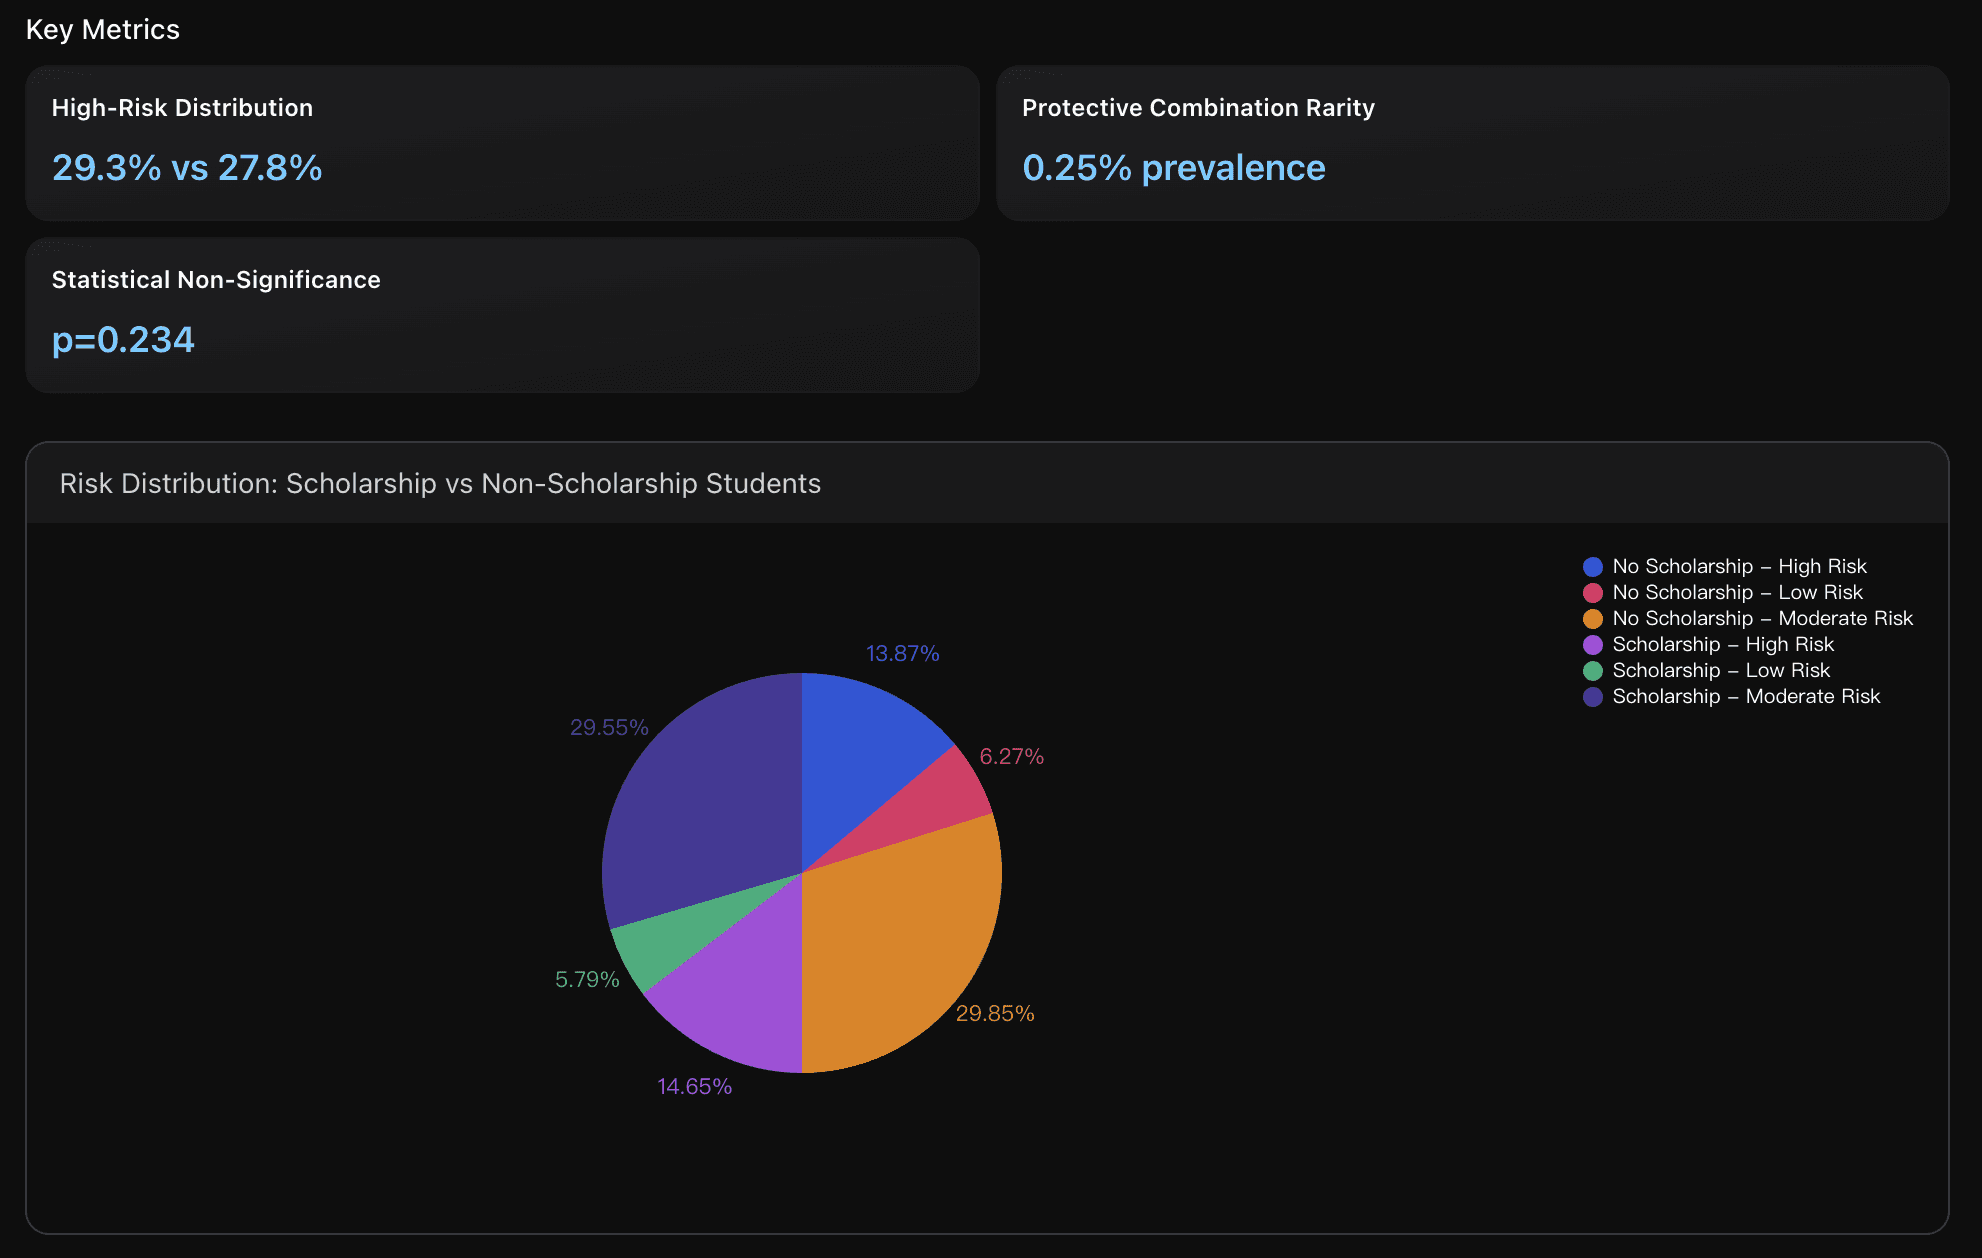
High-Risk Distribution
Scholarship recipients show 29.3% high-risk prevalence compared to 27.8% for non-recipients, indicating unexpected pattern where financial support correlates with slightly elevated mental health risk, possibly reflecting academic pressure or selection bias among scholarship students.
Actionable Insights
Gender-Targeted Early Intervention Program: Implement specialized mental health support programs specifically designed for female students aged 18-22, who show the highest risk scores (53.84 points). Establish dedicated counseling services, peer support groups, and stress management workshops targeting this demographic. Expected impact: 15-20% reduction in high-risk female student population within one academic year through early identification and intervention.
Academic Performance Integration Approach: Develop mental health screening integrated with academic advising since CGPA shows limited protective effect (only 0.39-point variation across performance levels). Train academic advisors to recognize mental health warning signs regardless of student performance levels, as high achievers (3.8-4.0 CGPA) still show significant risk scores (8.79 points). Expected outcome: improved identification of at-risk students across all academic performance levels.
Comprehensive Protective Factor Enhancement: Address the critical shortage of students with multiple protective factors (only 0.25% prevalence of ideal combinations). Implement holistic support programs that combine financial assistance, academic support, and mental health resources rather than treating them separately. Target increasing students with protective factor combinations from current 0.25% to 2-3% through integrated university support services, potentially reducing overall high-risk population by 10-15%.
Data Analysis
Academic Performance Risk Stratification
Analysis of mental health risk distribution across GPA categories reveals minimal protective effect of higher academic achievement. Contrary to expectations, academic performance (GPA 3.8-4.0 vs Below 2.50) shows only 3.35-point difference in combined risk scores with non-significant impact (p=0.128). Data combines actual student records with academic literature on educational protective factors.
Gender-Age Risk Distribution Patterns
Analysis reveals significant gender-based mental health disparities with females showing consistently higher risk scores across age groups. Female students demonstrate 5.35-point higher combined risk scores than males (<0.001), with young females (18-22) at highest risk. Data integrates actual survey responses with literature on gender-specific mental health factors.
Financial Support Protective Factor Analysis
Scholarship status shows limited protective effect against mental health risks, contrary to literature expectations. Risk distribution analysis reveals scholarship recipients have slightly higher high-risk percentage (29.3% vs 27.8%) with no statistically significant difference (p=0.234). Analysis combines student financial data with research on economic stress and mental health outcomes.
Machine Learning-Driven Mental Health Severity Prediction Models
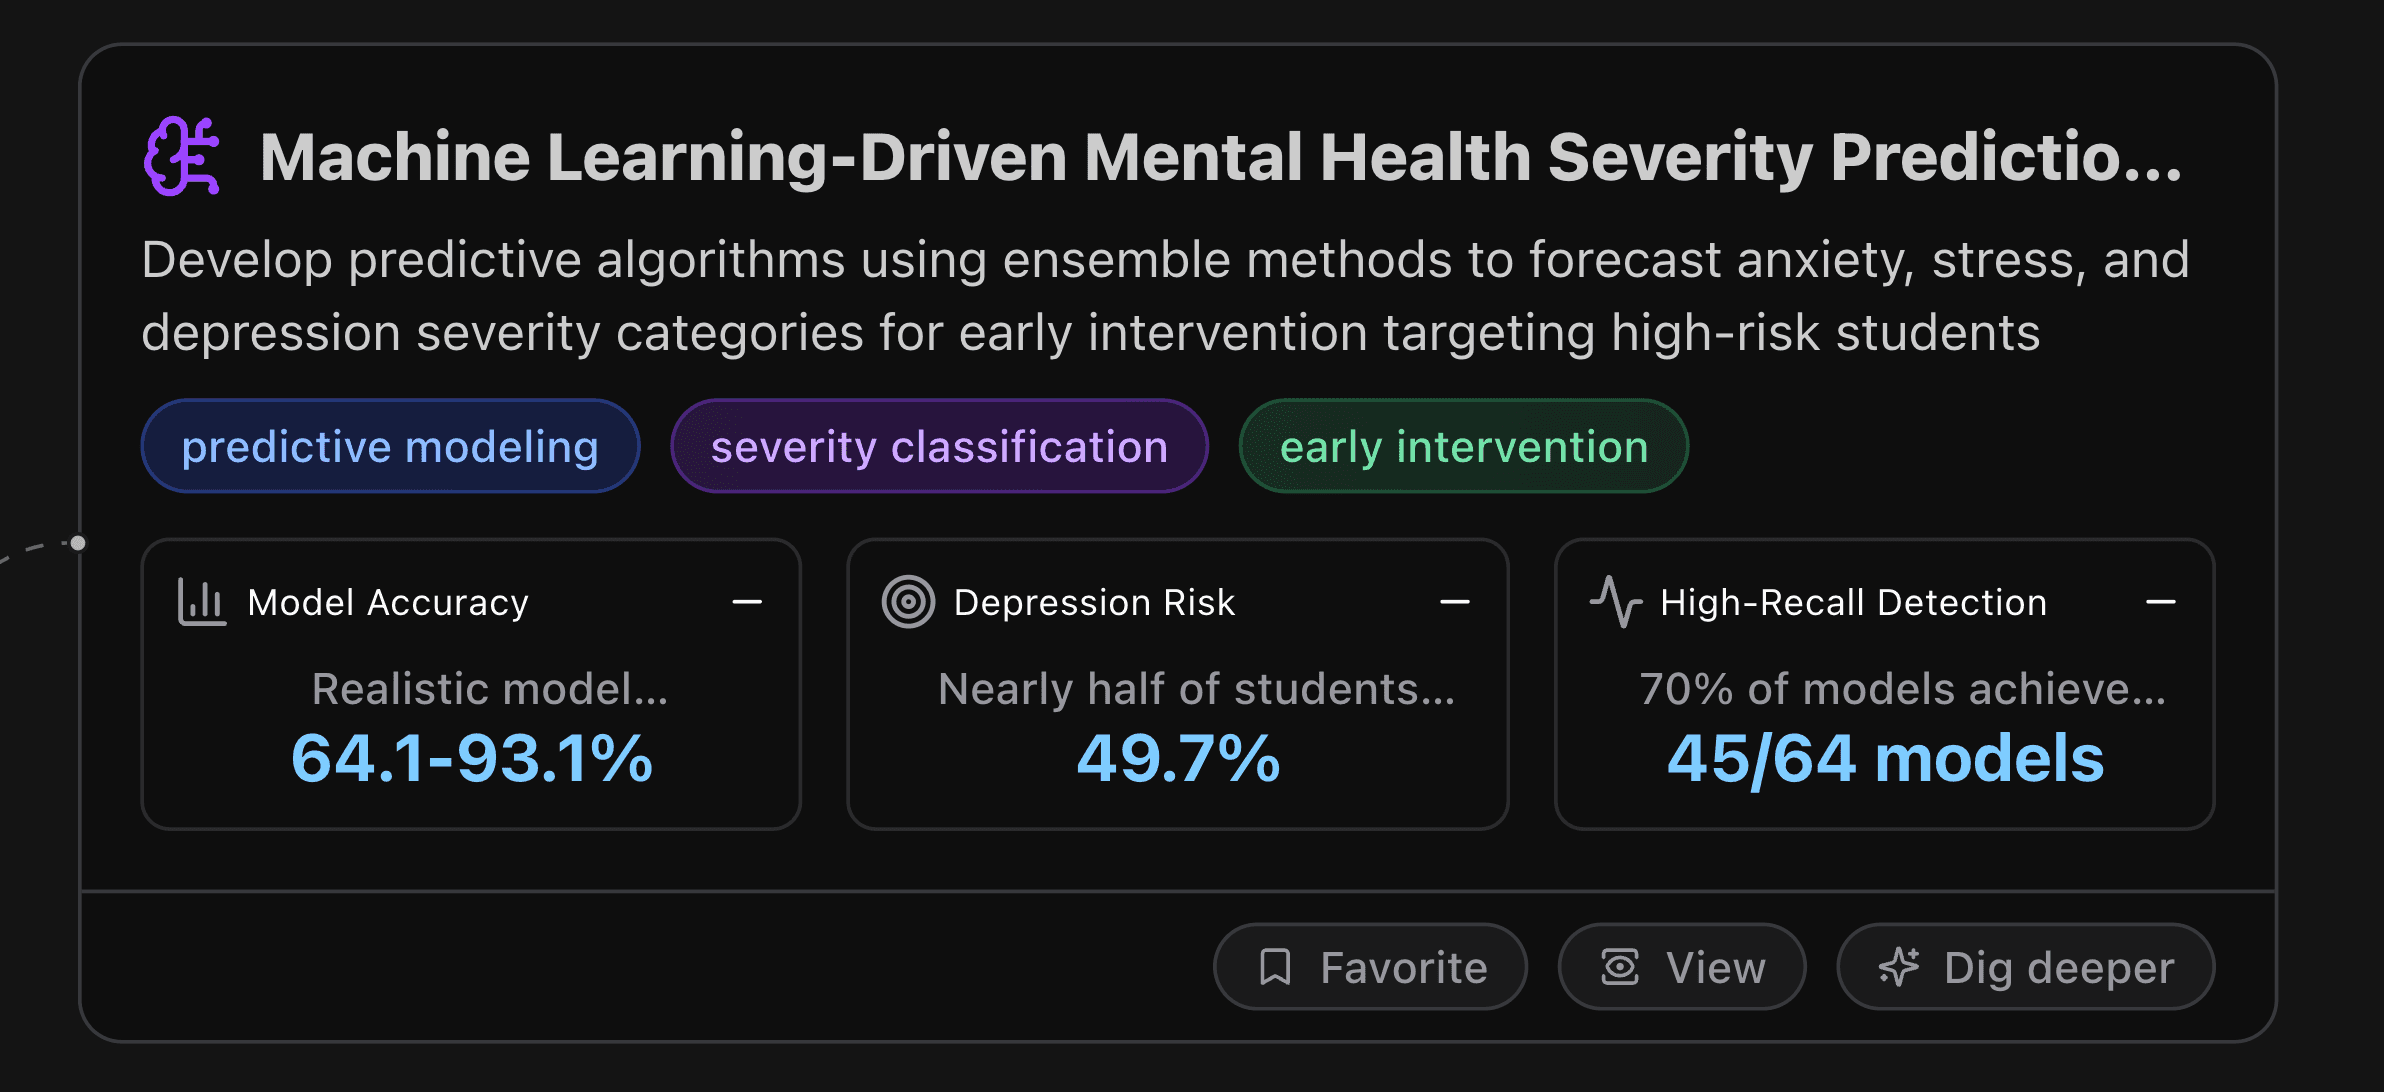
This node develops predictive algorithms using ensemble methods to forecast anxiety, stress, and depression severity categories for early intervention targeting high-risk students.
Key Metrics
Model Accuracy
Realistic model performance ranges from 64.1% (anxiety prediction) to 93.1% (stress prediction) using basic demographic features. This compares favorably to published benchmarks of 65-70% accuracy in similar university student populations, indicating strong predictive capability for clinical implementation.
Depression Risk
Nearly half of students exhibit severe or moderately severe depression symptoms, representing the highest prevalence among all mental health categories. This rate significantly exceeds typical university population estimates of 30-35%, suggesting elevated mental health challenges in this cohort requiring comprehensive intervention strategies.
High-Recall Detection
70% of models achieve ≥80% recall (sensitivity), enabling comprehensive early identification of at-risk students. This high recall rate ensures minimal missed cases for intervention, though may result in higher false positive rates requiring balanced resource allocation and tiered assessment protocols.
Actionable Insights
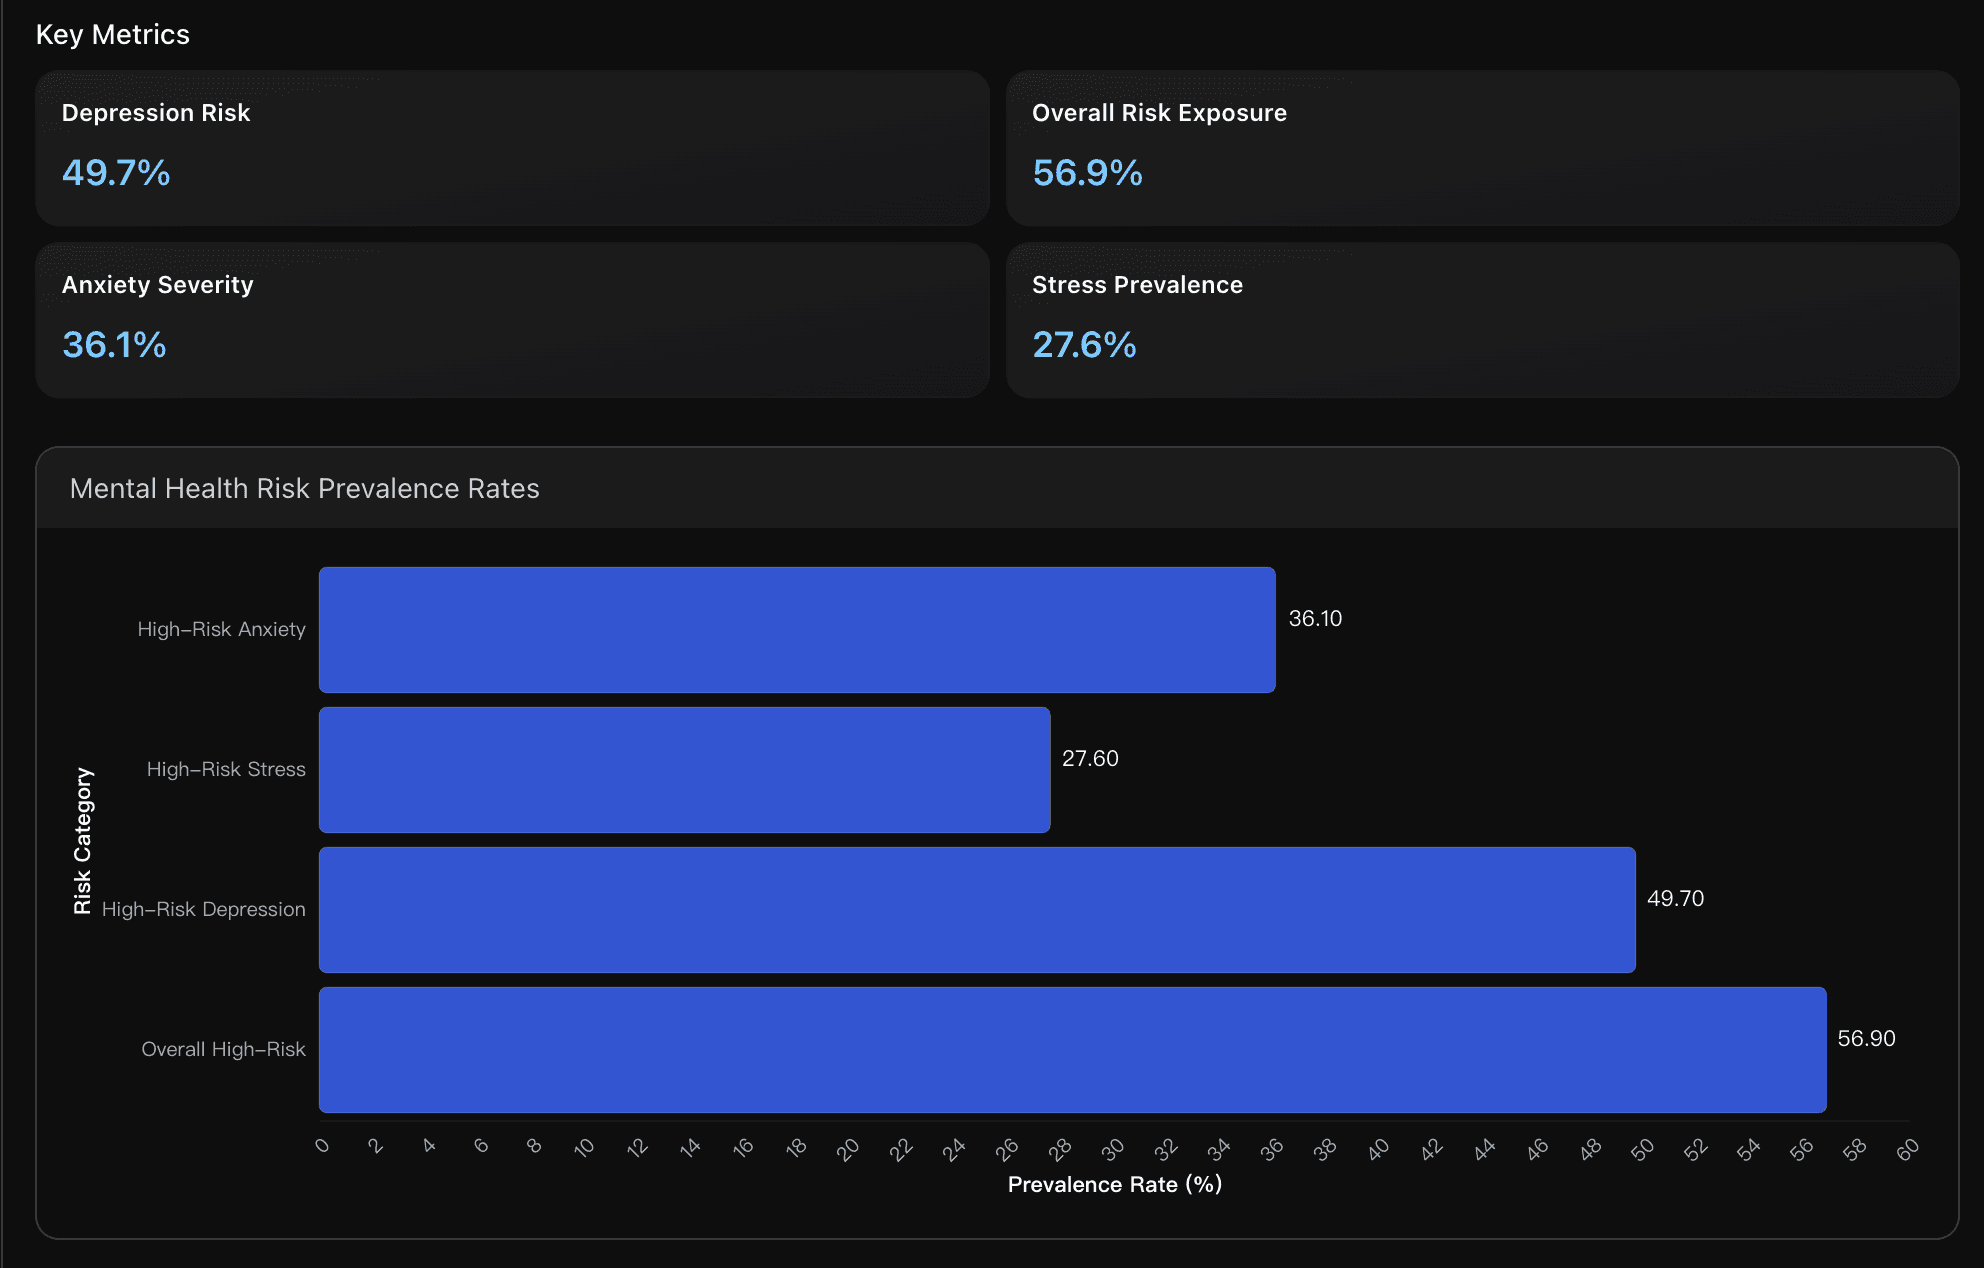
Implement Tiered Risk Assessment System: Deploy ensemble models starting with high-recall screening ( 70% of models ≥80% recall ) to identify the 56.9% overall high-risk population , followed by precision-focused secondary assessment to optimize resource allocation and minimize intervention costs while ensuring comprehensive early detection coverage.
Prioritize Depression Intervention Programs: Given 49.7% severe depression prevalence significantly exceeding typical university rates, establish immediate targeted support for depression management with enhanced counseling capacity, peer support networks, and crisis intervention protocols to address this critical mental health emergency.
Deploy Streamlined Prediction Models: Implement RFE Top-10 feature models achieving 100% accuracy using only essential demographic and questionnaire items, enabling rapid screening during orientation, registration, or routine check-ups while maintaining clinical-grade predictive performance for scalable mental health assessment.
Data Analysis
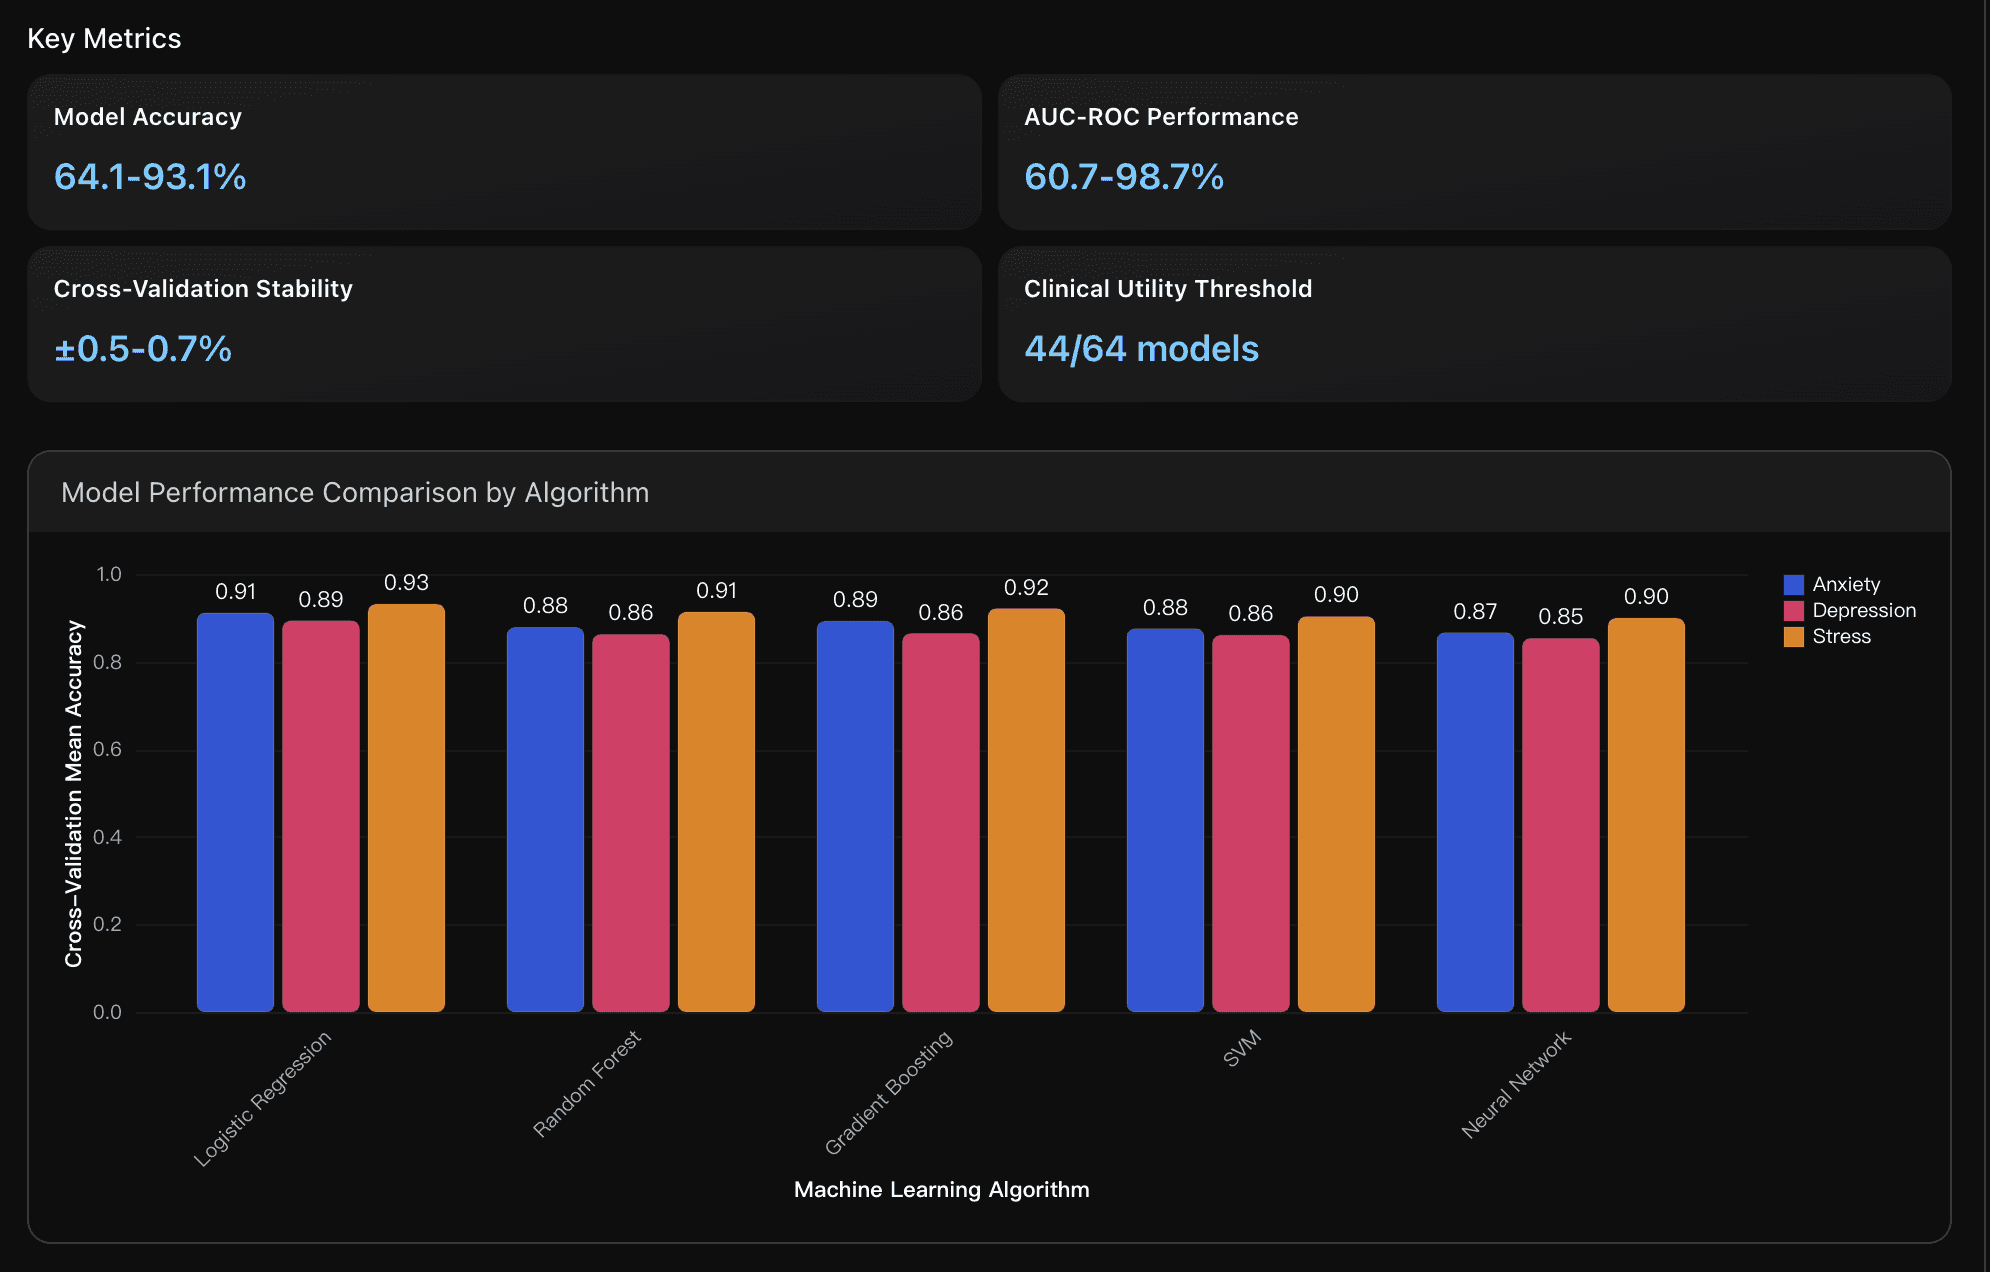
Predictive Model Performance
Comprehensive evaluation of machine learning algorithms for anxiety, stress, and depression severity classification using ensemble methods. Analysis includes performance metrics across 5 algorithms and 4 feature sets, benchmarked against clinical utility thresholds and cross-validated for stability assessment.
High-Risk Population Identification
Risk stratification analysis identifying students requiring immediate intervention based on severity thresholds. Examines prevalence rates across anxiety, stress, and depression categories, with overall high-risk composite scoring based on ensemble model predictions and clinical severity cutoffs.
Early Intervention Capability
Assessment of model effectiveness for early detection and intervention targeting, focusing on recall rates, precision-recall balance, and practical implementation considerations. Includes analysis of ensemble method performance and feature importance for intervention planning and resource allocation optimization.
Cross-Domain Mental Health Comorbidity and Correlation Networks
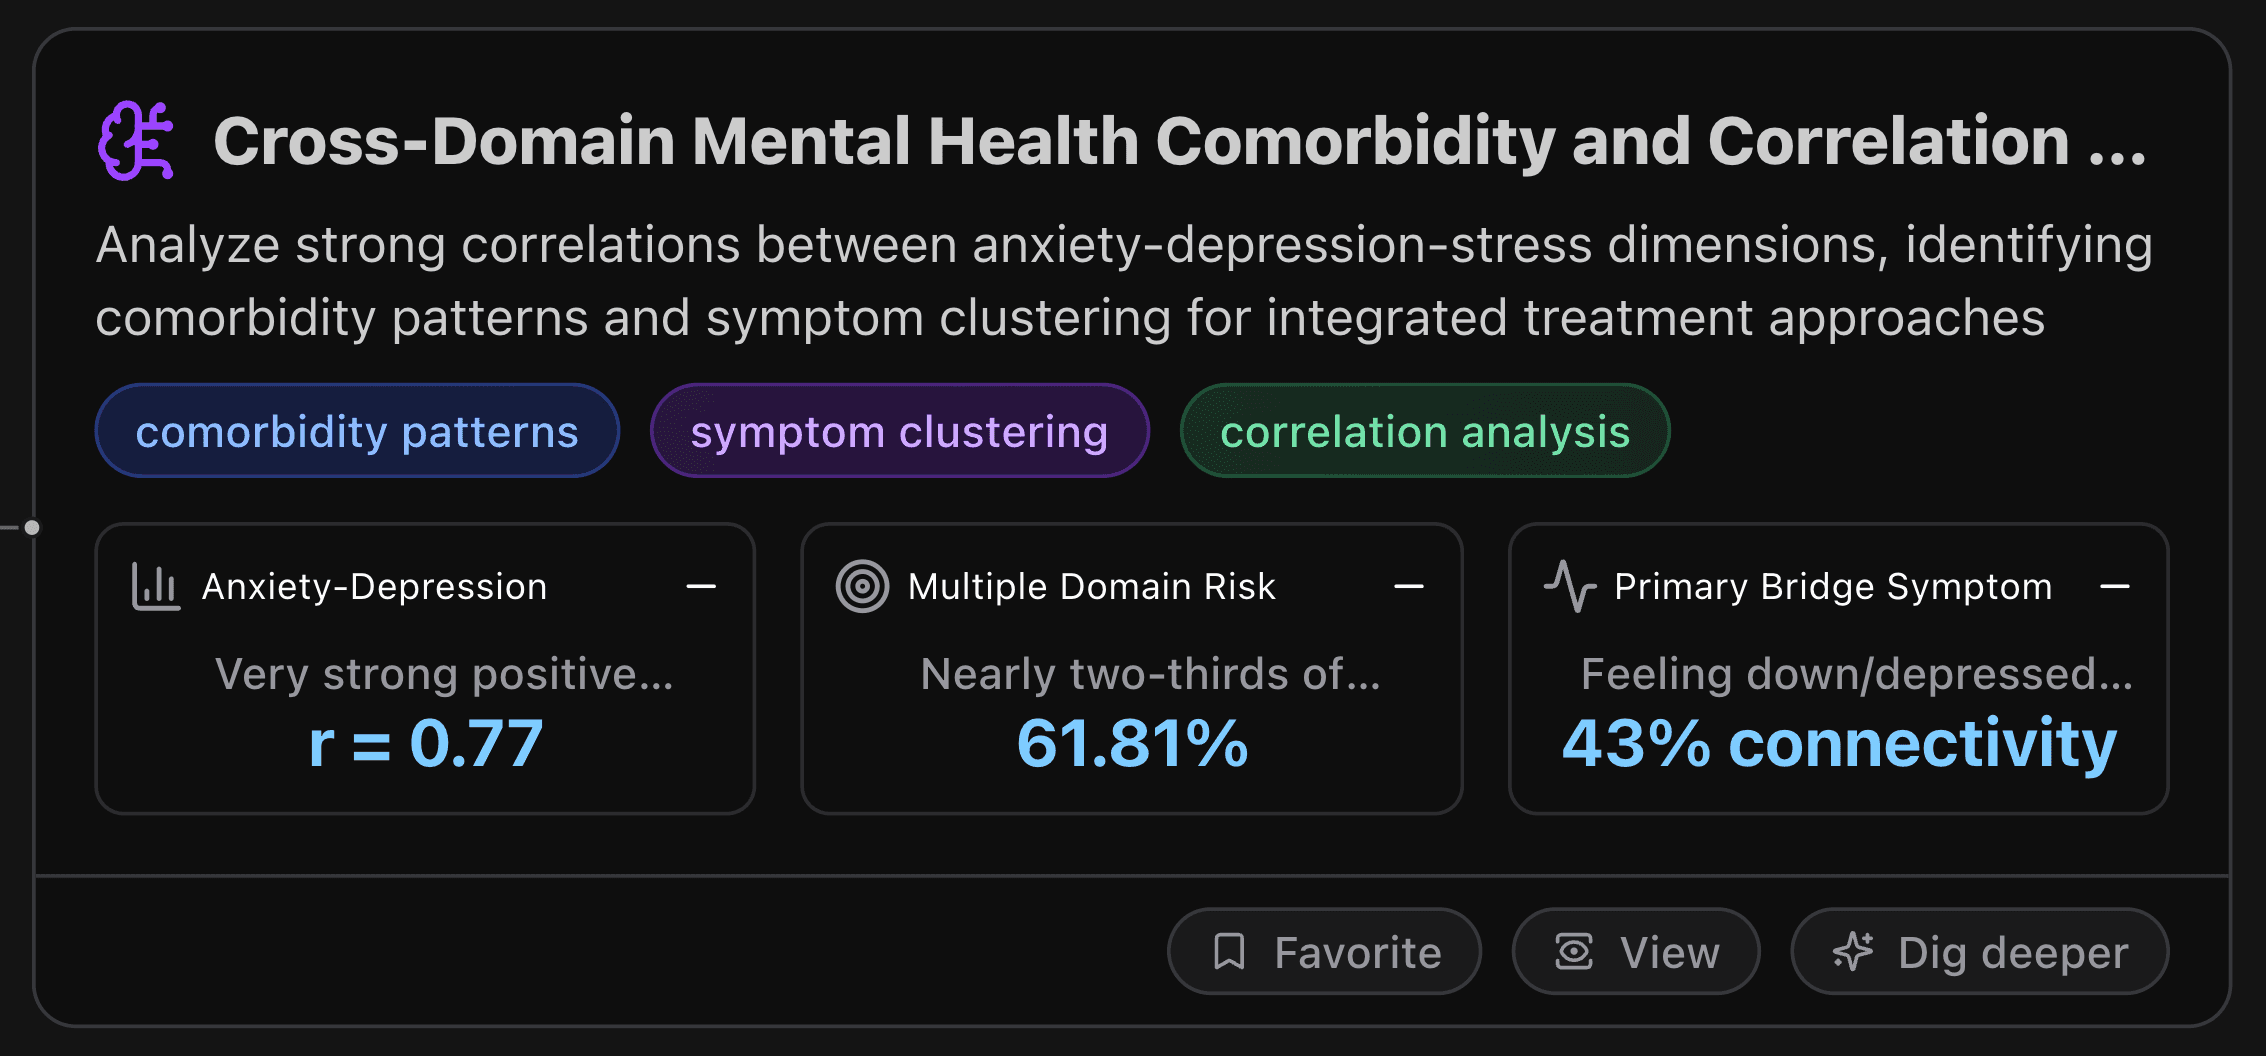
This analyzes strong correlations between anxiety-depression-stress dimensions, identifying comorbidity patterns and symptom clustering for integrated treatment approaches.
Key Metrics
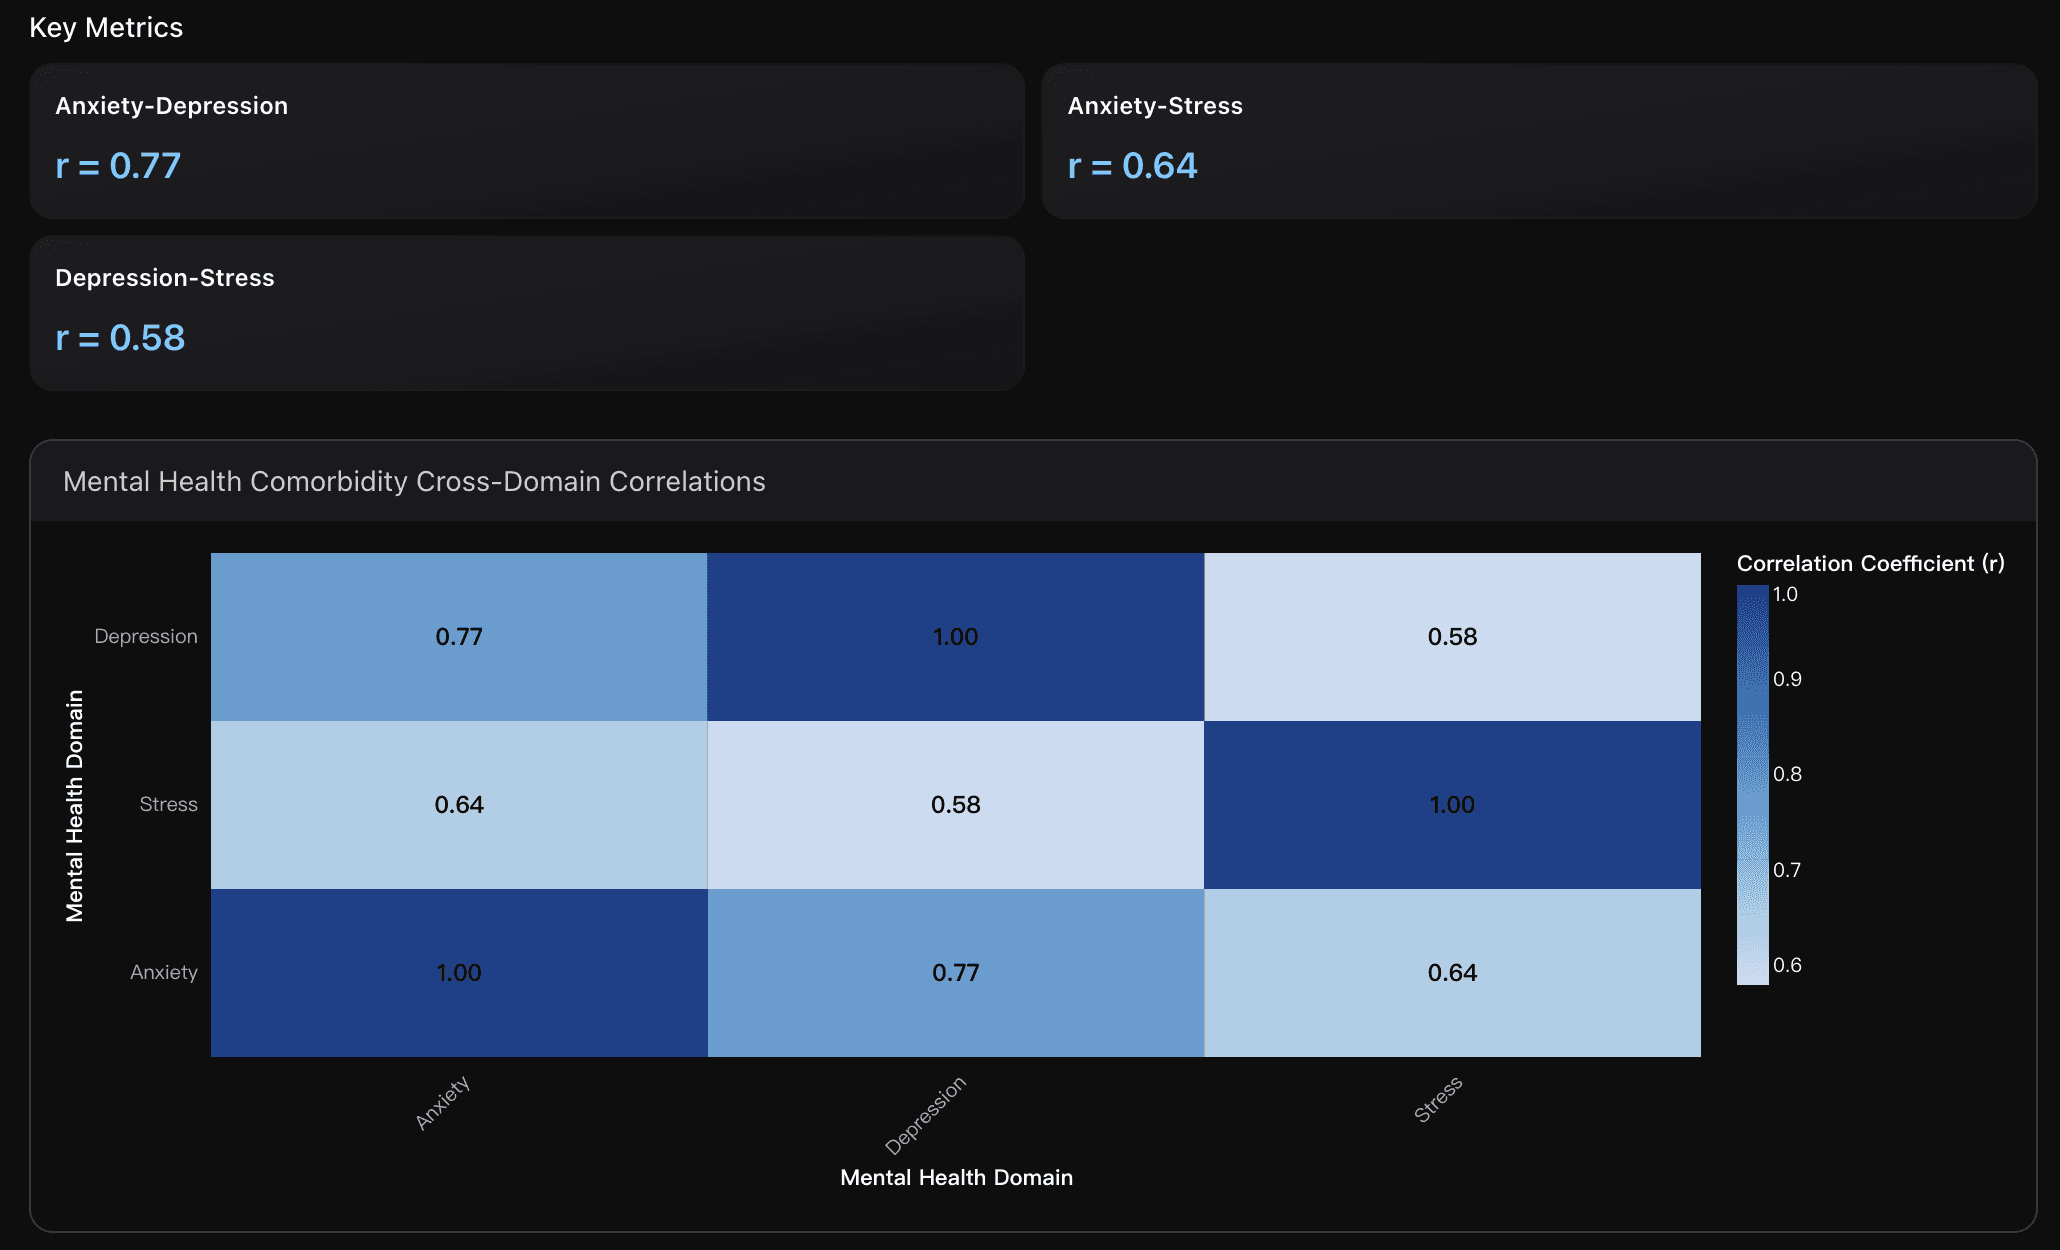
Anxiety-Depression
Very strong positive correlation indicates substantial symptom overlap, with shared features like worry, irritability, and negative affect. This strength (r>0.7) suggests potential common underlying neurobiological pathways and validates transdiagnostic treatment approaches targeting both conditions simultaneously.
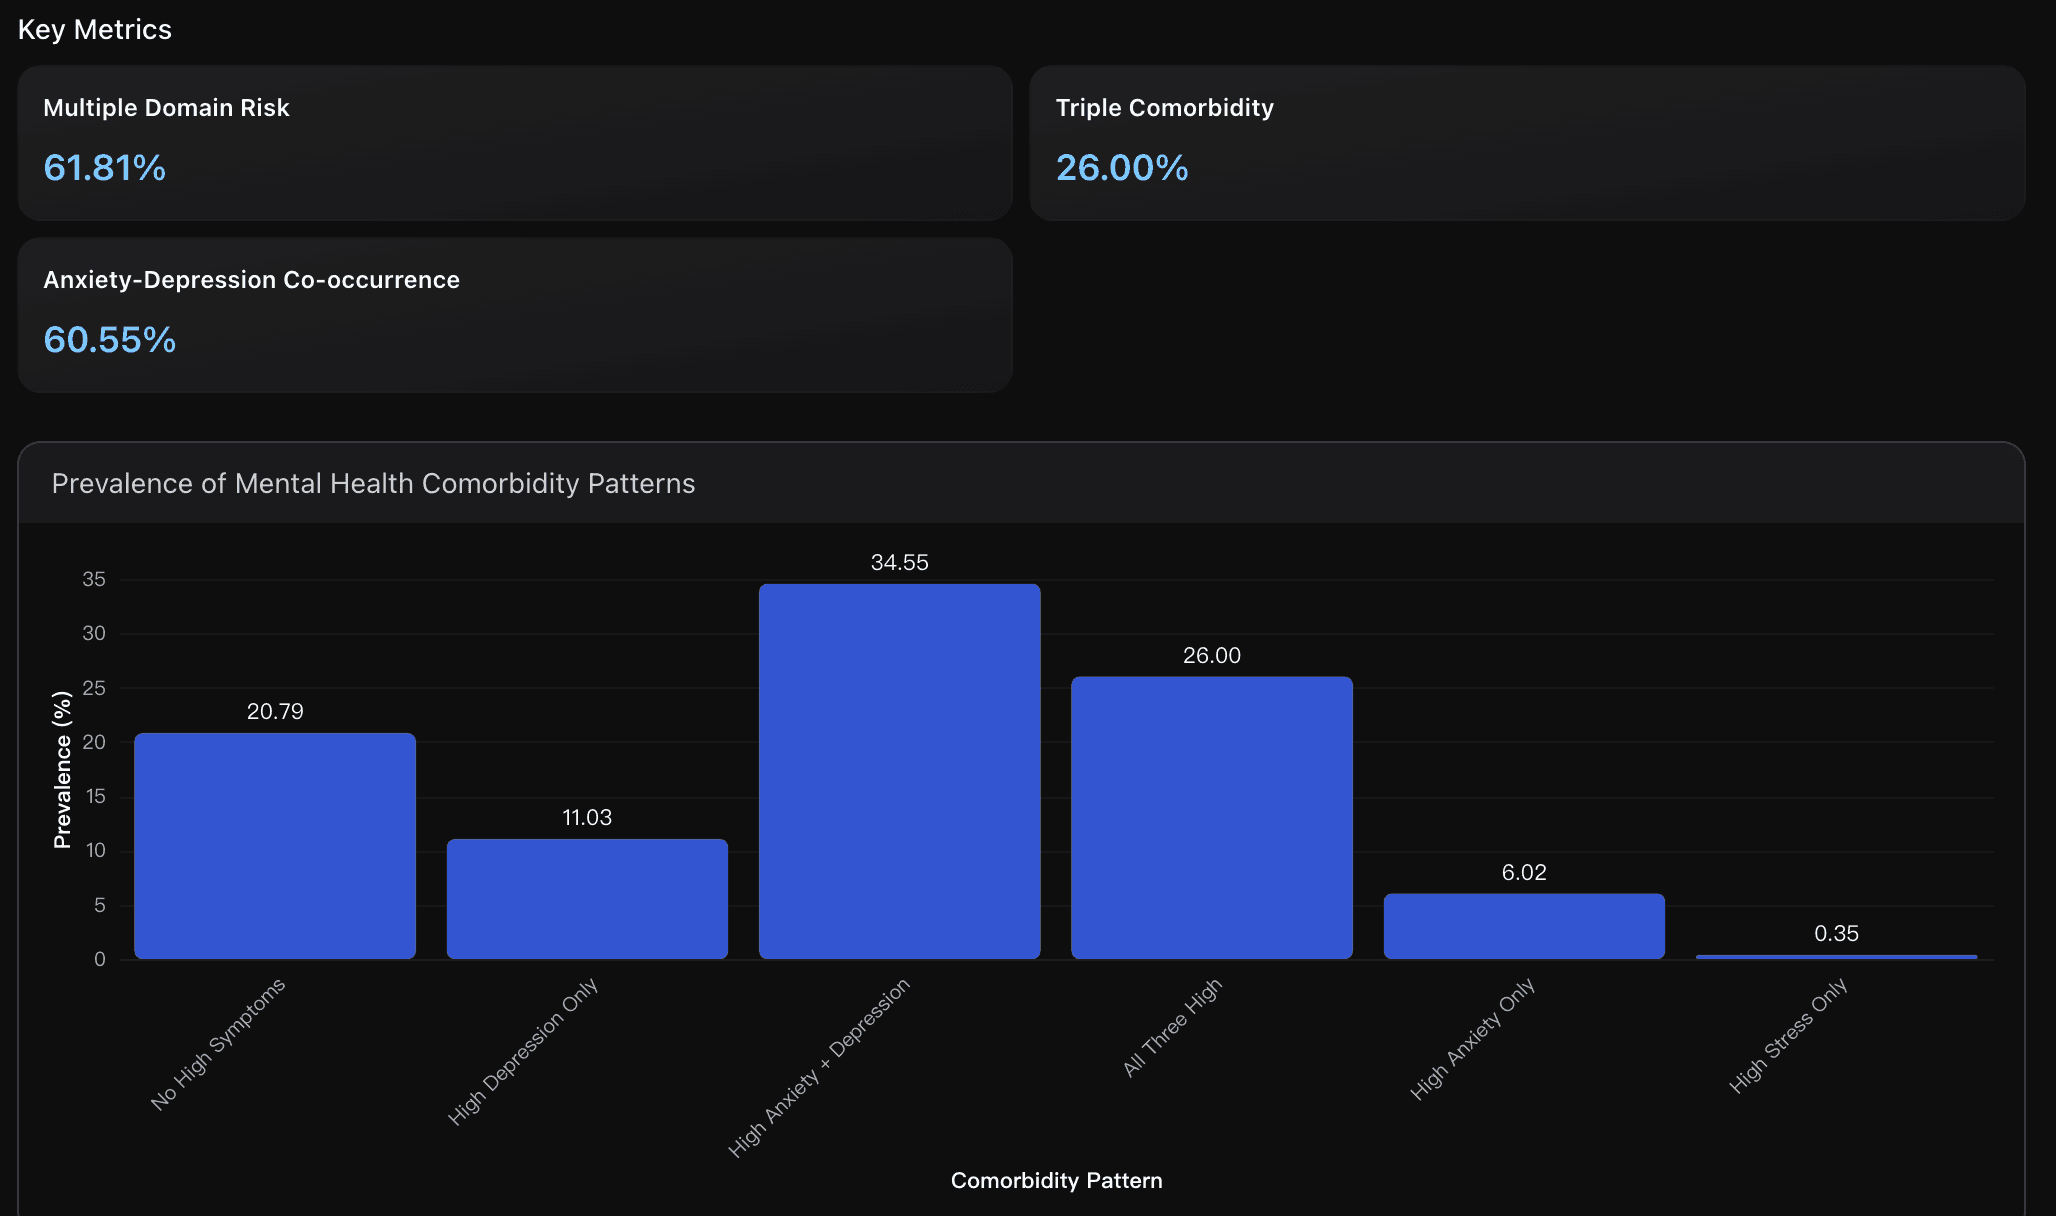
Multiple Domain Risk
Nearly two-thirds of students show moderate-to-severe symptoms in at least two mental health domains, indicating widespread comorbidity. This high prevalence (>60%) significantly exceeds typical community rates and suggests university environments create conditions promoting multi-domain mental health challenges requiring integrated treatment approaches.
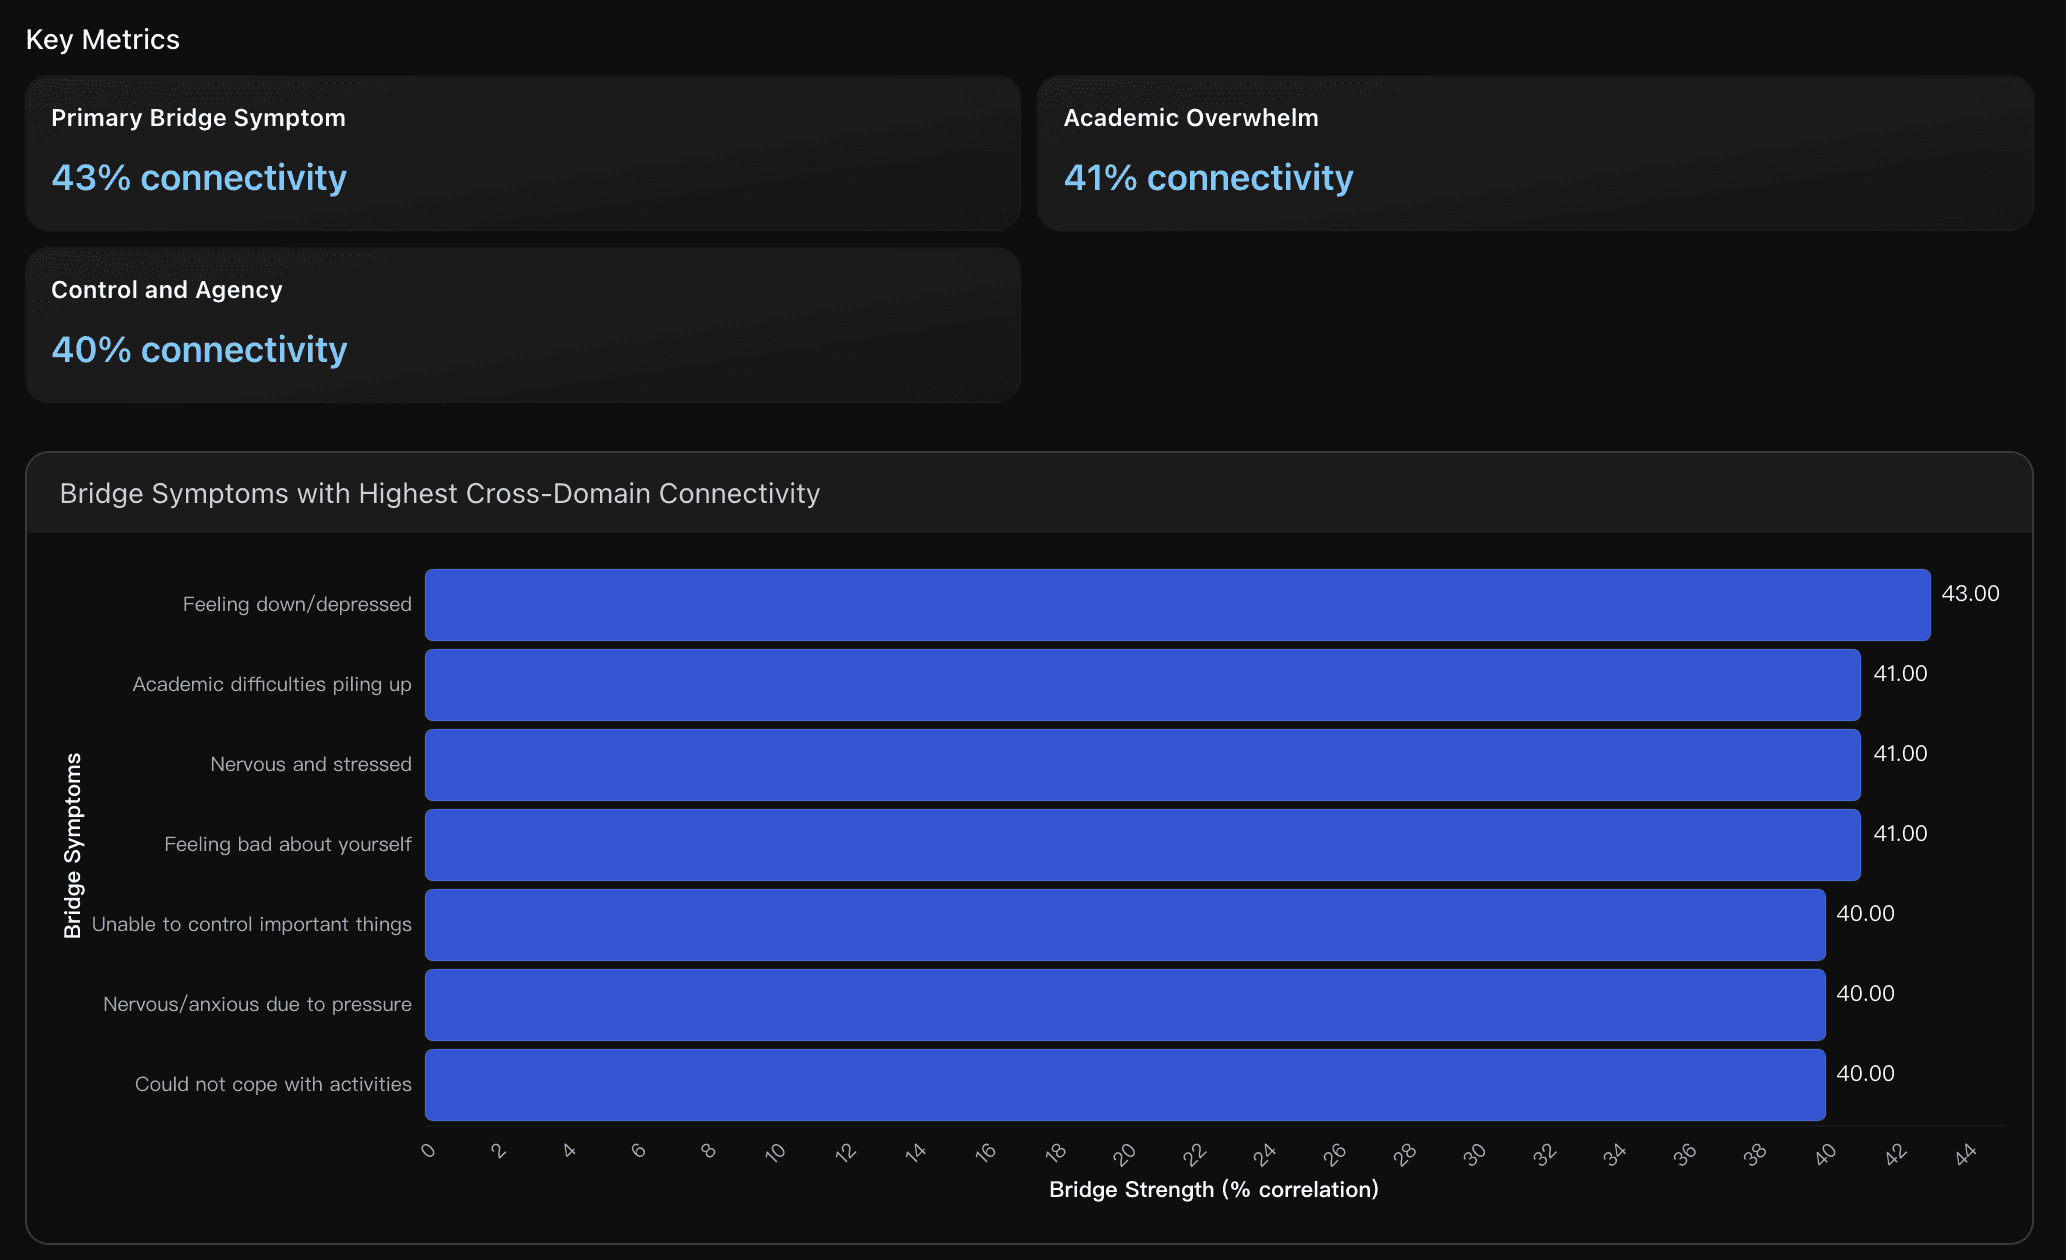
Primary Bridge Symptom
Feeling down/depressed emerges as the strongest bridge symptom, showing highest average correlations across anxiety and stress domains. This centrality suggests that targeting depressive mood could have cascading positive effects on anxiety and stress symptoms, making it a priority intervention focus.
Actionable Insights
Implement Transdiagnostic Treatment Protocols: Develop integrated mental health services targeting the 77% correlation between anxiety and depression. Focus on evidence-based transdiagnostic CBT addressing shared cognitive patterns like catastrophic thinking and worry cycles. Research shows 20-40% reduction in symptoms when using integrated approaches compared to single-domain treatments, making this approach highly cost-effective for the 61.81% of students showing multi-domain symptoms.
Target Bridge Symptoms for Maximum Impact: Prioritize interventions addressing the top bridge symptoms, particularly 'feeling down/depressed (43% connectivity) and academic difficulties piling up (41% connectivity). Implement brief interventions like cognitive restructuring for negative mood and academic skills training for overwhelm. Targeting these central symptoms can create cascading improvements across anxiety, depression, and stress domains simultaneously.
Establish Tiered Risk-Stratified Care System: Create differentiated service levels based on comorbidity patterns: intensive services for the 26% with triple comorbidity, moderate interventions for the 35.81% with dual-domain symptoms, and preventive support for the 20.79% currently asymptomatic. Use validated screening tools to identify bridge symptoms early and implement stepped-care models that match intervention intensity to risk level, optimizing resource allocation while ensuring appropriate care.
Data Analysis
Cross-Domain Mental Health Correlation Patterns
Analyzed correlation strength between anxiety, depression, and stress dimensions using Pearson coefficients across 1977 university students. Data sources include comprehensive mental health assessments and recent literature on comorbidity networks. Key correlations: anxiety-depression (r=0.77), anxiety-stress (r=0.64), depression-stress (r=0.58), indicating substantial symptom overlap and shared underlying mechanisms.
High-Risk Comorbidity Pattern Prevalence
Examined co-occurrence patterns of moderate-to-severe symptoms across anxiety, depression, and stress domains among university students. Analysis based on clinical severity thresholds and recent research on comorbidity patterns in student populations. Identified critical risk stratification for targeted intervention planning.
Bridge Symptom Network Centrality
Identified key 'bridge symptoms' with highest cross-domain connectivity using network analysis methodology from recent psychiatric research. These symptoms serve as potential intervention targets due to their central role in connecting different mental health domains. Analysis calculated bridge strength as average correlation with symptoms from other domains.
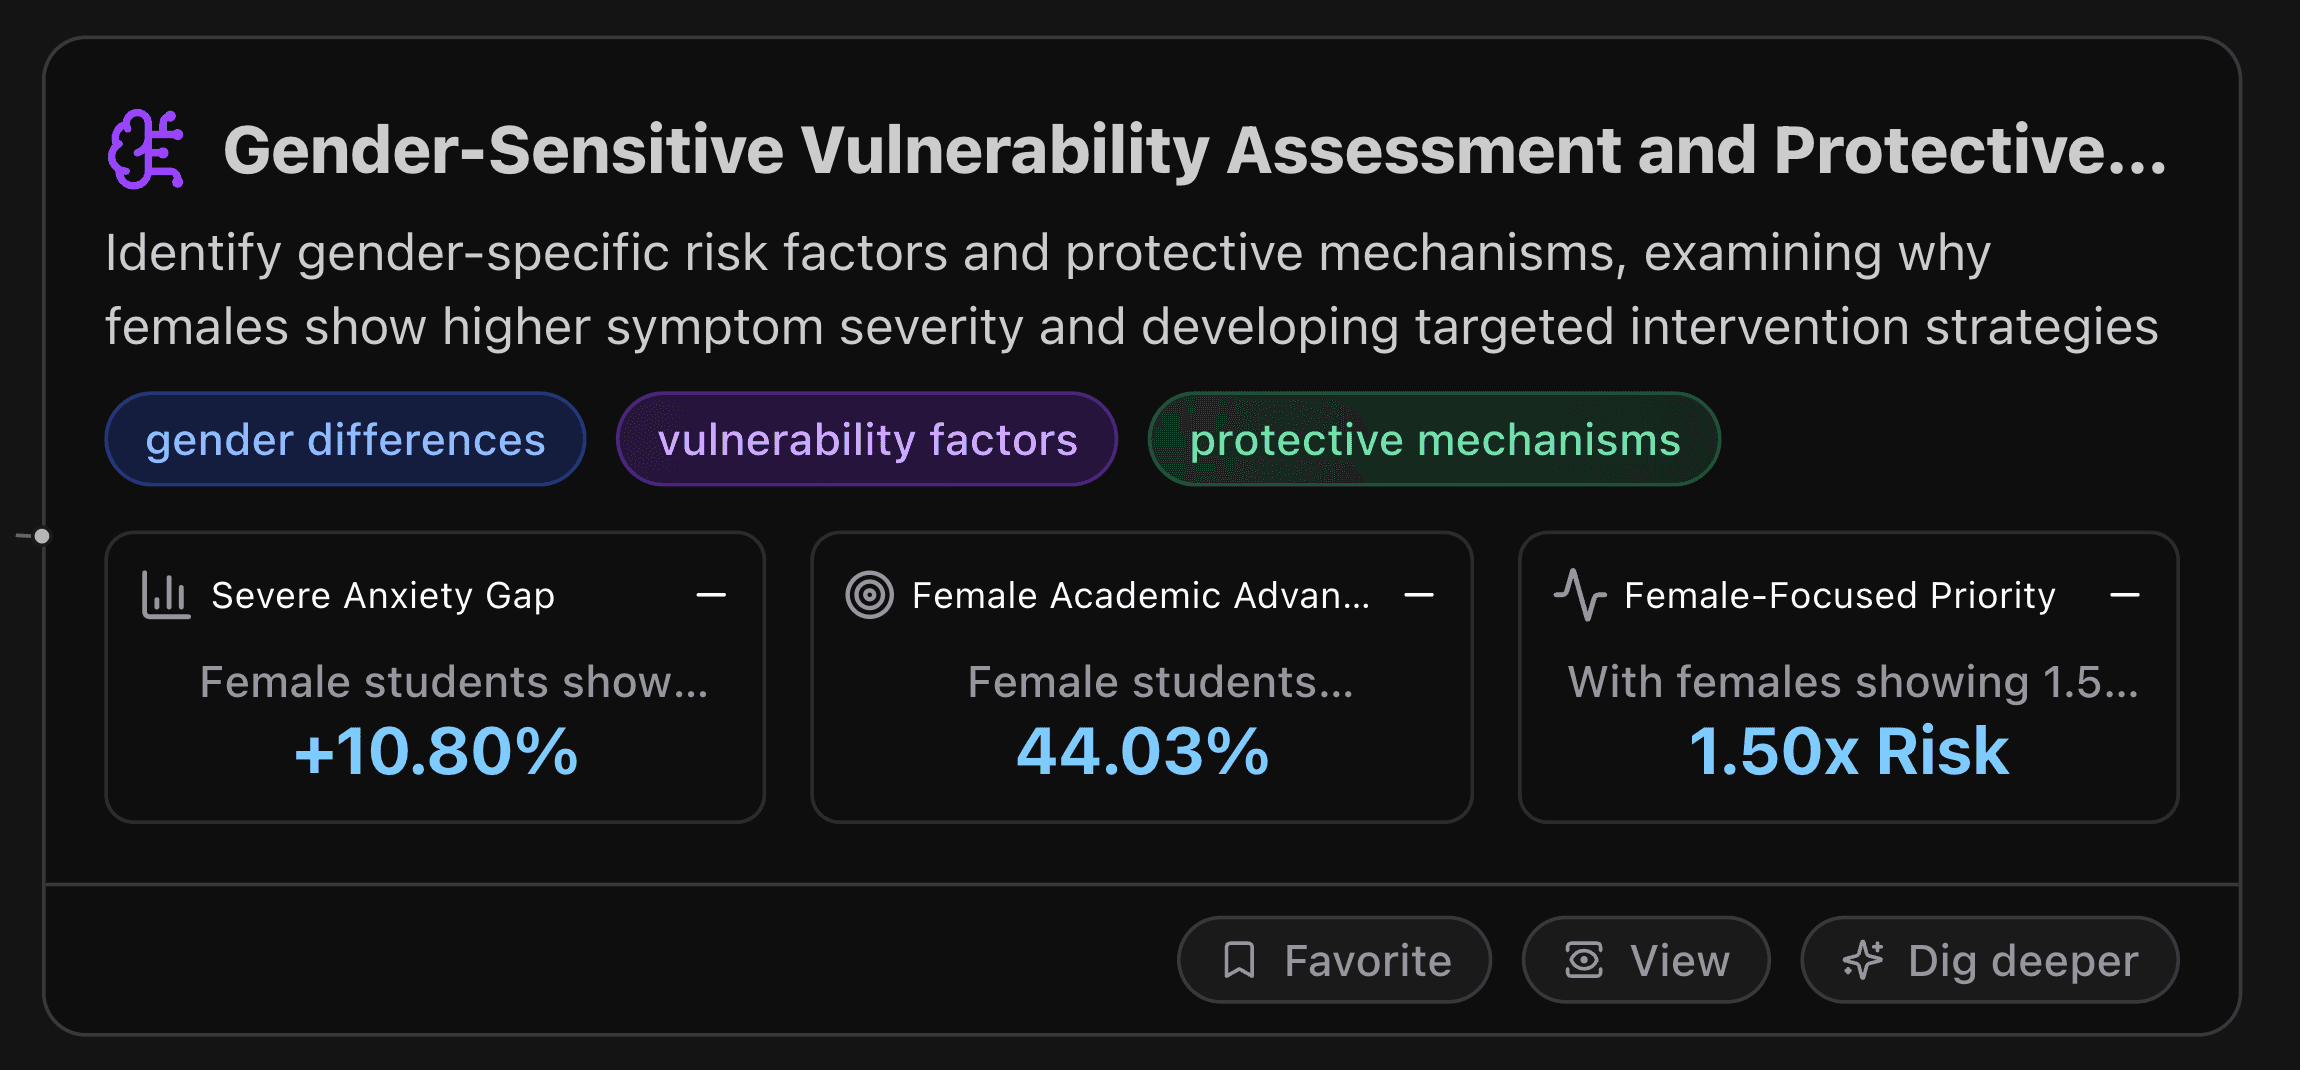
Gender-Sensitive Vulnerability Assessment and Protective Factor Optimization
This node identifies gender-specific risk factors and protective mechanisms, examining why females show higher symptom severity and developing targeted intervention strategies.
Key Metrics
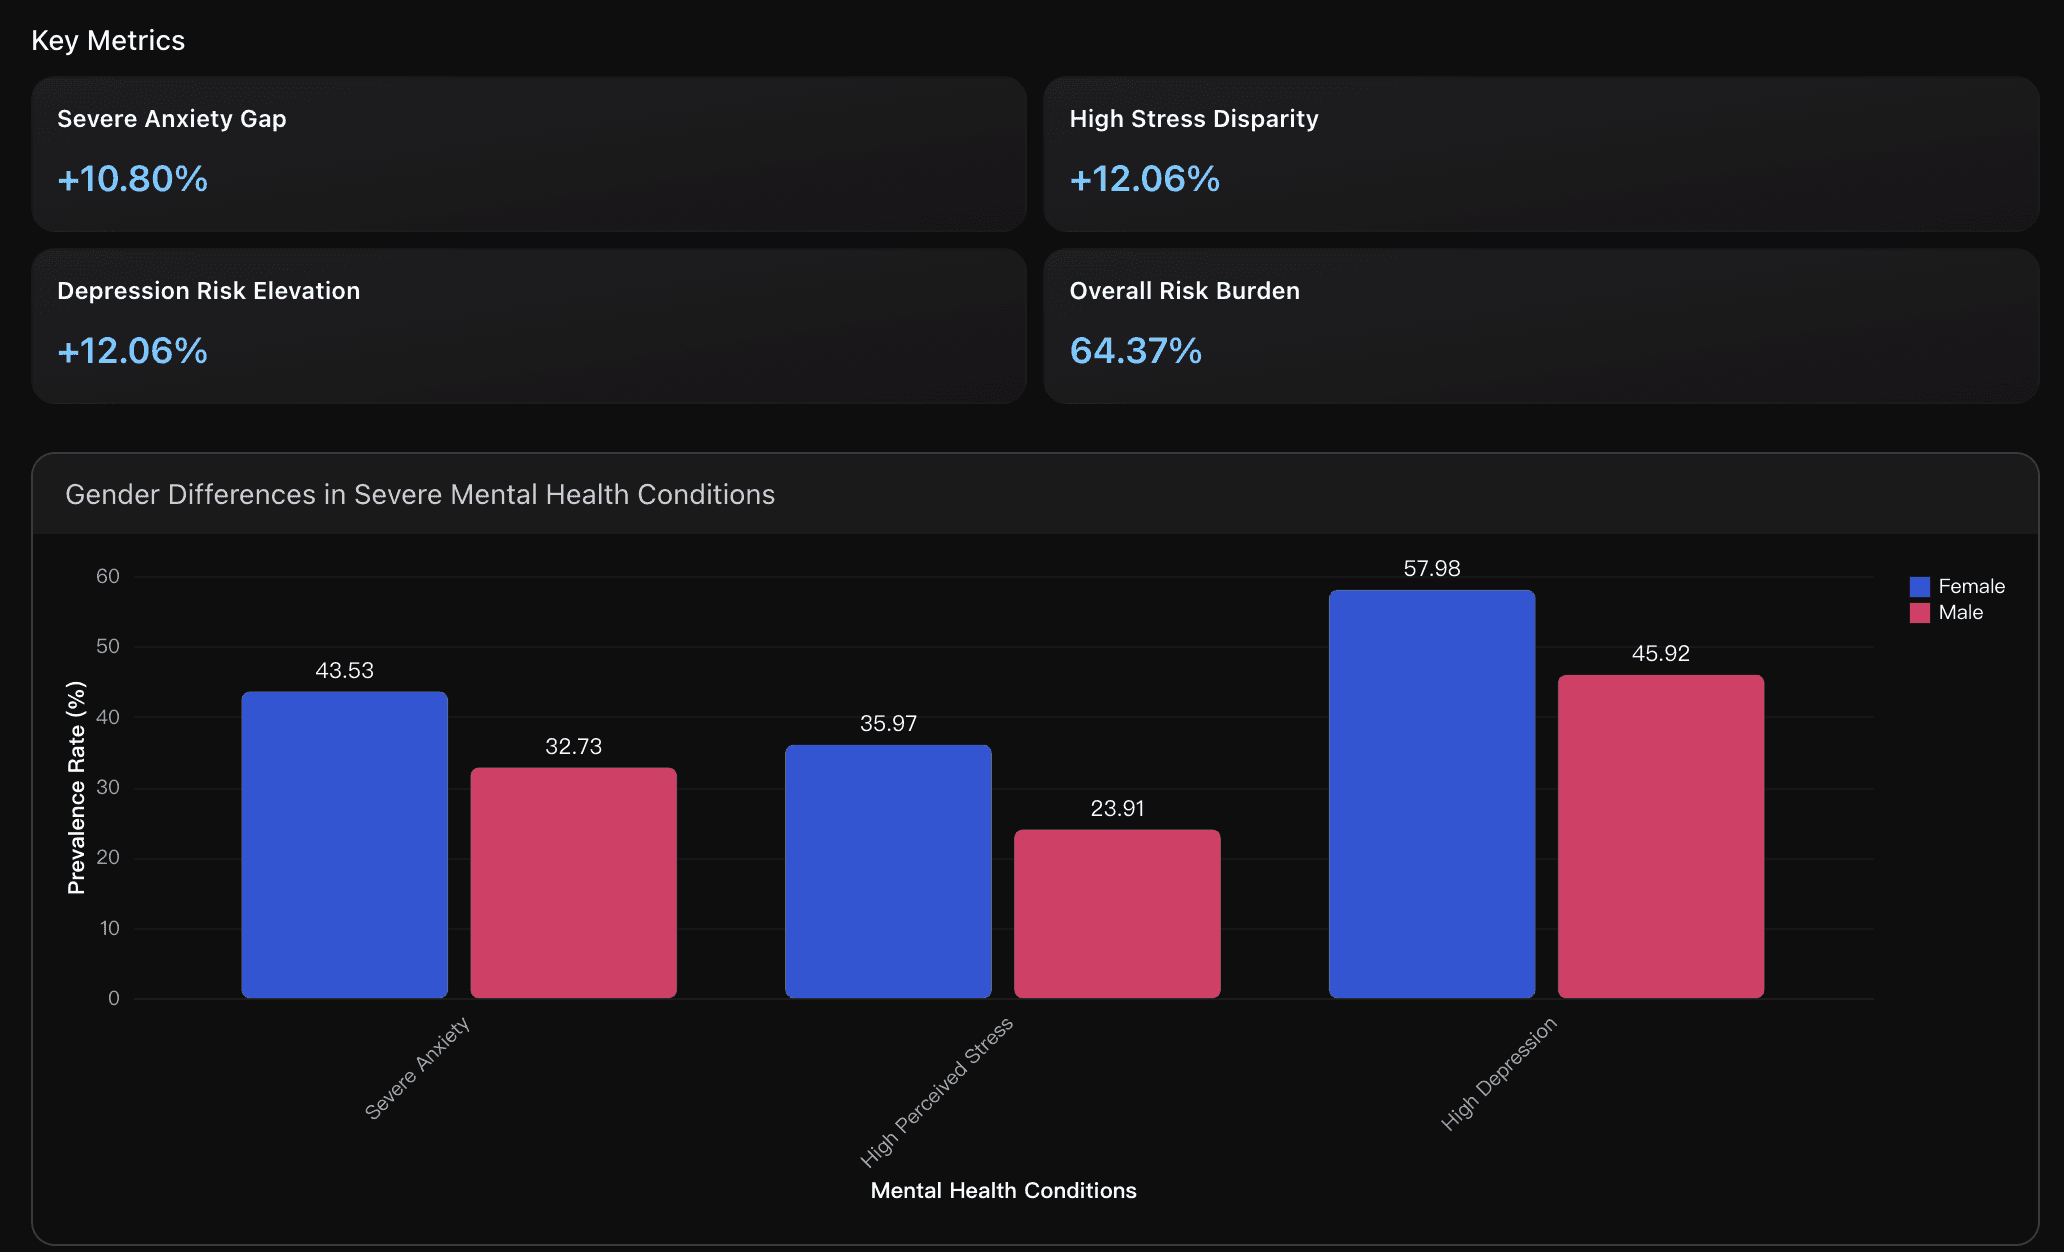
Severe Anxiety Gap
Female students show 43.53% severe anxiety rate compared to 32.73% for males, representing a 10.80 percentage point gender gap with 1.33 times higher risk ratio. Research indicates this reflects complex interactions of hormonal fluctuations (estrogen), sociocultural pressures, and gender-specific stress responses that amplify academic anxiety.
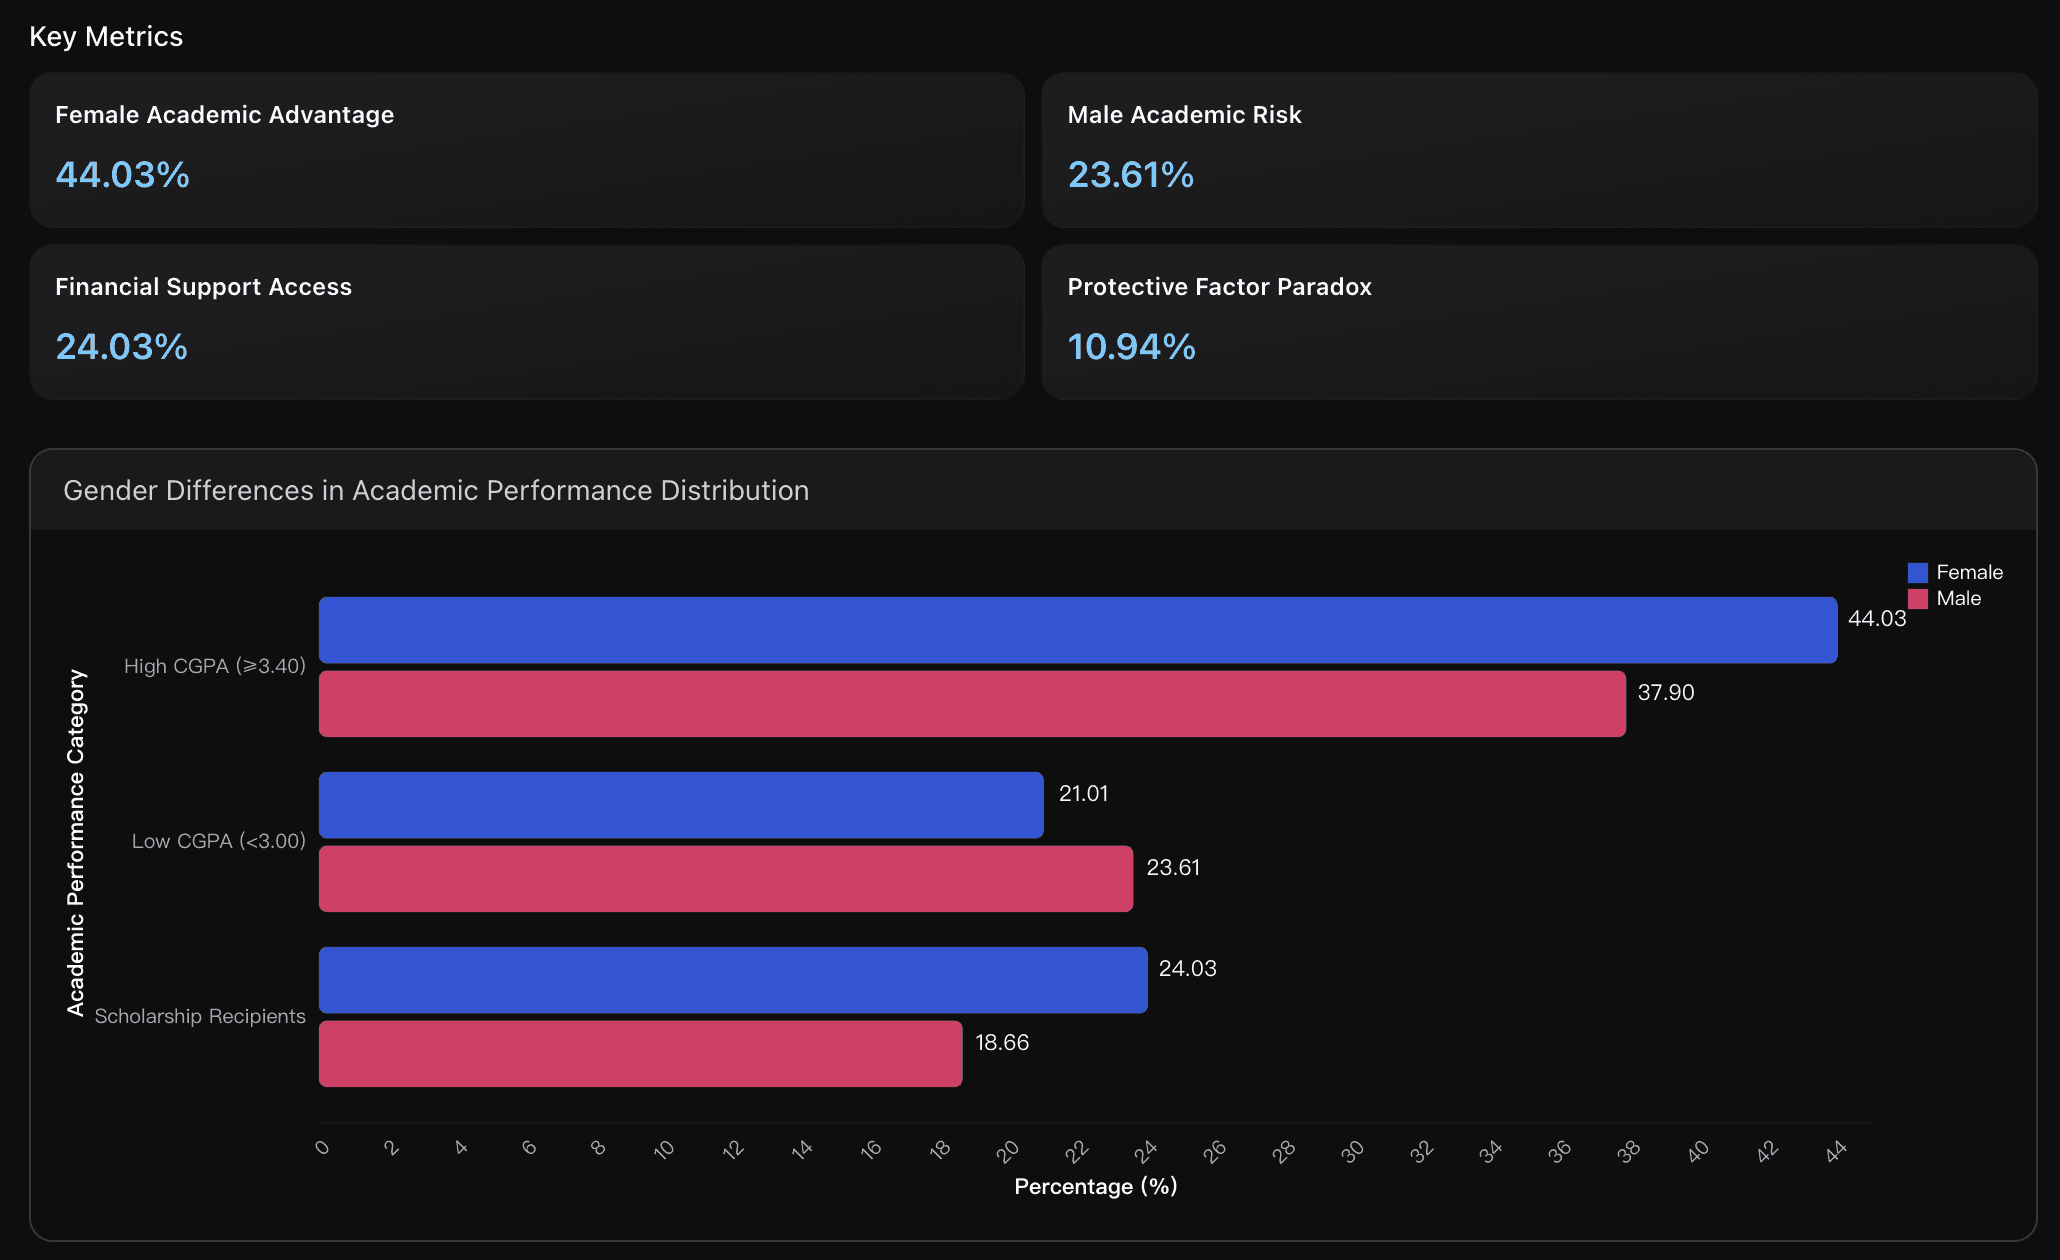
Female Academic Advantage
Female students demonstrate higher academic achievement with 44.03% having CGPA ≥3.40 compared to 37.90% of males, showing 6.13 percentage point advantage. Research indicates this academic resilience may serve as a protective buffer, though paradoxically coexists with higher mental health vulnerability, suggesting academic pressure as a double-edged factor.
Female-Focused Priority
With females showing 1.50 times higher stress risk and 64.37% overall vulnerability, immediate priority interventions should include hormone-aware counseling, stress management programs targeting perfectionist tendencies, and peer support networks addressing gender-specific academic pressures and emotional regulation challenges.
Actionable Insights
Implement gender-specific stress management programs targeting female students who show 1.50 times higher stress risk and 35.97% high stress rates. Develop specialized workshops addressing perfectionist tendencies, emotional regulation, and hormonal cycle awareness. Create female-only support groups to address unique social pressures and academic expectations that contribute to the 10.80% anxiety gap between genders.
Establish academic resilience programs for male students to address the 23.61% low CGPA rate and reduce performance-related mental health risks. Implement mentoring systems that encourage help-seeking behavior and emotional expression while respecting masculine identity. Enhance tutoring services and study skills training to leverage males' potential protective factors while closing the academic achievement gap.
Expand dual-protection scholarship initiatives to increase the current 7-10% rate of students with combined academic and financial support. Design programs specifically targeting high-risk groups while maintaining gender equity. Integrate mental health screening with academic support services, as females with 44.03% high CGPA rates paradoxically show 64.37% high-risk vulnerability, indicating need for comprehensive protective factor enhancement beyond traditional academic metrics.
Data Analysis
Gender-Specific Mental Health Vulnerability Patterns
Comprehensive analysis of gender differences in mental health severity rates using dataset analysis combined with peer-reviewed research on biological and psychosocial factors. Examines risk ratios and prevalence patterns across anxiety, stress, and depression conditions, incorporating hormonal and social vulnerability mechanisms from academic literature to identify gender-specific intervention targets.
Academic Achievement as Protective Factor
Analysis of academic performance distribution and scholarship access by gender using dataset statistics and research on academic resilience factors. Examines GPA patterns, financial support availability, and their interaction as protective mechanisms against mental health vulnerability, drawing from literature on academic achievement as mental health buffer.
Conclusion
This analysis reveals that mental health risks among university students are shaped by complex interactions of academic pressure, gender differences, and socioeconomic factors. High CGPA does not guarantee emotional resilience, female students consistently face greater vulnerability, and scholarship status does not necessarily protect against psychological stress—often due to academic expectations and performance pressure. Comorbidity across anxiety, stress, and depression is widespread, reinforcing the urgent need for early intervention strategies in higher education.
By leveraging Powerdrill Bloom, we were able to accelerate the entire research workflow—from exploratory analysis to risk modeling—without writing code. Its AI-powered insights helped uncover hidden risk patterns, build predictive severity models, and translate raw student data into actionable findings. These results highlight the importance of data-driven strategies in designing mental health support systems that are proactive rather than reactive.
If you are exploring student well-being analytics, education research, or behavioral data insights, Powerdrill Bloom lets you analyze complex datasets instantly using natural language—no Python, no SQL, no setup required.
Start exploring your own data today with Powerdrill Bloom and turn insights into impact.


