
Data is the lifeblood of any company, serving as the critical foundation for analyzing operational effectiveness and charting strategic direction. It includes customer and market data, operational and supply chain metrics, financial records, and compliance datasets—all vital for understanding how decisions translate into outcomes. By tracking fluctuations in these datasets, you can easily gauge whether your strategies are on the right path.
However, with approximately 402.74 million terabytes ( according to Exploding Topics ) of data created each day, a pressing question arises: How do you extract meaningful insights from this flood of information? Must we really spend hours—even days—sifting through complex datasets using outdated methods? Relying on traditional data analysis could mean falling behind competitors who leverage AI: the time gap between manual labor and AI-driven speed might be the difference between seizing a market opportunity and missing it entirely.
Today, AI’s capabilities have evolved to revolutionize this process. Modern tools don’t just transform raw data into visual dashboards that make trends instantly understandable—they go further. AI can generate actionable, data-driven insights directly from your datasets, turning static numbers into strategic roadmaps.
Benefits of Being Data-driven: Enhance Business Resiliency
While defined by volatility—supply chain disruptions, shifting consumer demands, and unpredictable market shifts—business resiliency isn’t just a goal; it’s a necessity. Data-driven strategies act as the bedrock of this resilience, empowering organizations to navigate uncertainty with agility, foresight, and adaptability. According to S&P Global, data-driven insights give such advantages, and here is a conclusion:

1. Proactive Risk Mitigation
Data acts as an early-warning system, spotting supply chain glitches, compliance risks, or customer churn before they escalate. Predictive analytics flags cost spikes or equipment failures, letting teams prepare defenses—reducing downtime and protecting revenue.
2. Operational Agility
Static plans fail in flux; data enables real-time pivots. Retailers reroute inventory using weather and sales trends. Manufacturers predict machine failures via sensor data. These data-led adjustments keep operations efficient, even as external factors shift.
3. Customer-Centric Adaptation
Data decodes evolving needs—like surges in budget products during recessions. Brands quickly tailor offerings or communications, fostering loyalty. Personalization builds trust, ensuring customers stay engaged when priorities change.
4. Resource Optimization
Data identifies waste: logistics cuts fuel costs with route algorithms; HR fills skills gaps proactively. Efficient resource allocation preserves cash flow, crucial for navigating tight margins or investing in innovation.
5. Strategic Continuity
Scenario modeling using historical data prepares for “what-ifs,” from new competitors to crises. This foresight creates dynamic roadmaps, turning radical shifts into opportunities—ensuring long-term viability, not just short-term survival.
In uncertainty, data brings clarity to anticipate, adapt, and emerge stronger. Embracing it isn’t optional—it’s how businesses turn volatility into a competitive edge.
How Can You Easily Get Data-driven Insights?
Step 1: Collect Relevant Data—Focus on Purpose, Not Just Volume
Start by defining what data matters for your business goals. Whether you’re looking at customer behavior, sales performance, or operational efficiency, relevance trumps quantity.For example, if you are looking to market dynamics, competitor pricing and industry trends will be key. Meanwhile, by selecting multiple data sources, you will obtain a more comprehensive analysis.
Step 2: Choose the Right Tools—Blend Human Intuition with AI Precision
The right tools can handle massive datasets, streamlining your data analysis workflow and delivering real-time insights—no more waiting on tedious manual processes. This frees up hours of your time, letting you focus on strategic decision-making instead of getting bogged down in spreadsheets or data cleanup.
AI-driven tool like Powerdrill can quickly identifies your business’s strengths or areas needing improvement hidden in the numbers, verifies data accuracy to catch errors early, and generates easy-to-understand visualizations that turn raw data into actionable stories.
Step 3: Analyze the Data—Let AI Do the Heavy Lifting
Using AI tools to analyze raw data turns it into clear, actionable stories—revealing how factors interconnect (correlations), what recurring behaviors or outcomes emerge (patterns), and where your business is trending (trends).you can spot actionable insights that might not be immediately obvious from them.
Step 4: Interpret the Results
This phase is about transforming raw metrics—like customer satisfaction scores, engagement rates, or purchase patterns—into insights that bridge the gap between data and decision-making. For instance, an unusually high bounce rate on a specific page might indicate usability barriers in its design, while sustained spikes in visit frequency to a particular content section could signal strong demand for deeper, niche content. The ultimate goal is to transform these fragmented behavioral traces into precise optimization priorities, enabling data to not just speak but guide.
Real-life Use Case
In the following example, Powerdrill is used for data analysis.
Retail Data Analysis
In this case study, we explore how retail analytics can optimize sales strategies and inventory management using Powerdrill. We have data from Walmart that includes weekly sales figures, store identifiers, department numbers, and dates. Our objective is to understand sales patterns across different stores and departments, predict future sales trends, and recommend strategies for improving inventory management and customer satisfaction. By analyzing this real-world retail data, we aim to identify actionable insights that can enhance operational efficiency and drive business growth.
The sample data used in this case study is Walmart sales data.

You can click WALMART_SALES_DATA Link to analyze the dataset on Powerdrill.
Question Formulation
In retail analytics, formulating the right questions is crucial for guiding your analysis and deriving meaningful insights. It's like setting a clear objective for your investigation, helping you focus on the essential aspects of your data. For example, with our Walmart sales data, we posed the question:
"What are the key factors that drive sales performance across different stores and departments over time?"
This question directs us to analyze various elements such as weekly sales trends, store performance, and department-specific patterns. By clearly defining our question, we ensure that our analysis remains focused and effective, allowing us to extract actionable insights that can enhance sales strategies and inventory management.

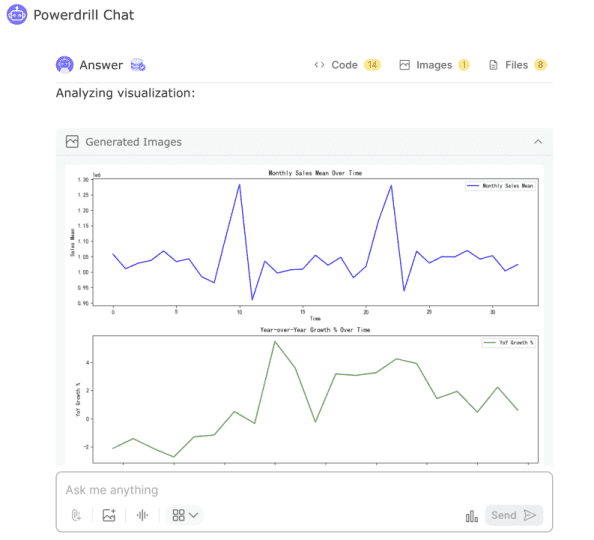
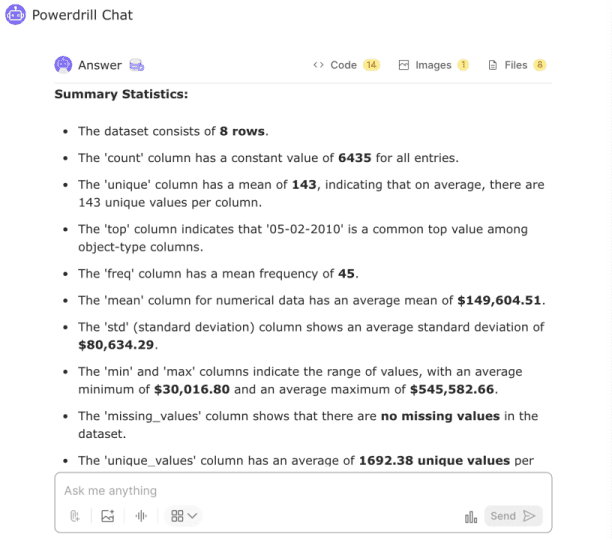
Significant Findings
Missing Values: Addressed through median imputation, ensuring consistent data across the dataset.
Outliers: Retained to explore their influence on sales trends, especially during promotions or seasonal peaks.
Date Standardization: Implemented a unified date format (YYYY-MM-DD) to support time-series analysis.
Numerical Consistency: Verified and standardized numerical data types for accurate analysis.
Tools to Help You Extract Data-driven Insights
1. Powerdrill
Powerdrill AI is an AI SaaS service focused on personal and enterprise datasets, designed to maximize the potential of your data. It allows users to interact with datasets using natural language for tasks ranging from simple Q&As to comprehensive BI analysis. Whether you're a student or a business professional, this tool will transform your data into stunning visuals.

Features:
Powerdrill AI is packed with features that set it apart. Here are some highlights:
Customizable charts: Choose from a wide range of graph types to fit your specific needs.
Collaborative teamwork: Work with your team in real time, no matter where they are. You can share your datasets with your team, explore Excel together using Powerdrill AI, and enrich your collective understanding.
Generate presentations from CSV files: Beyond regular data analysis, Powerdrill AI can automatically generate presentations for you, structuring the logic and narrative of your data.
2. Formula Bot
Formula Bot is a powerful tool that helps users create Excel formulas quickly and easily. This tool is best for automating data visualization and making data analysis simpler. It can turn plain text instructions into complex formulas, making it accessible for everyone, even those who aren't Excel experts.

Features:
Quick Formula Generation: Converts text instructions into Excel formulas in no time.
Chart Templates: Create various chart templates to track expenses and time effectively.
Automation: Generates VBA or Apps Script code to automate tasks in Excel or Google Sheets.
3. Tableau
Tableau is a data visualization tool that helps create interactive dashboards. It presents data in a visual format to make trends and patterns easier to identify. Tableau integrates with multiple data sources for streamlined analysis across different platforms. Its flexibility allows users to customize visualizations and tailor reports to meet specific business needs.

Features:
Interactive dashboards: Tableau enables the creation of dashboards that users can interact with, allowing deeper exploration of the data.
Data visualizations: Tableau offers a variety of visualization types to represent data clearly, such as bar charts, heat maps, and geographic maps.
Data integration: Tableau supports integration with multiple data sources, including databases, spreadsheets, and cloud services, for consolidated data analysis.
4. Looker
Looker is a platform by Google used for data analysis and exploration. It allows users to create customizable dashboards and helps standardize data analysis with its modeling features. Looker integrates with various data warehouses, supporting better data governance and scalability. Looker makes it easy for teams to work together by sharing insights and findings across departments, so everyone stays on the same page and can make better decisions

Features:
Centralized data platform: Looker offers a single platform for managing and analyzing data, ensuring uniformity across teams.
Custom dashboards and reports: Users can create specific dashboards and reports tailored to business requirements.
Data warehouse integration: Looker integrates with various data warehouses, streamlining access to and analysis of large datasets while maintaining governance.
5. Ajelix
Ajelix offers a suite of AI-powered tools designed to make data analysis and visualization accessible, especially for users without extensive technical skills. Their platform focuses on simplifying complex data tasks, allowing marketers and other professionals to gain insights from their data efficiently. A key offering for non-tech users is their AI Data Analyst, which provides a user-friendly chat interface for exploring and analyzing data.
Features:
Associative data engine: Ajelix ’s engine lets users explore data and find connections across multiple data sources that may not be immediately apparent.
Self-service exploration: Users can analyze data without relying on IT, enabling more flexible and independent data exploration.
AI-driven insights: Ajelix leverages AI to provide automated insights, helping users spot trends or anomalies in data more efficiently.
Take Actions Based on Data
Data analysis is only half the battle—the real win comes from turning those insights into action. No matter how deep your trends or how precise your predictions, their value hinges on what you do next. Tools like Powerdrill can reveal hidden opportunities—like inventory gaps, customer preferences, or operational inefficiencies—but it’s your decisions that bridge the gap between data and results. Don’t just track metrics; let them guide bold, strategic moves: reallocate resources to high-growth areas, refine strategies based on real-time feedback, or double down on what your data proves works.
Experience how Powerdrill's user-friendly platform analyzes data to deliver actionable insights that you can act on—fast&accurate.


