A Comprehensive Guide to Pie Charts: Types, Uses, Best Practices, and Tools
Shein
Jul 23, 2025
In the world of data visualization, pie charts remain one of the most popular and recognizable tools for presenting information. Whether you're a data analyst, student, marketer, or business owner, understanding how to effectively use pie charts can help you communicate insights quickly and clearly.
This comprehensive guide covers everything you need to know—from what a pie chart is, to when and how to use one, the different types available, best design practices, and recommended tools for creating them.
What Is a Pie Chart?
A pie chart (also known as a circle chart) is a circular graph used to represent numerical proportions. Each slice of the pie corresponds to a category’s contribution to the whole, with the angle and area of the slice proportional to the value it represents. The entire chart represents 100% of the dataset.
For example, if you're analyzing the market share of companies within an industry, a pie chart can visually illustrate how much each company contributes to the total market.
Types of Pie Charts and Their Uses
Pie charts come in several variations, each with its own purpose and advantages:
Classic 2D Pie Chart
The standard and most widely used format, the 2D pie chart displays data in a simple circular layout. Each slice represents a category, making it an effective choice for quick and intuitive data comparisons.
3D Pie Chart
Adding a third dimension can make pie charts more visually engaging. However, this visual enhancement can sometimes distort data perception—making slices appear larger or smaller than they are. Use 3D charts with caution, especially when precise data interpretation is important.
Exploded Pie Chart
An exploded pie chart pulls one or more slices away from the center, drawing attention to key categories. It’s ideal when you want to highlight a particular segment, such as the largest revenue contributor or the fastest-growing department.
Doughnut Chart
A doughnut chart is similar to a pie chart but features a blank center, which can be used to display totals or additional context. It's particularly useful when layering multiple data series or comparing sub-categories.
Compound Pie Chart
This advanced version includes a main pie chart with sub-charts or secondary visuals to show a detailed breakdown of specific slices. Compound pie charts are helpful when visualizing complex data, such as department budgets broken down by individual expenditures.
When to Use a Pie Chart (And When Not To)
Pie charts are best used in the following situations:
Showing Proportional Relationships
Ideal for visualizing how each category contributes to a total, like sales distribution by product line.
Small Number of Categories
Best with 5–6 slices or fewer. Too many segments make the chart hard to read and interpret.
Comparing Parts to a Whole
Effective when the focus is on each segment’s percentage of the total.
Simple Storytelling
Great for straightforward data where immediate visual understanding is the goal, such as budget allocations.
Avoid using pie charts when:
There are many small or similarly sized categories.
You need to compare slices precisely.
The data is time-series or trend-based (use line or bar charts instead).
Best Practices for Designing Effective Pie Charts
To make your pie charts both attractive and easy to understand, follow these proven design tips:
Start with Strategic Slice Ordering
Arrange slices in descending order, beginning with the largest at the 12 o’clock position and moving clockwise. This enhances readability and highlights the most significant categories first.
Combine Minor Categories
When you have numerous small segments, group them into an “Other” category. This simplifies the chart and prevents clutter. For instance, if eight categories are under 3%, merge them into a single slice labeled “Other.”
Avoid Misleading Visual Effects
Steer clear of 3D effects, drop shadows, and beveled edges—they can distort slice sizes and mislead viewers. Stick to clean, 2D visuals for accuracy and clarity.
Label Clearly and Directly
Always include both the category name and its corresponding percentage on or beside each slice. This removes the need for legends and ensures immediate comprehension (e.g., "Operations: 30%" instead of just "Operations").
Use Distinctive Colors
Choose easily distinguishable colors for adjacent slices. Avoid using similar shades, especially for neighboring categories, to reduce confusion and improve legibility.
Keep "Other" in Check
If the "Other" category becomes too large (e.g., 40% or more), consider breaking it down into its most significant components. An overly large "Other" slice undermines the clarity of your visualization.
Examples
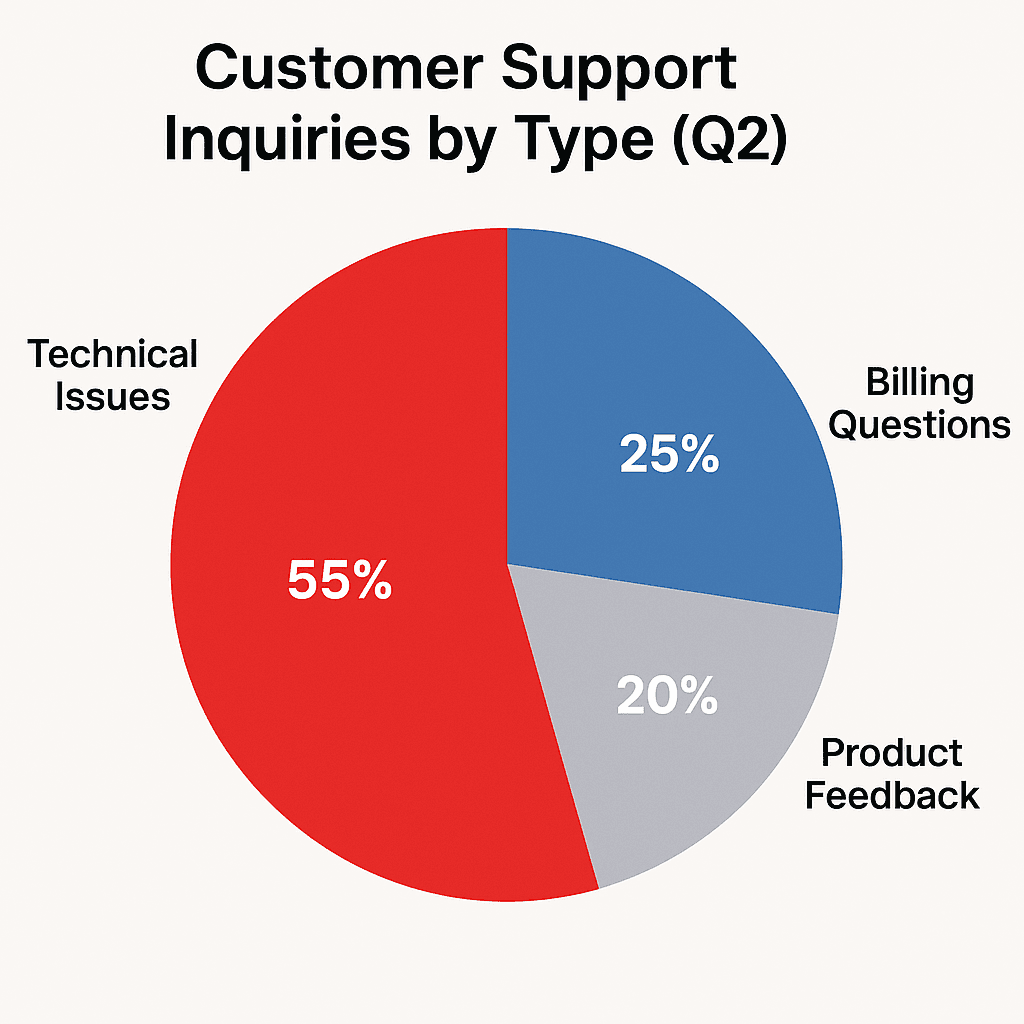
This pie chart visualizes the distribution of customer support inquiries.
The largest slice, representing “Technical Issues,” is highlighted in a vibrant red to emphasize its urgency and volume.
Smaller categories such as “Billing Questions” and “Product Feedback” are shown in muted blues and grays to avoid visual clutter.
Clear percentage labels on each slice help the viewer immediately understand which types of issues dominate customer support traffic.
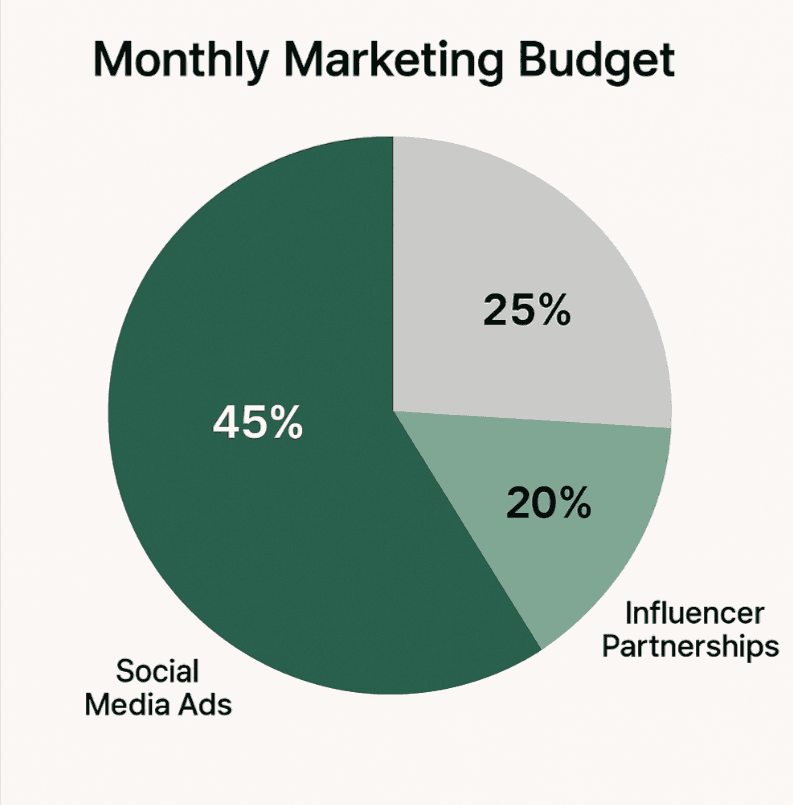
This pie chart breaks down a monthly marketing budget across different channels.
“Social Media Ads” takes up nearly half the chart and is displayed in a rich green, making its importance visually obvious.
“Email Campaigns,” “Influencer Partnerships,” and “Events” share the remaining portion in lighter tones, each slice spaced just enough for easy comparison.
A minimalistic design and no legend allow viewers to grasp the budget allocation at a glance, ideal for presentations or dashboards.
Limitations of Traditional Pie Chart Creators
While traditional tools like Excel and Google Sheets have made pie chart creation widely accessible, they come with notable limitations—especially as data complexity increases or design quality becomes a priority:
Manual formatting effort: Users often spend unnecessary time adjusting colors, labels, and slice order to achieve clarity.
Limited design flexibility: Default styles can appear outdated or lack the polish required for professional reports and modern presentations.
Static visuals: Traditional tools typically produce non-interactive charts, making them less engaging for digital dashboards or web-based storytelling.
No AI assistance: These tools don’t offer intelligent chart suggestions or data insight generation, which means users must know exactly what they want to create.
Difficulty handling messy data: Without built-in AI support, users must clean and reformat data manually before charting, which can be time-consuming and error-prone.
As data presentation becomes more dynamic and user expectations rise, these limitations highlight the growing value of AI-powered pie chart tools.
How AI Is Making Pie Chart Creation Easier (Especially for Non-Tech Users)
Artificial intelligence is revolutionizing how we create pie charts—making the process faster, more intuitive, and accessible even for users with no technical background. Instead of manually formatting charts or struggling with complex tools, users can now rely on AI to handle the heavy lifting. From data interpretation to visual design, AI-powered chart tools simplify every step of the process.
Here’s how AI is transforming pie chart creation:
Natural language input: Users can simply type commands like “show product sales by region” and instantly get a well-designed pie chart.
Automatic data formatting: AI detects data types, removes duplicates, and organizes datasets before visualization—no cleaning required.
Smart chart suggestions: Based on the data structure and context, AI recommends whether a pie chart is the best option or if another chart type is more suitable.
Instant styling and color optimization: AI automatically applies visual design principles, such as using distinct colors, balancing proportions, and labeling clearly.
One-click customization: Change chart styles, update labels, or switch themes with minimal effort, thanks to intelligent editing tools.
Cloud-based access and integration: AI tools often work seamlessly across platforms, allowing charts to be embedded in slides, reports, or dashboards instantly.
This shift means non-designers and non-coders alike can now produce clear, compelling pie charts in a matter of minutes—perfect for teams, students, and business users alike.
Best AI Pie Chart Makers: Top Tools You Should Know
Below are some of the top AI-driven tools for generating pie charts, complete with brief overviews and key features:
Powerdrill
Overview:
Powerdrill is an advanced AI data visualization tool designed for professionals and businesses handling complex data. Its intuitive interface allows you to generate pie charts with minimal effort, using AI to recommend the most effective chart types and formatting.
Key Features:
AI-driven chart recommendations based on data structure
Easy data import from Excel, Google Sheets, SQL, and APIs
Customizable chart styles with color themes, labels, and interactive features
Ability to integrate pie charts into dashboards or reports
Support for real-time collaboration and multi-source data analysis
ChartGPT
Overview:
ChartGPT is a user-friendly, AI-based chart creation assistant that can generate pie charts simply by interpreting natural language prompts (e.g., “Create a pie chart of market share by company”).
Key Features:
Converts plain English prompts into visual charts instantly
Supports CSV and pasted data inputs
Ideal for non-technical users who prefer text-based interfaces
Integrates with platforms like Notion, Slack, and Google Docs
Downloadable charts for presentations and reports
Canva AI Charts
Overview:
Canva's AI-enhanced chart feature blends design aesthetics with automation, helping users create visually appealing pie charts without needing design expertise.
Key Features:
Drag-and-drop interface with AI-assisted layout suggestions
Automatic color harmonization and label placement
Templates for reports, infographics, and social media
Real-time editing and team collaboration
Export options in PNG, PDF, and PPT formats
Visme
Overview:
Visme is a data storytelling platform that uses AI to simplify visual creation. It’s popular for business reports, proposals, and marketing content.
Key Features:
AI-driven smart chart wizard for visualizing uploaded data
Advanced customization tools for branding and styling
Integrates pie charts into interactive presentations
Templates for business, education, and non-profit use cases
Supports embedding, sharing, and analytics tracking
Final Thoughts
Pie charts are a valuable tool for visual storytelling—when used appropriately. They simplify complex data into an easy-to-digest format and make comparisons between categories intuitive. However, like any visualization tool, they should be applied thoughtfully, considering the nature and complexity of your data.
By understanding their strengths, limitations, best practices, and available tools, you can create pie charts that not only look good but also communicate your message effectively.
Whether you're presenting to stakeholders, analyzing survey results, or creating content for your audience, mastering the art of the pie chart is a smart move in today’s data-driven world.